Data Icon
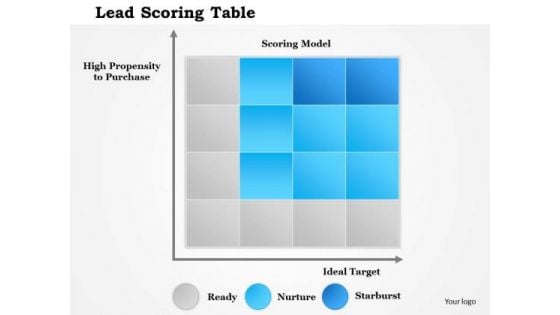
Business Framework Lead Scoring Table PowerPoint Presentation
A graph style cubical chart has been used to decorate this power point template slide. This PPT slide contains the concept of explaining score. Use this score table for displaying any data.

Business Diagram Business Diagram 3d Bulb With Stair Design For Idea Generation Presentation Templat
This business diagram has been designed with graphic of light bulb and stairs and icons. These stairs contains various business icons. This professional slide depicts innovative business ideas. Use this PPT slide for your business presentations.
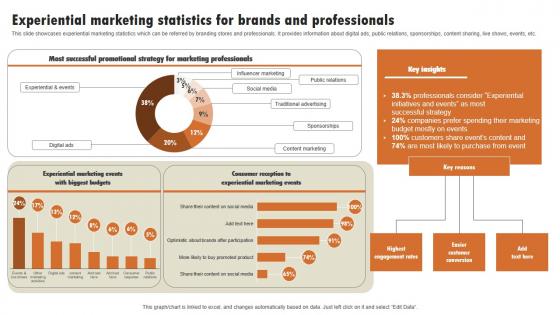
Experiential Marketing Statistics For Brands And Experiential Marketing Technique Designs PDF
This slide showcases experiential marketing statistics which can be referred by branding stores and professionals. It provides information about digital ads, public relations, sponsorships, content sharing, live shows, events, etc. Explore a selection of the finest Experiential Marketing Statistics For Brands And Experiential Marketing Technique Designs PDF here. With a plethora of professionally designed and pre-made slide templates, you can quickly and easily find the right one for your upcoming presentation. You can use our Experiential Marketing Statistics For Brands And Experiential Marketing Technique Designs PDF to effectively convey your message to a wider audience. Slidegeeks has done a lot of research before preparing these presentation templates. The content can be personalized and the slides are highly editable. Grab templates today from Slidegeeks. This slide showcases experiential marketing statistics which can be referred by branding stores and professionals. It provides information about digital ads, public relations, sponsorships, content sharing, live shows, events, etc.
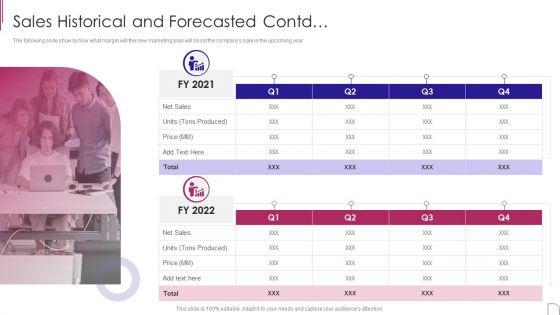
Yearly Product Performance Assessment Repor Sales Historical And Forecasted Contd Information PDF
The following slide show by how what margin will the new marketing plan will boost the companys sale in the upcoming year.Deliver an awe inspiring pitch with this creative Yearly Product Performance Assessment Repor Sales Historical And Forecasted Contd Information PDF bundle. Topics like Historical Data, Forecasted Data, Tons Produced can be discussed with this completely editable template. It is available for immediate download depending on the needs and requirements of the user.
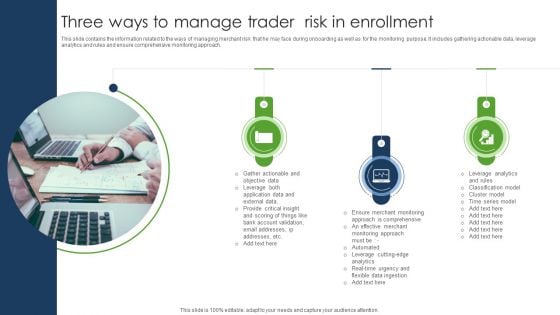
Three Ways To Manage Trader Risk In Enrollment Summary PDF
This slide contains the information related to the ways of managing merchant risk that he may face during onboarding as well as for the monitoring purpose. It includes gathering actionable data, leverage analytics and rules and ensure comprehensive monitoring approach. Presenting Three Ways To Manage Trader Risk In Enrollment Summary PDF to dispense important information. This template comprises three stages. It also presents valuable insights into the topics including Leverage Analytics, Application Data, External Data. This is a completely customizable PowerPoint theme that can be put to use immediately. So, download it and address the topic impactfully.
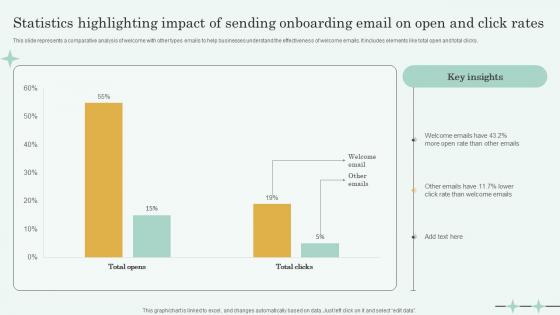
Statistics Highlighting Impact Of Sending Onboarding Email On Open And Click Rates Sample Pdf
This slide represents a comparative analysis of welcome with other types emails to help businesses understand the effectiveness of welcome emails. It includes elements like total open and total clicks. Pitch your topic with ease and precision using this Statistics Highlighting Impact Of Sending Onboarding Email On Open And Click Rates Sample Pdf. This layout presents information on Welcome Emails, Open Rate, Sending Onboarding Email. It is also available for immediate download and adjustment. So, changes can be made in the color, design, graphics or any other component to create a unique layout. This slide represents a comparative analysis of welcome with other types emails to help businesses understand the effectiveness of welcome emails. It includes elements like total open and total clicks.
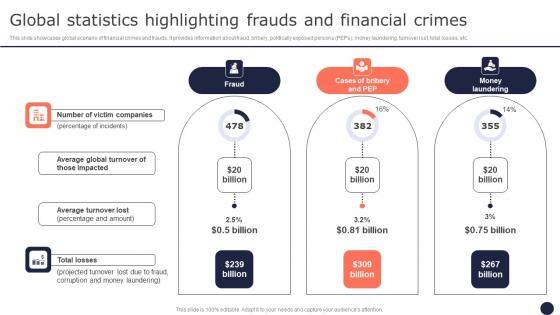
Global Statistics Highlighting Frauds And Financial Mitigating Corporate Scams And Robberies Clipart Pdf
This slide showcases global scenario of financial crimes and frauds. It provides information about fraud, bribery, politically exposed persons PEPs, money laundering, turnover lost, total losses, etc. Are you in need of a template that can accommodate all of your creative concepts This one is crafted professionally and can be altered to fit any style. Use it with Google Slides or PowerPoint. Include striking photographs, symbols, depictions, and other visuals. Fill, move around, or remove text boxes as desired. Test out color palettes and font mixtures. Edit and save your work, or work with colleagues. Download Global Statistics Highlighting Frauds And Financial Mitigating Corporate Scams And Robberies Clipart Pdf and observe how to make your presentation outstanding. Give an impeccable presentation to your group and make your presentation unforgettable. This slide showcases global scenario of financial crimes and frauds. It provides information about fraud, bribery, politically exposed persons PEPs, money laundering, turnover lost, total losses, etc.
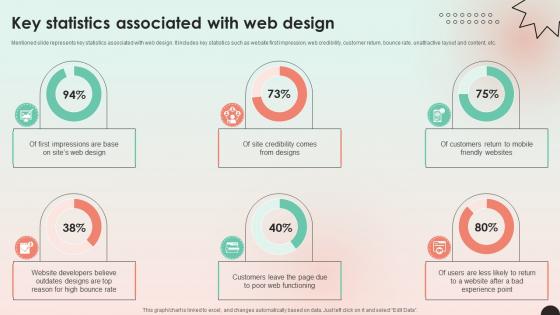
Web Consulting Business Performance Key Statistics Associated With Web Design
Mentioned slide represents key statistics associated with web design. It includes key statistics such as website first impression, web credibility, customer return, bounce rate, unattractive layout and content, etc. Do you have an important presentation coming up Are you looking for something that will make your presentation stand out from the rest Look no further than Web Consulting Business Performance Key Statistics Associated With Web Design. With our professional designs, you can trust that your presentation will pop and make delivering it a smooth process. And with Slidegeeks, you can trust that your presentation will be unique and memorable. So why wait Grab Web Consulting Business Performance Key Statistics Associated With Web Design today and make your presentation stand out from the rest Mentioned slide represents key statistics associated with web design. It includes key statistics such as website first impression, web credibility, customer return, bounce rate, unattractive layout and content, etc.
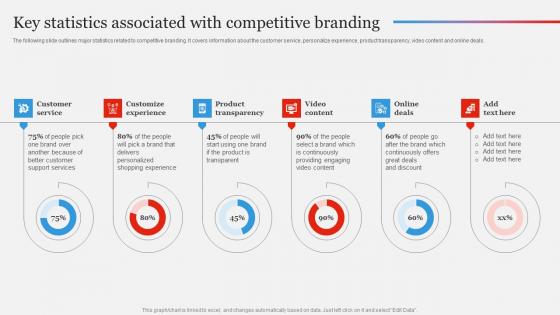
Key Statistics Associated Branding Strategy To Gain Competitive Edge Elements Pdf
The following slide outlines major statistics related to competitive branding. It covers information about the customer service, personalize experience, product transparency, video content and online deals. Coming up with a presentation necessitates that the majority of the effort goes into the content and the message you intend to convey. The visuals of a PowerPoint presentation can only be effective if it supplements and supports the story that is being told. Keeping this in mind our experts created Key Statistics Associated Branding Strategy To Gain Competitive Edge Elements Pdf to reduce the time that goes into designing the presentation. This way, you can concentrate on the message while our designers take care of providing you with the right template for the situation. The following slide outlines major statistics related to competitive branding. It covers information about the customer service, personalize experience, product transparency, video content and online deals.

Key Statistics Associated With Global E Commerce Smartphones Industry Report PPT Presentation IR SS V
The slide presents a comprehensive overview of the e commerce electronics market in order to give stakeholders useful information that will help them make strategic decisions. The statistics for the global markets are covered in the slide indicating the potential for any new business, product, or service. If you are looking for a format to display your unique thoughts, then the professionally designed Key Statistics Associated With Global E Commerce Smartphones Industry Report PPT Presentation IR SS V is the one for you. You can use it as a Google Slides template or a PowerPoint template. Incorporate impressive visuals, symbols, images, and other charts. Modify or reorganize the text boxes as you desire. Experiment with shade schemes and font pairings. Alter, share or cooperate with other people on your work. Download Key Statistics Associated With Global E Commerce Smartphones Industry Report PPT Presentation IR SS V and find out how to give a successful presentation. Present a perfect display to your team and make your presentation unforgettable. The slide presents a comprehensive overview of the e commerce electronics market in order to give stakeholders useful information that will help them make strategic decisions. The statistics for the global markets are covered in the slide indicating the potential for any new business, product, or service.
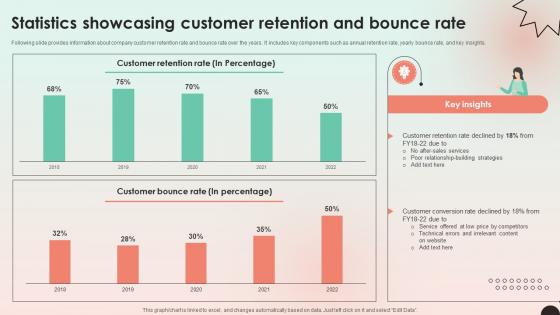
Web Consulting Business Performance Statistics Showcasing Customer Retention
Following slide provides information about company customer retention rate and bounce rate over the years. It includes key components such as annual retention rate, yearly bounce rate, and key insights. Find highly impressive Web Consulting Business Performance Statistics Showcasing Customer Retention on Slidegeeks to deliver a meaningful presentation. You can save an ample amount of time using these presentation templates. No need to worry to prepare everything from scratch because Slidegeeks experts have already done a huge research and work for you. You need to download Web Consulting Business Performance Statistics Showcasing Customer Retention for your upcoming presentation. All the presentation templates are 100 percent editable and you can change the color and personalize the content accordingly. Download now Following slide provides information about company customer retention rate and bounce rate over the years. It includes key components such as annual retention rate, yearly bounce rate, and key insights.
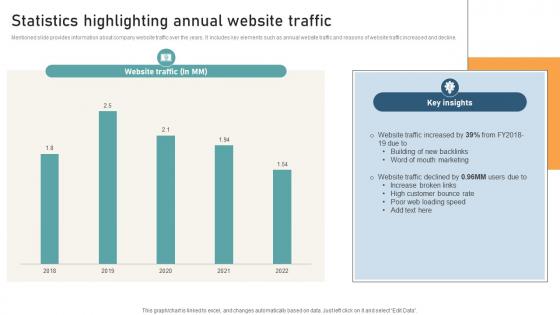
Comprehensive Guide For Website Statistics Highlighting Annual Website Traffic
Mentioned slide provides information about company website traffic over the years. It includes key elements such as annual website traffic and reasons of website traffic increased and decline. Find highly impressive Comprehensive Guide For Website Statistics Highlighting Annual Website Traffic on Slidegeeks to deliver a meaningful presentation. You can save an ample amount of time using these presentation templates. No need to worry to prepare everything from scratch because Slidegeeks experts have already done a huge research and work for you. You need to download Comprehensive Guide For Website Statistics Highlighting Annual Website Traffic for your upcoming presentation. All the presentation templates are 100 percent editable and you can change the color and personalize the content accordingly. Download now Mentioned slide provides information about company website traffic over the years. It includes key elements such as annual website traffic and reasons of website traffic increased and decline.
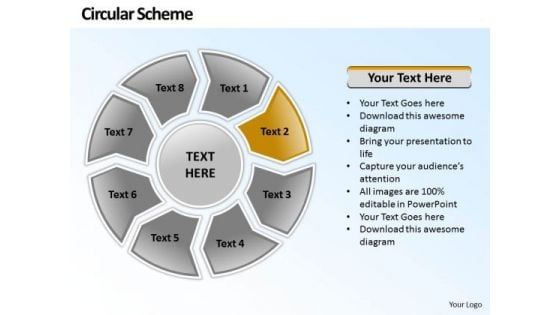
Ppt Circular PowerPoint Menu Template Scheme 8 Phase Diagram Templates
PPT circular powerpoint menu template scheme 8 phase diagram Templates-Use this graphical approach to represent global business issues such as financial data, stock market Exchange, increase in sales, corporate presentations and more. It illustrates the second stage of the process.-PPT circular powerpoint menu template scheme 8 phase diagram Templates-Arrow, Art, Blue, Business, Button, Circular, Clip, Design, Diagram, Drop, Element, Glowing, Graph, Graphic, Icon, Illustration, Isolated, Process, Round, Set, Shadow, Sphere, Symbol Our Ppt Circular PowerPoint Menu Template Scheme 8 Phase Diagram Templates provide a common thread. Stitch all different factions together.
Brand Tracking Info Graphics Ppt PowerPoint Presentation Infographic Template Graphics Download
This is a brand tracking info graphics ppt powerpoint presentation infographic template graphics download. This is a four stage process. The stages in this process are business, marketing, finance, strategy, icons.

Business Framework Shed Light On Topic Flashlight PowerPoint Presentation
This Power Point template slide has been designed with graphic of torch. This flash light has been used to display the concept of highlighting the any business data. Use this business slide for your technical presentation.
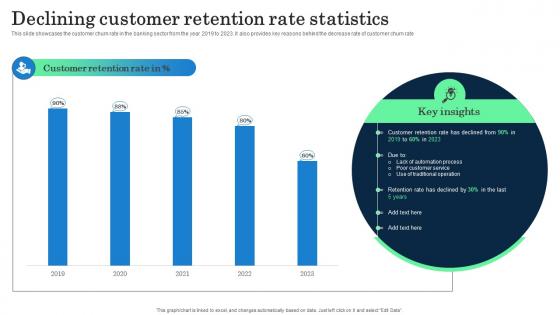
Declining Customer Retention Rate Statistics Incorporating Banking Operational Growth
This slide showcases the customer churn rate in the banking sector from the year 2019 to 2023. it also provides key reasons behind the decrease rate of customer churn rate. Are you in need of a template that can accommodate all of your creative concepts This one is crafted professionally and can be altered to fit any style. Use it with Google Slides or PowerPoint. Include striking photographs, symbols, depictions, and other visuals. Fill, move around, or remove text boxes as desired. Test out color palettes and font mixtures. Edit and save your work, or work with colleagues. Download Declining Customer Retention Rate Statistics Incorporating Banking Operational Growth and observe how to make your presentation outstanding. Give an impeccable presentation to your group and make your presentation unforgettable. This slide showcases the customer churn rate in the banking sector from the year 2019 to 2023. it also provides key reasons behind the decrease rate of customer churn rate
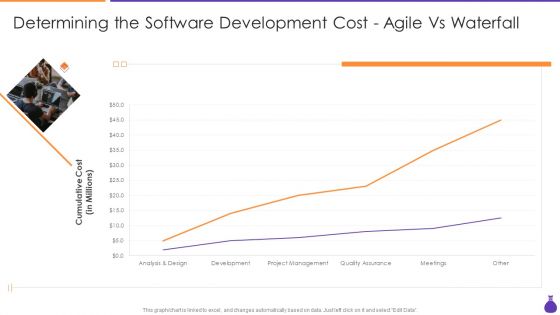
Why Is Agile Cost Effective IT Determining The Software Development Cost Agile Demonstration PDF
This graph or chart is linked to excel, and changes automatically based on data. Just left click on it and select Edit Data. Deliver and pitch your topic in the best possible manner with this Why Is Agile Cost Effective IT Determining The Software Development Cost Agile Demonstration PDF. Use them to share invaluable insights on Analysis And Design, Development, Project Management, Quality Assurance and impress your audience. This template can be altered and modified as per your expectations. So, grab it now.
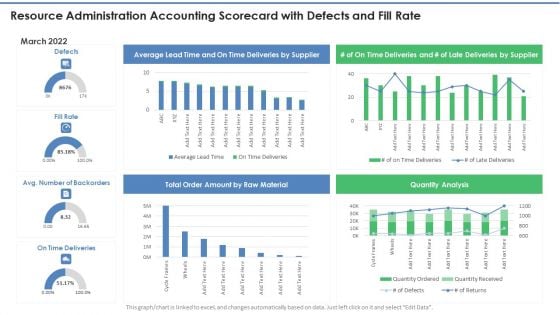
Resource Administration Accounting Scorecard With Defects And Fill Rate Mockup PDF
This graph or chart is linked to excel, and changes automatically based on data. Just left click on it and select Edit Data. Deliver and pitch your topic in the best possible manner with this Resource Administration Accounting Scorecard With Defects And Fill Rate Mockup PDF. Use them to share invaluable insights on Total Order Amount, Raw Material, Quantity Analysis and impress your audience. This template can be altered and modified as per your expectations. So, grab it now.
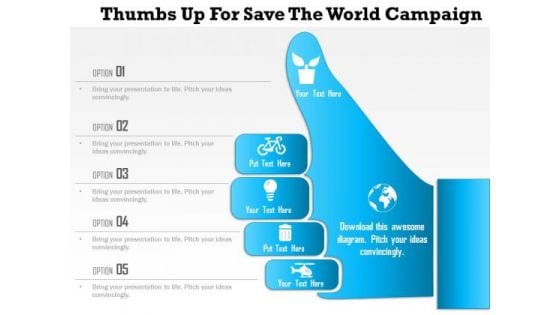
Business Diagram Thumbs Up For Save The World Campaign Presentation Template
This Power Point diagram has been crafted with graphic of text boxes with icons. It contains diagram of thumb up hand graphics with communication icons. Use this diagram to build professional presentation for your viewers.
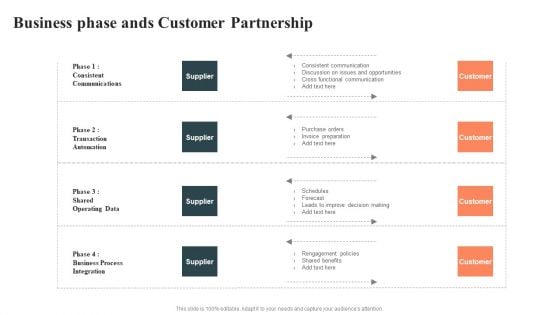
Business Phase Ands Customer Partnership Formats PDF
Pitch your topic with ease and precision using this Business Phase Ands Customer Partnership Formats PDF. This layout presents information on Supplier, Cross Functional Communication, Operating Data. It is also available for immediate download and adjustment. So, changes can be made in the color, design, graphics or any other component to create a unique layout.
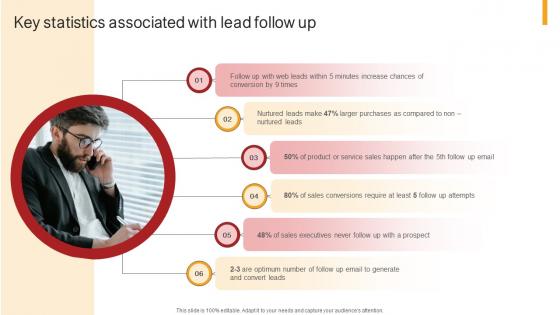
Remote Sales Plan For Lead Key Statistics Associated With Lead Follow Up Strategy SS V
Retrieve professionally designed Remote Sales Plan For Lead Key Statistics Associated With Lead Follow Up Strategy SS V to effectively convey your message and captivate your listeners. Save time by selecting pre-made slideshows that are appropriate for various topics, from business to educational purposes. These themes come in many different styles, from creative to corporate, and all of them are easily adjustable and can be edited quickly. Access them as PowerPoint templates or as Google Slides themes. You do not have to go on a hunt for the perfect presentation because Slidegeeks got you covered from everywhere. Our Remote Sales Plan For Lead Key Statistics Associated With Lead Follow Up Strategy SS V are topically designed to provide an attractive backdrop to any subject. Use them to look like a presentation pro.
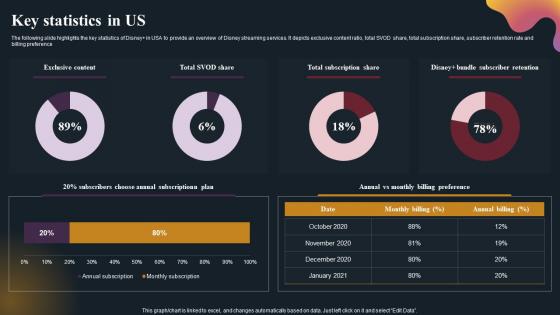
Key Statistics In Us OTT Platform Company Outline Brochure Pdf
The following slide highlights the key statistics of DisneyPlus in USA to provide an overview of Disney streaming services. It depicts exclusive content ratio, total SVOD share, total subscription share, subscriber retention rate and billing preference. Crafting an eye-catching presentation has never been more straightforward. Let your presentation shine with this tasteful yet straightforward Key Statistics In Us OTT Platform Company Outline Brochure Pdf template. It offers a minimalistic and classy look that is great for making a statement. The colors have been employed intelligently to add a bit of playfulness while still remaining professional. Construct the ideal Key Statistics In Us OTT Platform Company Outline Brochure Pdf that effortlessly grabs the attention of your audience Begin now and be certain to wow your customers The following slide highlights the key statistics of DisneyPlus in USA to provide an overview of Disney streaming services. It depicts exclusive content ratio, total SVOD share, total subscription share, subscriber retention rate and billing preference
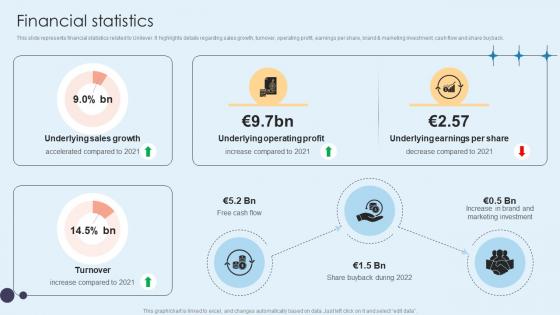
Financial Statistics Home Care Solutions Company Profile CP SS V
This slide represents financial statistics related to Unilever. It highlights details regarding sales growth, turnover, operating profit, earnings per share, brand and marketing investment, cash flow and share buyback.Formulating a presentation can take up a lot of effort and time, so the content and message should always be the primary focus. The visuals of the PowerPoint can enhance the presenters message, so our Financial Statistics Home Care Solutions Company Profile CP SS V was created to help save time. Instead of worrying about the design, the presenter can concentrate on the message while our designers work on creating the ideal templates for whatever situation is needed. Slidegeeks has experts for everything from amazing designs to valuable content, we have put everything into Financial Statistics Home Care Solutions Company Profile CP SS V. This slide represents financial statistics related to Unilever. It highlights details regarding sales growth, turnover, operating profit, earnings per share, brand and marketing investment, cash flow and share buyback.

Key Statistics Associated With Global Laptops Market Smartphones Industry Report PPT Template IR SS V
The slide presents a comprehensive overview of the laptops market in order to give stakeholders useful information that will help them make strategic decisions. The statistics for the global markets are covered in the slide indicating the potential for any new business, product, or service. Are you in need of a template that can accommodate all of your creative concepts This one is crafted professionally and can be altered to fit any style. Use it with Google Slides or PowerPoint. Include striking photographs, symbols, depictions, and other visuals. Fill, move around, or remove text boxes as desired. Test out color palettes and font mixtures. Edit and save your work, or work with colleagues. Download Key Statistics Associated With Global Laptops Market Smartphones Industry Report PPT Template IR SS V and observe how to make your presentation outstanding. Give an impeccable presentation to your group and make your presentation unforgettable. The slide presents a comprehensive overview of the laptops market in order to give stakeholders useful information that will help them make strategic decisions. The statistics for the global markets are covered in the slide indicating the potential for any new business, product, or service.
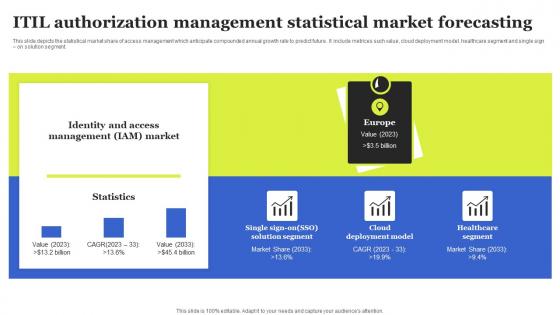
ITIL Authorization Management Statistical Market Forecasting Diagrams Pdf
This slide depicts the statistical market share of access management which anticipate compounded annual growth rate to predict future. It include metrices such value, cloud deployment model, healthcare segment and single sign on solution segment. Pitch your topic with ease and precision using this ITIL Authorization Management Statistical Market Forecasting Diagrams Pdf This layout presents information on Statistics, Cloud Deployment Model, Healthcare Segment It is also available for immediate download and adjustment. So, changes can be made in the color, design, graphics or any other component to create a unique layout. This slide depicts the statistical market share of access management which anticipate compounded annual growth rate to predict future. It include metrices such value, cloud deployment model, healthcare segment and single sign on solution segment.
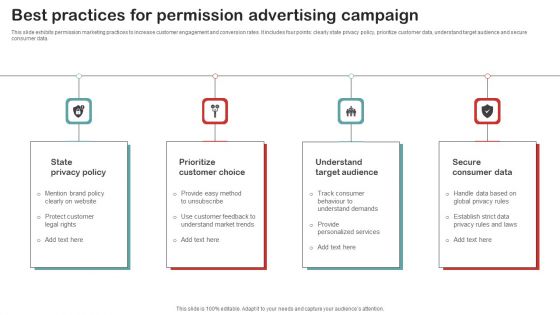
Best Practices For Permission Advertising Campaign Mockup PDF
This slide exhibits permission marketing practices to increase customer engagement and conversion rates. It includes four points clearly state privacy policy, prioritize customer data, understand target audience and secure consumer data. Presenting Best Practices For Permission Advertising Campaign Mockup PDF to dispense important information. This template comprises four stages. It also presents valuable insights into the topics including Understand Target Audience, Secure Consumer Data, Prioritize Customer Choice. This is a completely customizable PowerPoint theme that can be put to use immediately. So, download it and address the topic impactfully.
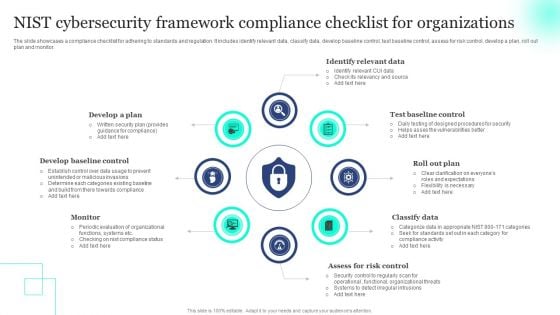
NIST Cybersecurity Framework Compliance Checklist For Organizations Inspiration PDF
The slide showcases a compliance checklist for adhering to standards and regulation. It includes identify relevant data, classify data, develop baseline control, test baseline control, assess for risk control, develop a plan, roll out plan and monitor. Presenting NIST Cybersecurity Framework Compliance Checklist For Organizations Inspiration PDF to dispense important information. This template comprises eight stages. It also presents valuable insights into the topics including Develop Baseline Control, Monitor, Classify Data. This is a completely customizable PowerPoint theme that can be put to use immediately. So, download it and address the topic impactfully.

Bar Graph Showing Revenues Generated By Sales Department Ppt Portfolio Graphics Example PDF
This graph or chart is linked to excel, and changes automatically based on data. Just left click on it and select edit data. Showcasing this set of slides titled bar graph showing revenues generated by sales department ppt portfolio graphics example pdf. The topics addressed in these templates are yearly sales revenues, sales team, profits. All the content presented in this PPT design is completely editable. Download it and make adjustments in color, background, font etc. as per your unique business setting.
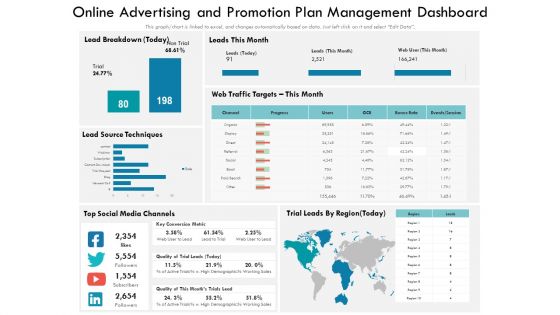
Online Advertising And Promotion Plan Management Dashboard Ppt PowerPoint Presentation Show Tips PDF
This graph chart is linked to excel, and changes automatically based on data. Just left click on it and select Edit Data. Showcasing this set of slides titled online advertising and promotion plan management dashboard ppt powerpoint presentation show tips pdf. The topics addressed in these templates are source techniques, social media channels, traffic targets. All the content presented in this PPT design is completely editable. Download it and make adjustments in color, background, font etc. as per your unique business setting.
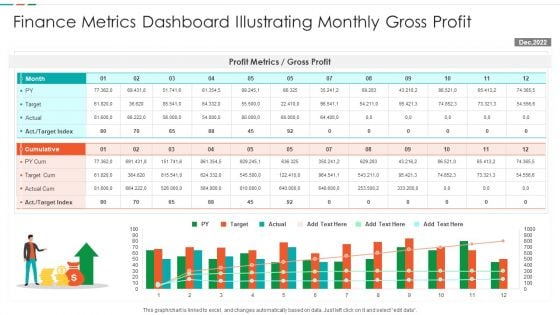
Finance Metrics Dashboard Illustrating Monthly Gross Profit Formats PDF
This graph or chart is linked to excel, and changes automatically based on data. Just left click on it and select edit data. Showcasing this set of slides titled Finance Metrics Dashboard Illustrating Monthly Gross Profit Formats PDF. The topics addressed in these templates are Profit Metrics Gross, Profit Target Cum, Actual Cum Target. All the content presented in this PPT design is completely editable. Download it and make adjustments in color, background, font etc. as per your unique business setting.
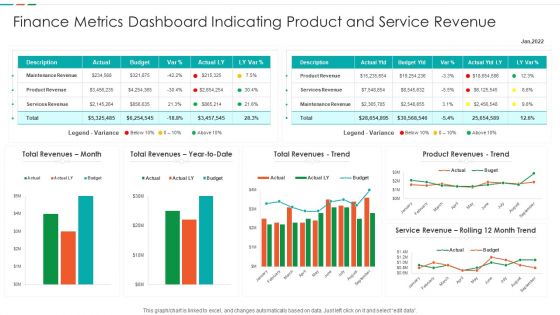
Finance Metrics Dashboard Indicating Product And Service Revenue Designs PDF
This graph or chart is linked to excel, and changes automatically based on data. Just left click on it and select edit data. Showcasing this set of slides titled Finance Metrics Dashboard Indicating Product And Service Revenue Designs PDF. The topics addressed in these templates are Maintenance Revenue Product, Revenue Product Revenues, Service Revenue Rolling. All the content presented in this PPT design is completely editable. Download it and make adjustments in color, background, font etc. as per your unique business setting.
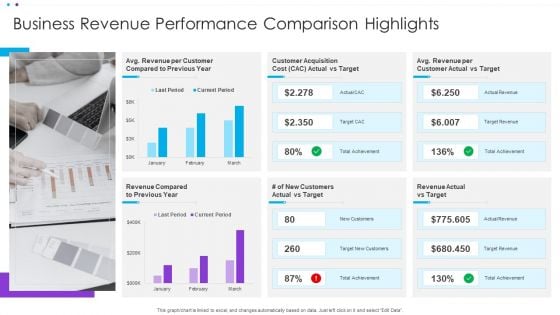
Business Revenue Performance Comparison Highlights Ppt Summary Rules PDF
This graph or chart is linked to excel, and changes automatically based on data. Just left click on it and select Edit Data. Showcasing this set of slides titled Business Revenue Performance Comparison Highlights Ppt Summary Rules PDF. The topics addressed in these templates are Customer Acquisition, Customer Actual, Revenue Compared. All the content presented in this PPT design is completely editable. Download it and make adjustments in color, background, font etc. as per your unique business setting.
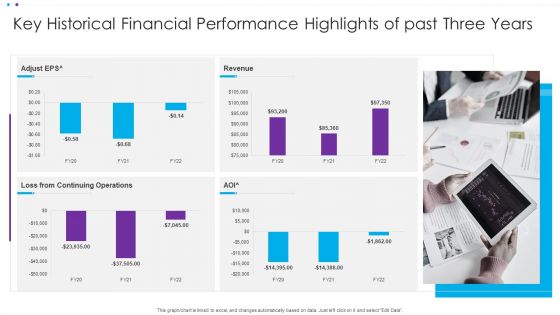
Key Historical Financial Performance Highlights Of Past Three Years Ppt Ideas Background PDF
This graph or chart is linked to excel, and changes automatically based on data. Just left click on it and select Edit Data. Showcasing this set of slides titled Key Historical Financial Performance Highlights Of Past Three Years Ppt Ideas Background PDF. The topics addressed in these templates are Continuing Operations, Adjust EP. All the content presented in this PPT design is completely editable. Download it and make adjustments in color, background, font etc. as per your unique business setting.
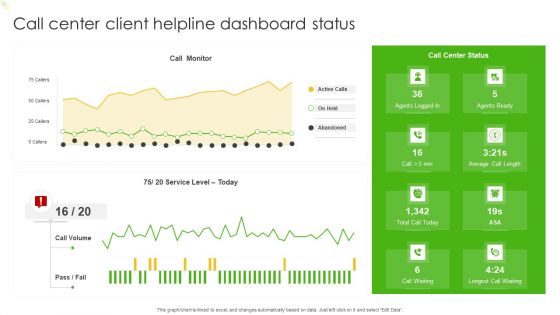
Call Center Client Helpline Dashboard Status Ppt Show Graphics Design PDF
This graph or chart is linked to excel, and changes automatically based on data. Just left click on it and select Edit Data. Showcasing this set of slides titled Call Center Client Helpline Dashboard Status Ppt Show Graphics Design PDF. The topics addressed in these templates are Call Monitor, Active Calls, Abandoned, Agents Ready. All the content presented in this PPT design is completely editable. Download it and make adjustments in color, background, font etc. as per your unique business setting.
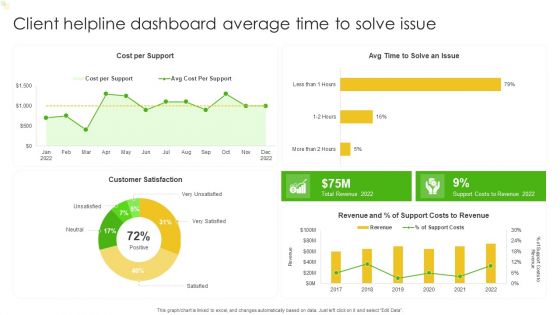
Client Helpline Dashboard Average Time To Solve Issue Ppt Portfolio Visuals PDF
This graph or chart is linked to excel, and changes automatically based on data. Just left click on it and select Edit Data. Showcasing this set of slides titled Client Helpline Dashboard Average Time To Solve Issue Ppt Portfolio Visuals PDF. The topics addressed in these templates are Cost Per Support, Customer Satisfaction, Costs To Revenue. All the content presented in this PPT design is completely editable. Download it and make adjustments in color, background, font etc. as per your unique business setting.
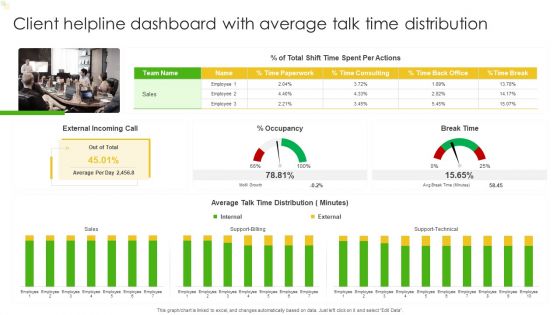
Client Helpline Dashboard With Average Talk Time Distribution Ppt Gallery Backgrounds PDF
This graph or chart is linked to excel, and changes automatically based on data. Just left click on it and select Edit Data. Showcasing this set of slides titled Client Helpline Dashboard With Average Talk Time Distribution Ppt Gallery Backgrounds PDF. The topics addressed in these templates are External Incoming Call, Occupancy, Break Time, Sales. All the content presented in this PPT design is completely editable. Download it and make adjustments in color, background, font etc. as per your unique business setting.
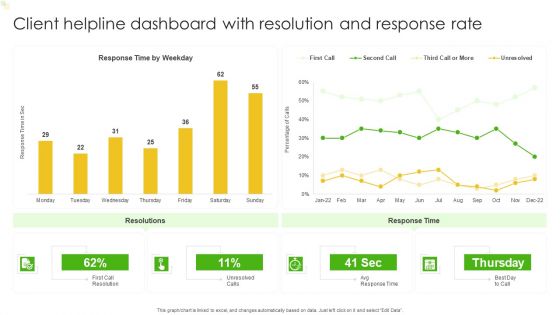
Client Helpline Dashboard With Resolution And Response Rate Ppt File Example Topics PDF
This graph or chart is linked to excel, and changes automatically based on data. Just left click on it and select Edit Data. Showcasing this set of slides titled Client Helpline Dashboard With Resolution And Response Rate Ppt File Example Topics PDF. The topics addressed in these templates are Resolutions, Response Time, Response Time Weekday. All the content presented in this PPT design is completely editable. Download it and make adjustments in color, background, font etc. as per your unique business setting.
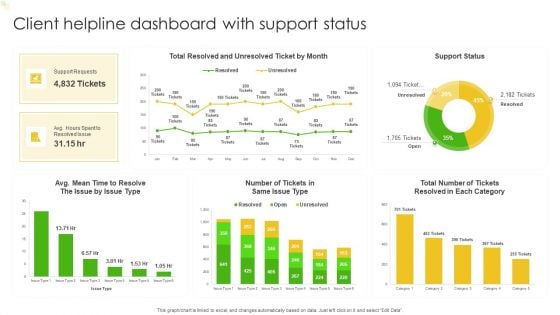
Client Helpline Dashboard With Support Status Ppt Portfolio Rules PDF
This graph or chart is linked to excel, and changes automatically based on data. Just left click on it and select Edit Data. Showcasing this set of slides titled Client Helpline Dashboard With Support Status Ppt Portfolio Rules PDF. The topics addressed in these templates are Total Number, Support Requests, Total Resolved, Support Status. All the content presented in this PPT design is completely editable. Download it and make adjustments in color, background, font etc. as per your unique business setting.
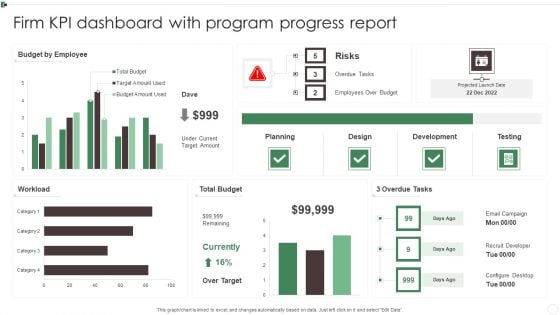
Firm KPI Dashboard With Program Progress Report Ppt Pictures Deck PDF
This graph or chart is linked to excel, and changes automatically based on data. Just left click on it and select Edit Data. Showcasing this set of slides titled Firm KPI Dashboard With Program Progress Report Ppt Pictures Deck PDF. The topics addressed in these templates are Budget By Employee, Total Budget, 3 Overdue Tasks, Workload. All the content presented in this PPT design is completely editable. Download it and make adjustments in color, background, font etc. as per your unique business setting.
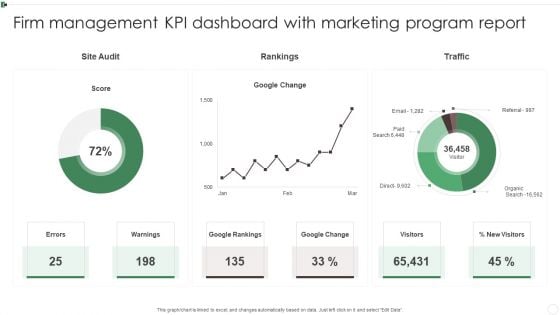
Firm Management KPI Dashboard With Marketing Program Report Ppt Styles Introduction PDF
This graph or chart is linked to excel, and changes automatically based on data. Just left click on it and select Edit Data. Showcasing this set of slides titled Firm Management KPI Dashboard With Marketing Program Report Ppt Styles Introduction PDF. The topics addressed in these templates are Google Rankings, Google Change, Warnings, Visitors. All the content presented in this PPT design is completely editable. Download it and make adjustments in color, background, font etc. as per your unique business setting.
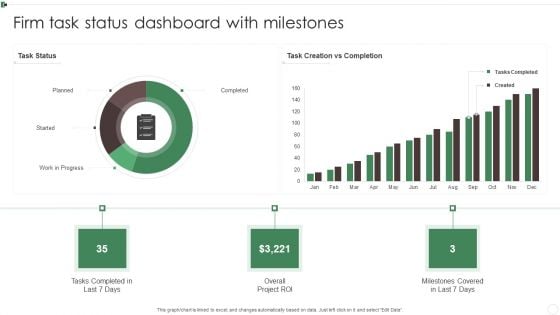
Firm Task Status Dashboard With Milestones Ppt Show Sample PDF
This graph or chart is linked to excel, and changes automatically based on data. Just left click on it and select Edit Data. Showcasing this set of slides titled Firm Task Status Dashboard With Milestones Ppt Show Sample PDF. The topics addressed in these templates are Tasks Completed, Planned, Work Progress, Overall Project ROI. All the content presented in this PPT design is completely editable. Download it and make adjustments in color, background, font etc. as per your unique business setting.
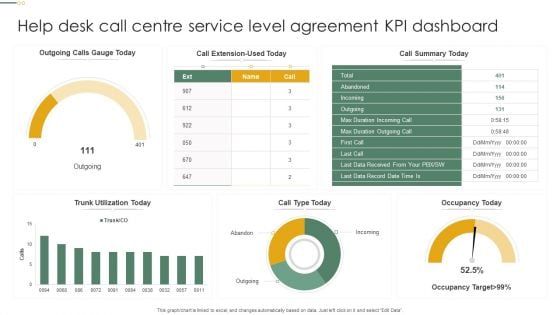
Help Desk Call Centre Service Level Agreement KPI Dashboard Pictures PDF
This graph or chart is linked to excel, and changes automatically based on data. Just left click on it and select Edit Data. Showcasing this set of slides titled Help Desk Call Centre Service Level Agreement KPI Dashboard Pictures PDF. The topics addressed in these templates are Call Type Today, Occupancy Today, Call Summary Today. All the content presented in this PPT design is completely editable. Download it and make adjustments in color, background, font etc. as per your unique business setting.
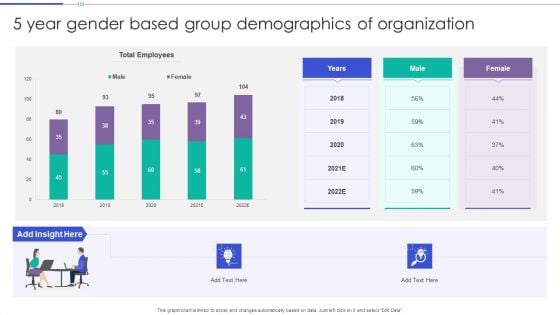
5 Year Gender Based Group Demographics Of Organization Background PDF
This graph or chart is linked to excel, and changes automatically based on data. Just left click on it and select Edit Data. Showcasing this set of slides titled 5 Year Gender Based Group Demographics Of Organization Background PDF. The topics addressed in these templates are Total Employees, Male, Female. All the content presented in this PPT design is completely editable. Download it and make adjustments in color, background, font etc. as per your unique business setting.
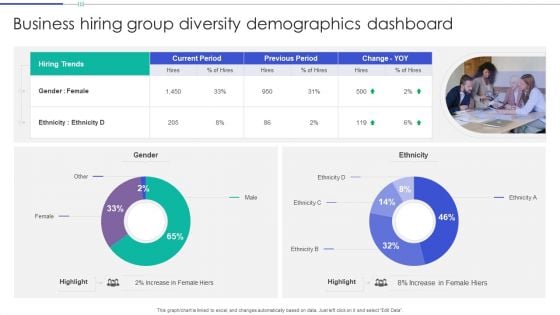
Business Hiring Group Diversity Demographics Dashboard Guidelines PDF
This graph or chart is linked to excel, and changes automatically based on data. Just left click on it and select Edit Data. Showcasing this set of slides titled Business Hiring Group Diversity Demographics Dashboard Guidelines PDF. The topics addressed in these templates are Hiring Trends, Current Period, Previous Period. All the content presented in this PPT design is completely editable. Download it and make adjustments in color, background, font etc. as per your unique business setting.
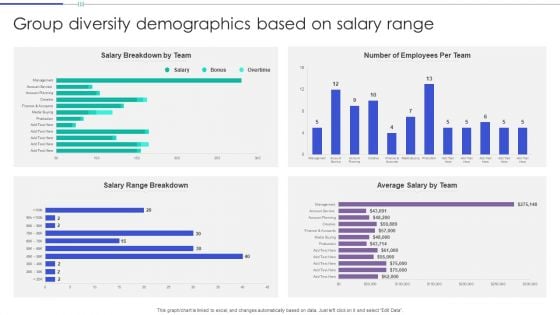
Group Diversity Demographics Based On Salary Range Portrait PDF
This graph or chart is linked to excel, and changes automatically based on data. Just left click on it and select Edit Data. Showcasing this set of slides titled Group Diversity Demographics Based On Salary Range Portrait PDF. The topics addressed in these templates are Salary Breakdown Team, Number Employees, Per Team. All the content presented in this PPT design is completely editable. Download it and make adjustments in color, background, font etc. as per your unique business setting.
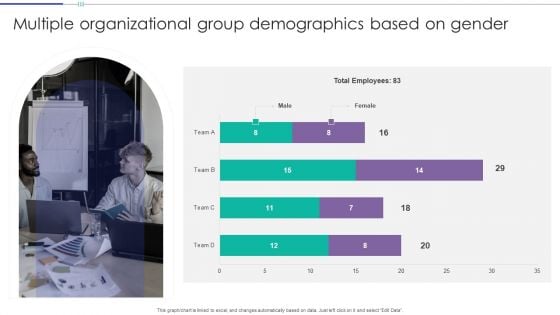
Multiple Organizational Group Demographics Based On Gender Download PDF
This graph or chart is linked to excel, and changes automatically based on data. Just left click on it and select Edit Data. Showcasing this set of slides titled Multiple Organizational Group Demographics Based On Gender Download PDF. The topics addressed in these templates are Total Employees, Team, Female. All the content presented in this PPT design is completely editable. Download it and make adjustments in color, background, font etc. as per your unique business setting.
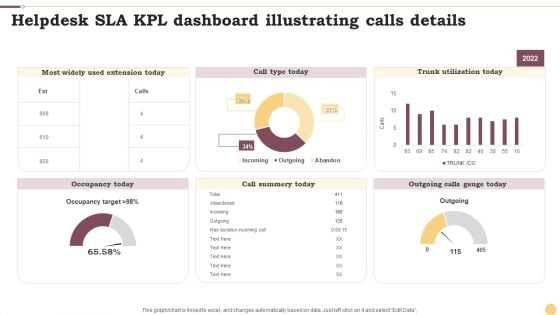
Helpdesk SLA KPL Dashboard Illustrating Calls Details Ppt Slides Show PDF
This graph or chart is linked to excel, and changes automatically based on data. Just left click on it and select Edit Data. Showcasing this set of slides titled Helpdesk SLA KPL Dashboard Illustrating Calls Details Ppt Slides Show PDF. The topics addressed in these templates are Call Type Today, Trunk Utilization Today, Call Summery Today. All the content presented in this PPT design is completely editable. Download it and make adjustments in color, background, font etc. as per your unique business setting.
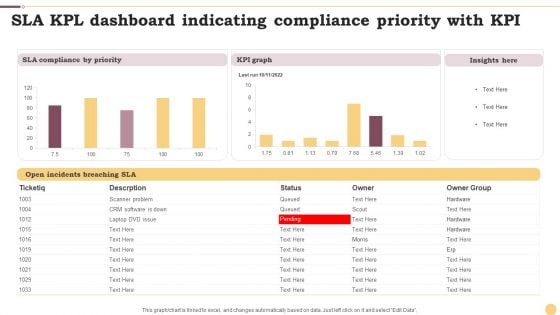
SLA KPL Dashboard Indicating Compliance Priority With KPI Ppt File Format PDF
This graph or chart is linked to excel, and changes automatically based on data. Just left click on it and select Edit Data. Showcasing this set of slides titled SLA KPL Dashboard Indicating Compliance Priority With KPI Ppt File Format PDF. The topics addressed in these templates are KPI Graph, Insights Here, SLA Compliance Priority. All the content presented in this PPT design is completely editable. Download it and make adjustments in color, background, font etc. as per your unique business setting.
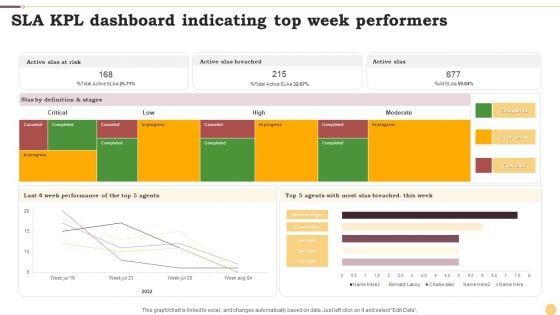
SLA KPL Dashboard Indicating Top Week Performers Ppt Infographics Examples PDF
This graph or chart is linked to excel, and changes automatically based on data. Just left click on it and select Edit Data. Showcasing this set of slides titled SLA KPL Dashboard Indicating Top Week Performers Ppt Infographics Examples PDF. The topics addressed in these templates are Active Slas Risk, Active Slas Breached, Active Slas. All the content presented in this PPT design is completely editable. Download it and make adjustments in color, background, font etc. as per your unique business setting.
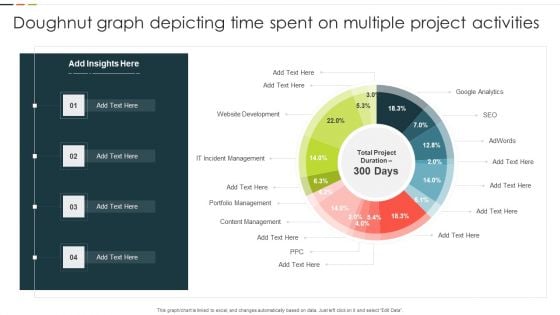
Doughnut Graph Depicting Time Spent On Multiple Project Activities Microsoft PDF
This graph or chart is linked to excel, and changes automatically based on data. Just left click on it and select Edit Data. Showcasing this set of slides titled Doughnut Graph Depicting Time Spent On Multiple Project Activities Microsoft PDF. The topics addressed in these templates are Website Development, IT Incident Management, Portfolio Management. All the content presented in this PPT design is completely editable. Download it and make adjustments in color, background, font etc. as per your unique business setting.
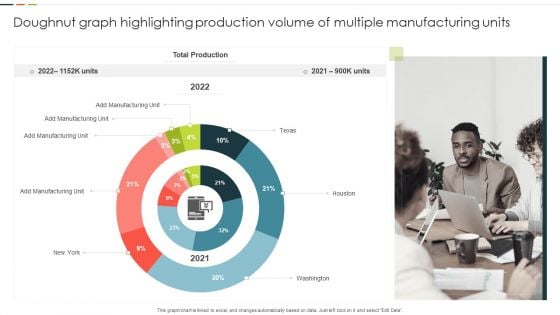
Doughnut Graph Highlighting Production Volume Of Multiple Manufacturing Units Guidelines PDF
This graph or chart is linked to excel, and changes automatically based on data. Just left click on it and select Edit Data. Showcasing this set of slides titled Doughnut Graph Highlighting Production Volume Of Multiple Manufacturing Units Guidelines PDF. The topics addressed in these templates are Total Production, Manufacturing Unit, Washington. All the content presented in this PPT design is completely editable. Download it and make adjustments in color, background, font etc. as per your unique business setting.
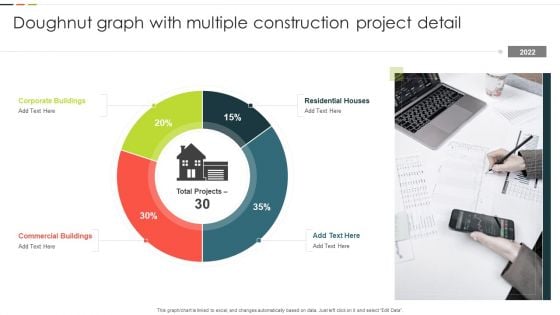
Doughnut Graph With Multiple Construction Project Detail Structure PDF
This graph or chart is linked to excel, and changes automatically based on data. Just left click on it and select Edit Data. Showcasing this set of slides titled Doughnut Graph With Multiple Construction Project Detail Structure PDF. The topics addressed in these templates are Corporate Buildings, Residential Houses, Commercial Buildings. All the content presented in this PPT design is completely editable. Download it and make adjustments in color, background, font etc. as per your unique business setting.
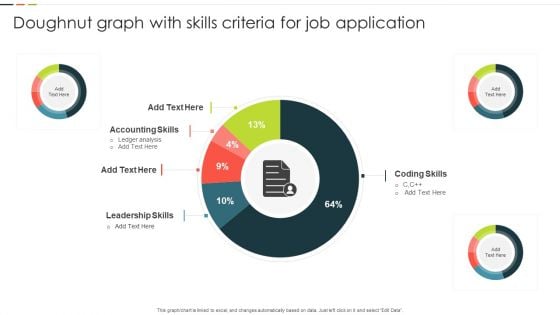
Doughnut Graph With Skills Criteria For Job Application Designs PDF
This graph or chart is linked to excel, and changes automatically based on data. Just left click on it and select Edit Data. Showcasing this set of slides titled Doughnut Graph With Skills Criteria For Job Application Designs PDF. The topics addressed in these templates are Accounting Skills, Leadership Skills, Coding Skills. All the content presented in this PPT design is completely editable. Download it and make adjustments in color, background, font etc. as per your unique business setting.
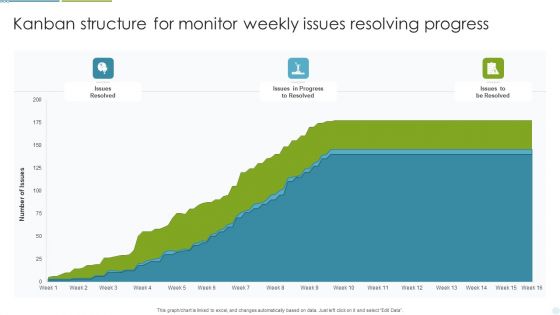
Kanban Structure For Monitor Weekly Issues Resolving Progress Ppt Professional Outline PDF
This graph or chart is linked to excel, and changes automatically based on data. Just left click on it and select Edit Data. Showcasing this set of slides titled Kanban Structure For Monitor Weekly Issues Resolving Progress Ppt Professional Outline PDF. The topics addressed in these templates are Issues Resolved, Progress To Resolved, Issues To Resolved. All the content presented in this PPT design is completely editable. Download it and make adjustments in color, background, font etc. as per your unique business setting.
Kanban Structure For Yearly Project Progress Tracking Ppt File Example Introduction PDF
This graph or chart is linked to excel, and changes automatically based on data. Just left click on it and select Edit Data. Showcasing this set of slides titled Kanban Structure For Yearly Project Progress Tracking Ppt File Example Introduction PDF. The topics addressed in these templates are Number Projects, Backlog Approved, Final Review. All the content presented in this PPT design is completely editable. Download it and make adjustments in color, background, font etc. as per your unique business setting.
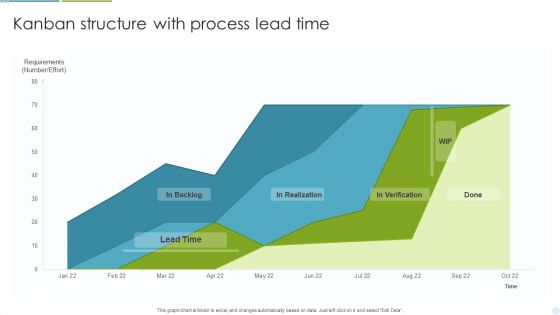
Kanban Structure With Process Lead Time Ppt Gallery Template PDF
This graph or chart is linked to excel, and changes automatically based on data. Just left click on it and select Edit Data. Showcasing this set of slides titled Kanban Structure With Process Lead Time Ppt Gallery Template PDF. The topics addressed in these templates are Lead Time, In Realization, Requirements. All the content presented in this PPT design is completely editable. Download it and make adjustments in color, background, font etc. as per your unique business setting.
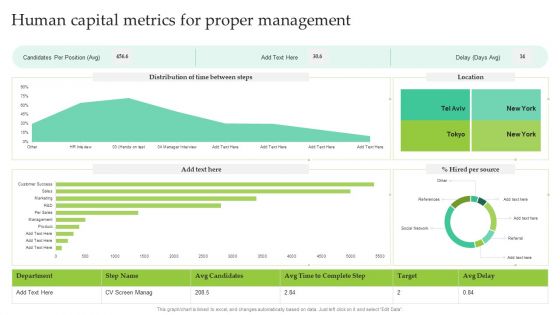
Human Capital Metrics For Proper Management Ppt Show Inspiration PDF
This graph or chart is linked to excel, and changes automatically based on data. Just left click on it and select Edit Data. Showcasing this set of slides titled Human Capital Metrics For Proper Management Ppt Show Inspiration PDF. The topics addressed in these templates are Candidates Per Position, Hired Per Source, Location. All the content presented in this PPT design is completely editable. Download it and make adjustments in color, background, font etc. as per your unique business setting.
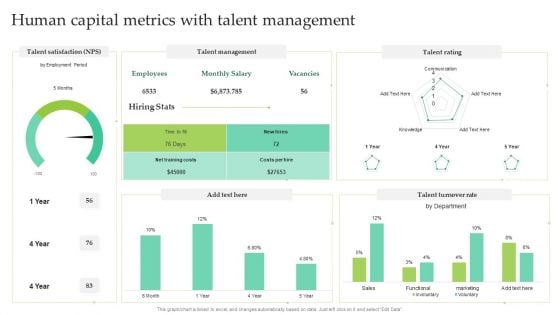
Human Capital Metrics With Talent Management Ppt Layouts Mockup PDF
This graph or chart is linked to excel, and changes automatically based on data. Just left click on it and select Edit Data. Showcasing this set of slides titled Human Capital Metrics With Talent Management Ppt Layouts Mockup PDF. The topics addressed in these templates are Talent Management, Talent Rating, Talent Turnover Rate. All the content presented in this PPT design is completely editable. Download it and make adjustments in color, background, font etc. as per your unique business setting.
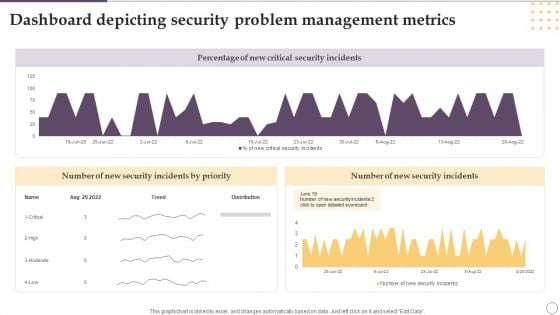
Dashboard Depicting Security Problem Management Metrics Ppt Gallery Designs PDF
This graph or chart is linked to excel, and changes automatically based on data. Just left click on it and select Edit Data. Showcasing this set of slides titled Dashboard Depicting Security Problem Management Metrics Ppt Gallery Designs PDF. The topics addressed in these templates are Percentage, New Critical, Security Incidents. All the content presented in this PPT design is completely editable. Download it and make adjustments in color, background, font etc. as per your unique business setting.
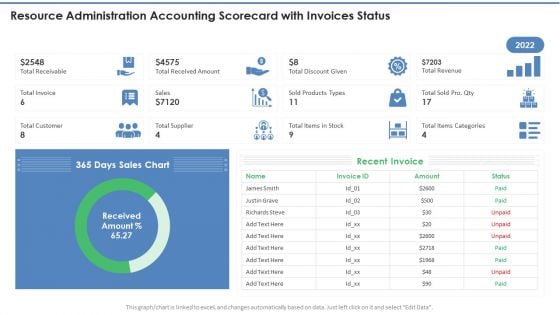
Resource Administration Accounting Scorecard With Invoices Status Topics PDF
This graph or chart is linked to excel, and changes automatically based on data. Just left click on it and select Edit Data. Deliver an awe inspiring pitch with this creative Resource Administration Accounting Scorecard With Invoices Status Topics PDF bundle. Topics like Recent Invoice, Sales Chart, Total Receivable can be discussed with this completely editable template. It is available for immediate download depending on the needs and requirements of the user.

 Home
Home