Data Icon
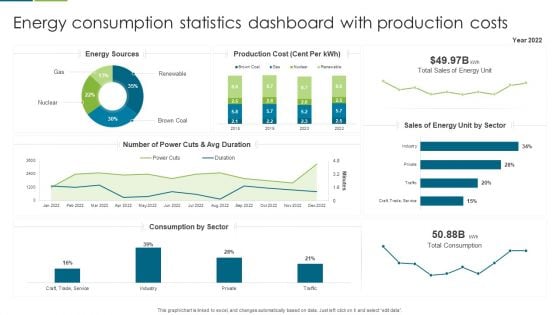
Energy Consumption Statistics Dashboard With Production Costs Slides PDF
This graph or chart is linked to excel, and changes automatically based on data. Just left click on it and select edit data. Showcasing this set of slides titled Energy Consumption Statistics Dashboard With Production Costs Slides PDF. The topics addressed in these templates are Production Cost, Sales Energy, Number Power. All the content presented in this PPT design is completely editable. Download it and make adjustments in color, background, font etc. as per your unique business setting.
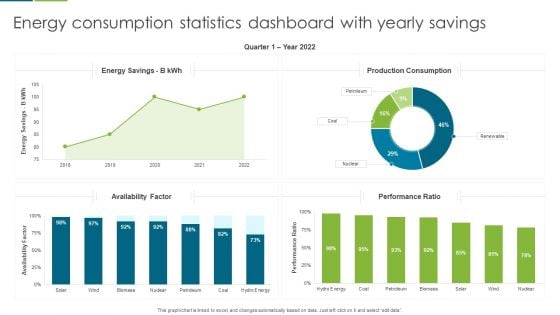
Energy Consumption Statistics Dashboard With Yearly Savings Guidelines PDF
This graph or chart is linked to excel, and changes automatically based on data. Just left click on it and select edit data. Showcasing this set of slides titled Energy Consumption Statistics Dashboard With Yearly Savings Guidelines PDF. The topics addressed in these templates are Production Consumption, Energy Savings, Performance Ratio. All the content presented in this PPT design is completely editable. Download it and make adjustments in color, background, font etc. as per your unique business setting.
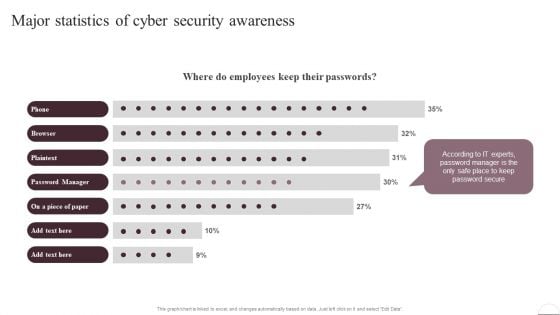
Prevention Of Information Major Statistics Of Cyber Security Awareness Pictures PDF
This graph or chart is linked to excel, and changes automatically based on data. Just left click on it and select Edit Data. There are so many reasons you need a Prevention Of Information Major Statistics Of Cyber Security Awareness Pictures PDF. The first reason is you cant spend time making everything from scratch, Thus, Slidegeeks has made presentation templates for you too. You can easily download these templates from our website easily.
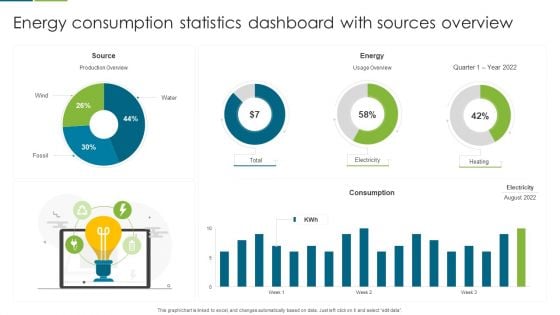
Energy Consumption Statistics Dashboard With Sources Overview Template PDF
This graph or chart is linked to excel, and changes automatically based on data. Just left click on it and select edit data. Pitch your topic with ease and precision using this Energy Consumption Statistics Dashboard With Sources Overview Template PDF. This layout presents information on Source, Energy, Consumption. It is also available for immediate download and adjustment. So, changes can be made in the color, design, graphics or any other component to create a unique layout.

Statistics Highlighting Positive Impact Effective Strategies For Strengthening Food Ppt Presentation
The slide showcases properties of glass packaging material that assist in preserving food quality and temperature in containers. The points are mechanical, thermal, optical properties. Do you know about Slidesgeeks Statistics Highlighting Positive Impact Effective Strategies For Strengthening Food Ppt Presentation These are perfect for delivering any kind od presentation. Using it, create PowerPoint presentations that communicate your ideas and engage audiences. Save time and effort by using our pre-designed presentation templates that are perfect for a wide range of topic. Our vast selection of designs covers a range of styles, from creative to business, and are all highly customizable and easy to edit. Download as a PowerPoint template or use them as Google Slides themes. The slide showcases properties of glass packaging material that assist in preserving food quality and temperature in containers. The points are mechanical, thermal, optical properties.
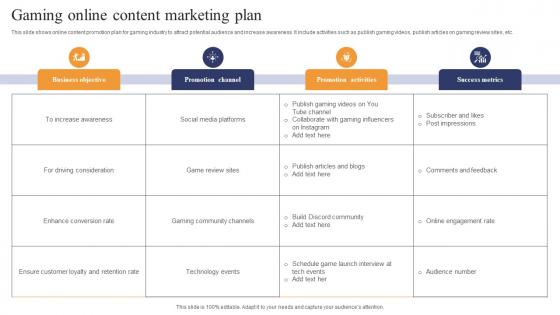
Gaming Online Content Marketing Plan Themes Pdf
This slide shows online content promotion plan for gaming industry to attract potential audience and increase awareness. It include activities such as publish gaming videos, publish articles on gaming review sites, etc Pitch your topic with ease and precision using this Gaming Online Content Marketing Plan Themes Pdf This layout presents information on Business Objective, Promotion Channel, Promotion Activities It is also available for immediate download and adjustment. So, changes can be made in the color, design, graphics or any other component to create a unique layout. This slide shows online content promotion plan for gaming industry to attract potential audience and increase awareness. It include activities such as publish gaming videos, publish articles on gaming review sites, etc
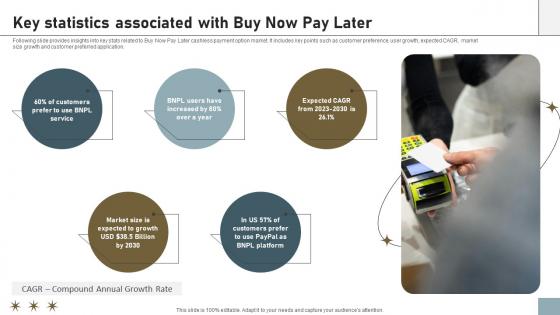
Online Payment Techniques Key Statistics Associated With Buy Now Pay Later
Following slide provides insights into key stats related to Buy Now Pay Later cashless payment option market. It includes key points such as customer preference, user growth, expected CAGR, market size growth and customer preferred application. Slidegeeks is here to make your presentations a breeze with Online Payment Techniques Key Statistics Associated With Buy Now Pay Later With our easy-to-use and customizable templates, you can focus on delivering your ideas rather than worrying about formatting. With a variety of designs to choose from, you are sure to find one that suits your needs. And with animations and unique photos, illustrations, and fonts, you can make your presentation pop. So whether you are giving a sales pitch or presenting to the board, make sure to check out Slidegeeks first Following slide provides insights into key stats related to Buy Now Pay Later cashless payment option market. It includes key points such as customer preference, user growth, expected CAGR, market size growth and customer preferred application.

Four Circles For Information Display Powerpoint Templates
This PowerPoint slide contains graphics of four circles. This professional slide may be used for visual explanation of data. Adjust the above diagram in your business presentations to give professional impact.
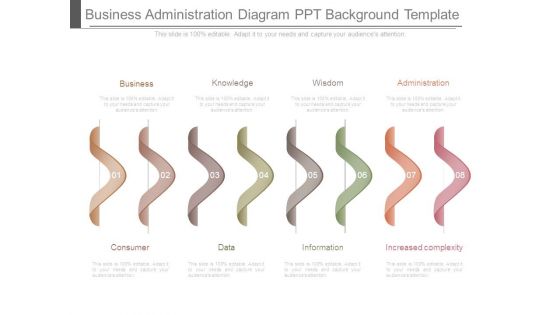
Business Administration Diagram Ppt Background Template
This is a business administration diagram ppt background template. This is a eight stage process. The stages in this process are business, consumer, knowledge, data, wisdom, information, administration, increased complexity.
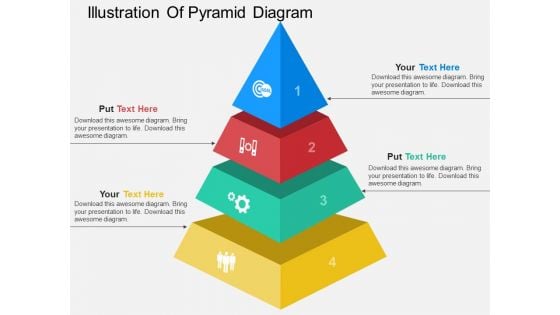
Illustration Of Pyramid Diagram Powerpoint Template
This PowerPoint slide contains illustration of pyramid diagram. This professional slide may be used for visual explanation of data. Adjust the above diagram in your business presentations to give professional impact.
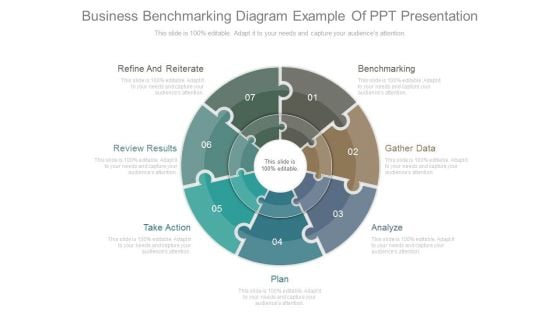
Business Benchmarking Diagram Example Of Ppt Presentation
This is a business benchmarking diagram example of ppt presentation. This is a seven stage process. The stages in this process are refine and reiterate, review results, take action, plan, analyze, gather data, benchmarking.
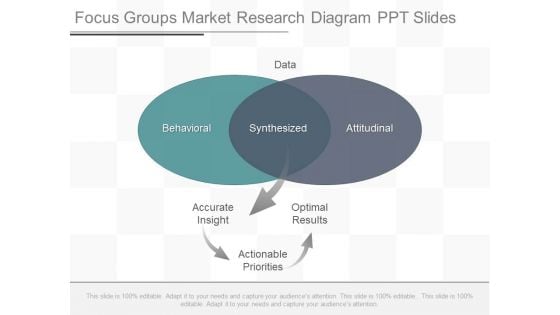
Focus Groups Market Research Diagram Ppt Slides
This is a focus groups market research diagram ppt slides. This is a two stage process. The stages in this process are data, behavioral, synthesized, attitudinal, accurate insight, optimal results, actionable priorities.
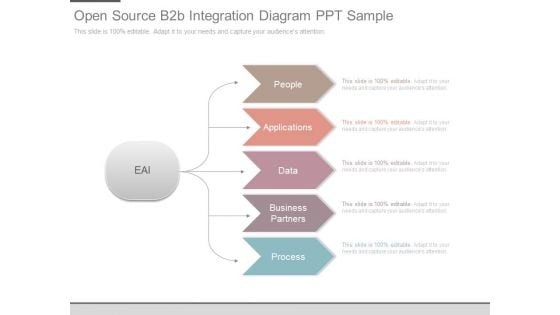
Open Source B2b Integration Diagram Ppt Sample
This is a open source b2b integration diagram ppt sample. This is a five stage process. The stages in this process are eai, people, applications, data, business partners, process.
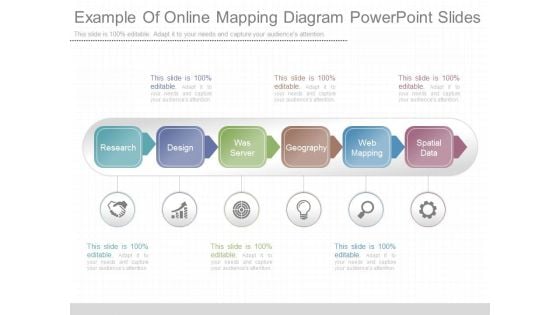
Example Of Online Mapping Diagram Powerpoint Slides
This is a example of online mapping diagram powerpoint slides. This is a six stage process. The stages in this process are research, design, was server, geography, web mapping, spatial data.
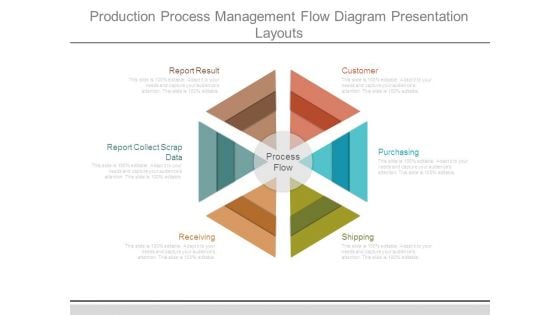
Production Process Management Flow Diagram Presentation Layouts
This is a production process management flow diagram presentation layouts. This is a six stage process. The stages in this process are report result, report collect scrap data, receiving, customer, purchasing, shipping, process flow.

Strategic Promotions Ppt Diagram Powerpoint Topics
This is a strategic promotions ppt diagram powerpoint topics. This is a seven stage process. The stages in this process are brand identity, new market penetration, develop vision, research best practices, long term planning, short term planning, synthesize data.
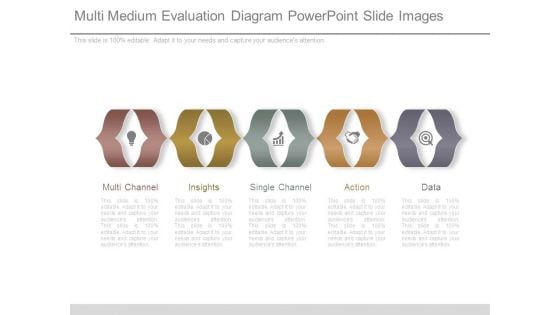
Multi Medium Evaluation Diagram Powerpoint Slide Images
This is a multi medium evaluation diagram powerpoint slide images. This is a five stage process. The stages in this process are multi channel, insights, single channel, action, data.
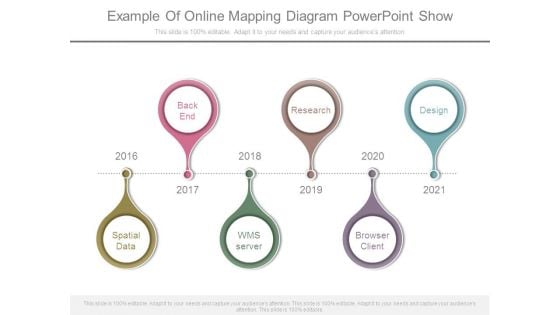
Example Of Online Mapping Diagram Powerpoint Show
This is a example of online mapping diagram powerpoint show. This is a six stage process. The stages in this process are back end, research, design, spatial data, wms server, browser client.
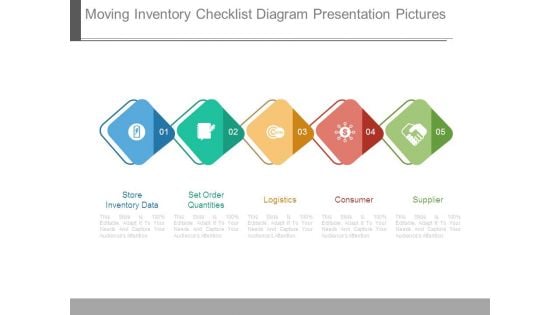
Moving Inventory Checklist Diagram Presentation Pictures
This is a moving inventory checklist diagram presentation pictures. This is a five stage process. The stages in this process are store inventory data, set order quantities, logistics, consumer, supplier.
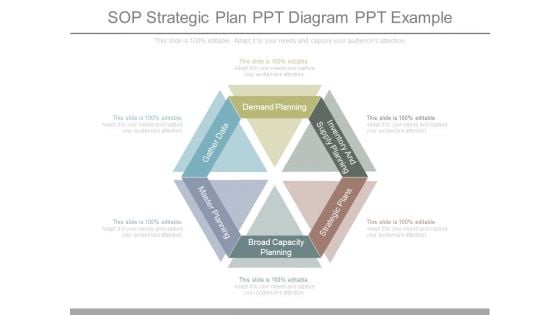
Sop Strategic Plan Ppt Diagram Ppt Example
This is a sop strategic plan ppt diagram ppt example. This is a six stage process. The stages in this process are demand planning, inventory and supply planning, strategic plans, broad capacity planning, master planning, gather data.
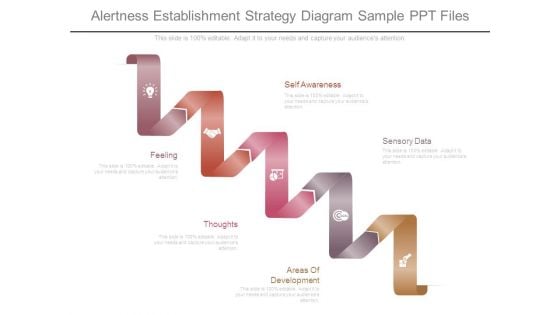
Alertness Establishment Strategy Diagram Sample Ppt Files
This is a alertness establishment strategy diagram sample ppt files. This is a five stage process. The stages in this process are self awareness, sensory data, feeling, thoughts, areas of development.
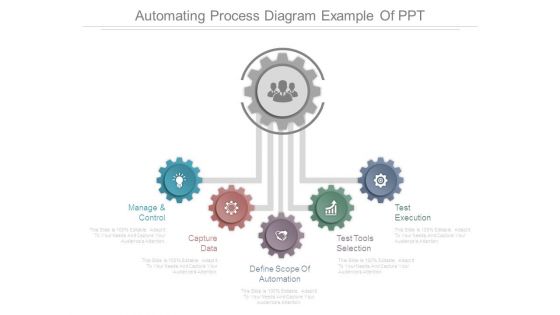
Automating Process Diagram Example Of Ppt
This is a automating process diagram example of ppt. This is a five stage process. The stages in this process are manage and control, capture data, define scope of automation, test tools selection, test execution.
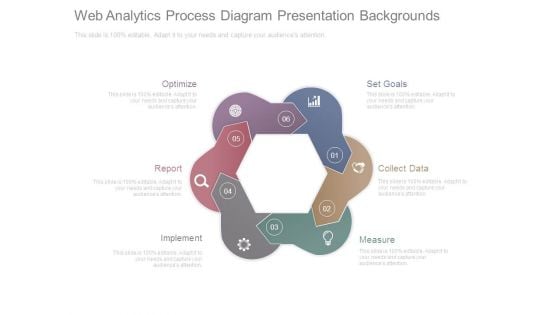
Web Analytics Process Diagram Presentation Backgrounds
This is a web analytics process diagram presentation backgrounds. This is a six stage process. The stages in this process are optimize, report, implement, measure, collect data, set goals.
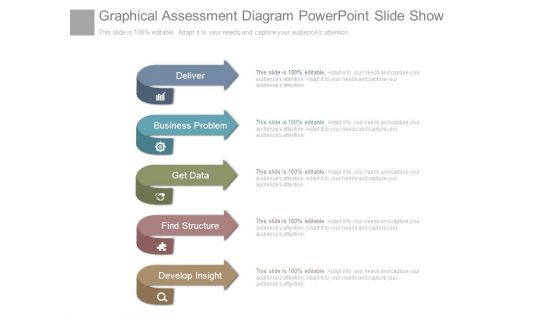
Graphical Assessment Diagram Powerpoint Slide Show
This is a graphical assessment diagram powerpoint slide show. This is a five stage process. The stages in this process are deliver, business problem, get data, find structure, develop insight.
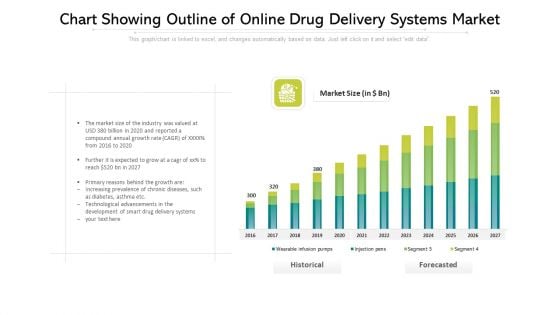
Chart Showing Outline Of Online Drug Delivery Systems Market Ppt PowerPoint Presentation File Clipart PDF
This graph or chart is linked to excel, and changes automatically based on data. Just left click on it and select edit data. Showcasing this set of slides titled chart showing outline of online drug delivery systems market ppt powerpoint presentation file clipart pdf. The topics addressed in these templates are technological, development, growth. All the content presented in this PPT design is completely editable. Download it and make adjustments in color, background, font etc. as per your unique business setting.
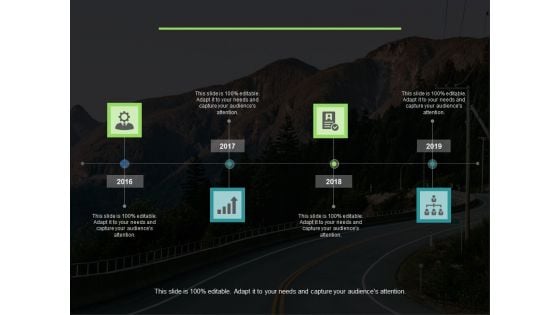
Quarterly Timeline Template Ppt PowerPoint Presentation Ideas Background Images
This is a quarterly timeline template ppt powerpoint presentation ideas background images. This is a four stage process. The stages in this process are icons, years, marketing, strategy, planning.
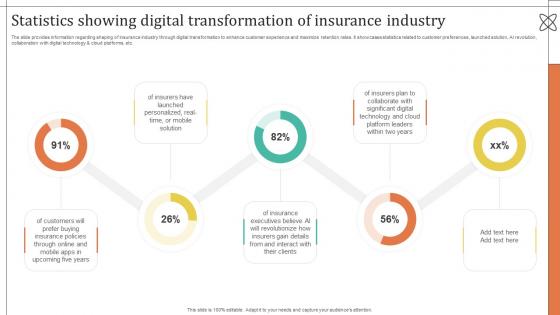
Improving Customer Satisfaction Statistics Showing Digital Transformation Of Insurance
The slide provides information regarding shaping of insurance industry through digital transformation to enhance customer experience and maximize retention rates. It showcases statistics related to customer preferences, launched solution, AI revolution, collaboration with digital technology and cloud platforms, etc. If you are looking for a format to display your unique thoughts, then the professionally designed Improving Customer Satisfaction Statistics Showing Digital Transformation Of Insurance is the one for you. You can use it as a Google Slides template or a PowerPoint template. Incorporate impressive visuals, symbols, images, and other charts. Modify or reorganize the text boxes as you desire. Experiment with shade schemes and font pairings. Alter, share or cooperate with other people on your work. Download Improving Customer Satisfaction Statistics Showing Digital Transformation Of Insurance and find out how to give a successful presentation. Present a perfect display to your team and make your presentation unforgettable. The slide provides information regarding shaping of insurance industry through digital transformation to enhance customer experience and maximize retention rates. It showcases statistics related to customer preferences, launched solution, AI revolution, collaboration with digital technology and cloud platforms, etc.
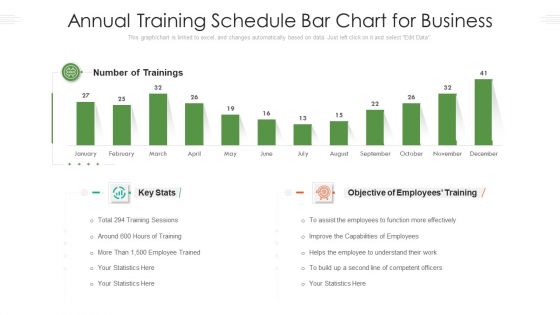
Annual Training Schedule Bar Chart For Business Ppt PowerPoint Presentation File Infographics PDF
This graph chart is linked to excel, and changes automatically based on data. Just left click on it and select Edit Data. Showcasing this set of slides titled annual training schedule bar chart for business ppt powerpoint presentation file infographics pdf. The topics addressed in these templates are trainings, employees, competent officers. All the content presented in this PPT design is completely editable. Download it and make adjustments in color, background, font etc. as per your unique business setting.
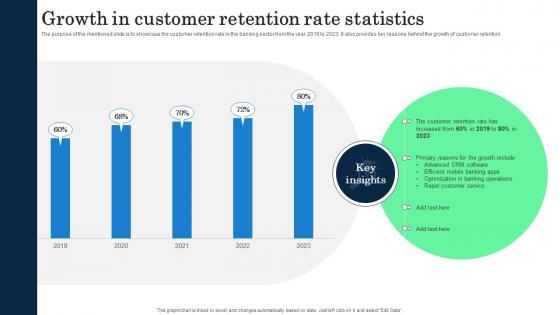
Growth In Customer Retention Rate Statistics Incorporating Banking Operational Growth
The purpose of the mentioned slide is to showcase the customer retention rate in the banking sector from the year 2019 to 2023. it also provides key reasons behind the growth of customer retention. The Growth In Customer Retention Rate Statistics Incorporating Banking Operational Growth is a compilation of the most recent design trends as a series of slides. It is suitable for any subject or industry presentation, containing attractive visuals and photo spots for businesses to clearly express their messages. This template contains a variety of slides for the user to input data, such as structures to contrast two elements, bullet points, and slides for written information. Slidegeeks is prepared to create an impression. The purpose of the mentioned slide is to showcase the customer retention rate in the banking sector from the year 2019 to 2023. it also provides key reasons behind the growth of customer retention
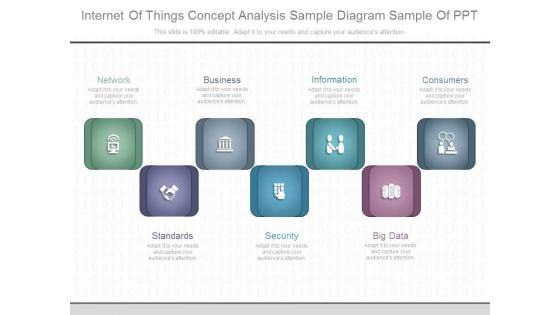
Internet Of Things Concept Analysis Sample Diagram Sample Of Ppt
This is a internet of things concept analysis sample diagram sample of ppt. This is a seven stage process. The stages in this process are network, business, information, consumers, standards, security, big data.

Key Statistics Associated With Effective Strategies To Succeed At Virtual Ppt Sample SA SS V
Following slide highlights key statistics to understand role and adoption of insides sales intelligence technology to improve revenue. Are you searching for a Key Statistics Associated With Effective Strategies To Succeed At Virtual Ppt Sample SA SS V that is uncluttered, straightforward, and original Its easy to edit, and you can change the colors to suit your personal or business branding. For a presentation that expresses how much effort you have put in, this template is ideal With all of its features, including tables, diagrams, statistics, and lists, its perfect for a business plan presentation. Make your ideas more appealing with these professional slides. Download Key Statistics Associated With Effective Strategies To Succeed At Virtual Ppt Sample SA SS V from Slidegeeks today. Following slide highlights key statistics to understand role and adoption of insides sales intelligence technology to improve revenue.
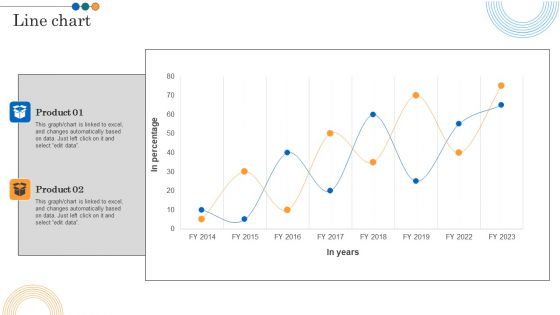
Implementing Marketing Strategies Line Chart Ppt PowerPoint Presentation File Mockup PDF
This graph or chart is linked to excel, and changes automatically based on data. Just left click on it and select edit data. There are so many reasons you need a Implementing Marketing Strategies Line Chart Ppt PowerPoint Presentation File Mockup PDF. The first reason is you can not spend time making everything from scratch, Thus, Slidegeeks has made presentation templates for you too. You can easily download these templates from our website easily.
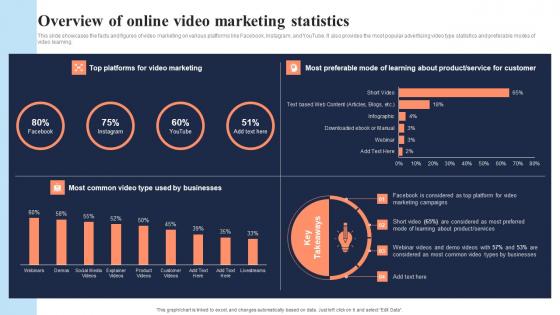
Overview Of Online Video Marketing Statistics In Depth Overview Of Mass Structure Pdf
This slide showcases the facts and figures of video marketing on various platforms like Facebook, Instagram, and YouTube. It also provides the most popular advertising video type statistics and preferable modes of video learning. Welcome to our selection of the Overview Of Online Video Marketing Statistics In Depth Overview Of Mass Structure Pdf These are designed to help you showcase your creativity and bring your sphere to life. Planning and Innovation are essential for any business that is just starting out. This collection contains the designs that you need for your everyday presentations. All of our PowerPoints are 100 percent editable, so you can customize them to suit your needs. This multi-purpose template can be used in various situations. Grab these presentation templates today. This slide showcases the facts and figures of video marketing on various platforms like Facebook, Instagram, and YouTube. It also provides the most popular advertising video type statistics and preferable modes of video learning.
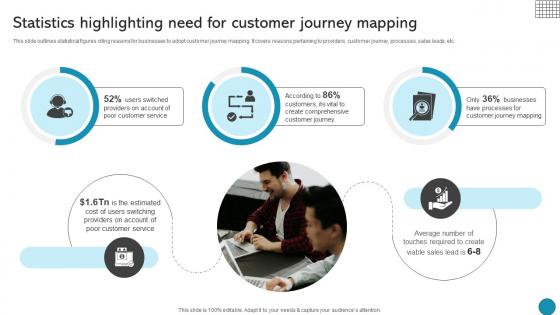
Statistics Highlighting Need For Customer Journey Driving Business Success Integrating Product
This slide outlines statistical figures citing reasons for businesses to adopt customer journey mapping. It covers reasons pertaining to providers, customer journey, processes, sales leads, etc. Make sure to capture your audiences attention in your business displays with our gratis customizable Statistics Highlighting Need For Customer Journey Driving Business Success Integrating Product. These are great for business strategies, office conferences, capital raising or task suggestions. If you desire to acquire more customers for your tech business and ensure they stay satisfied, create your own sales presentation with these plain slides. This slide outlines statistical figures citing reasons for businesses to adopt customer journey mapping. It covers reasons pertaining to providers, customer journey, processes, sales leads, etc.
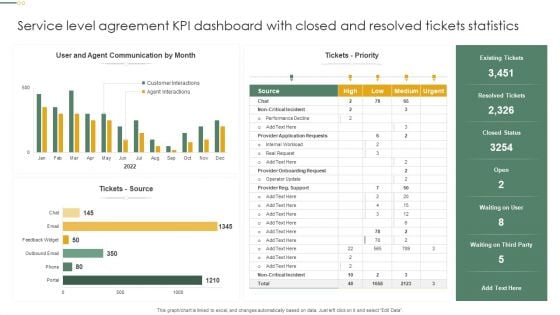
Service Level Agreement KPI Dashboard With Closed And Resolved Tickets Statistics Inspiration PDF
This graph or chart is linked to excel, and changes automatically based on data. Just left click on it and select Edit Data. Showcasing this set of slides titled Service Level Agreement KPI Dashboard With Closed And Resolved Tickets Statistics Inspiration PDF. The topics addressed in these templates are Tickets Priority, Tickets Source, Resolved Tickets. All the content presented in this PPT design is completely editable. Download it and make adjustments in color, background, font etc. as per your unique business setting.
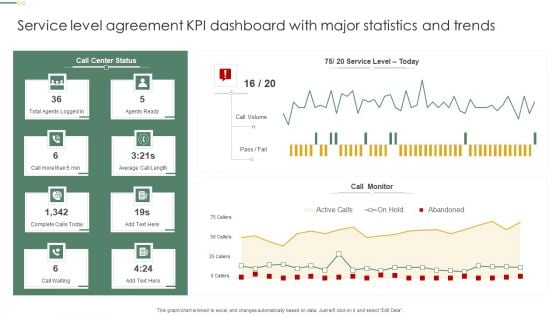
Service Level Agreement KPI Dashboard With Major Statistics And Trends Pictures PDF
This graph or chart is linked to excel, and changes automatically based on data. Just left click on it and select Edit Data. Pitch your topic with ease and precision using this Service Level Agreement KPI Dashboard With Major Statistics And Trends Pictures PDF. This layout presents information on Call Monitor, Call Volume, Agents Ready. It is also available for immediate download and adjustment. So, changes can be made in the color, design, graphics or any other component to create a unique layout.
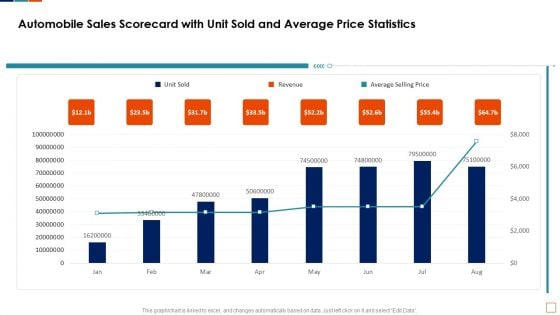
Automobile Sales Scorecard With Unit Sold And Average Price Statistics Formats PDF
This graph or chart is linked to excel, and changes automatically based on data. Just left click on it and select Edit Data. Deliver an awe inspiring pitch with this creative Automobile Sales Scorecard With Unit Sold And Average Price Statistics Formats PDF bundle. Topics like Automobile Sales Scorecard, Unit Sold Revenue, Average Price Statistics can be discussed with this completely editable template. It is available for immediate download depending on the needs and requirements of the user.

Empowering The Future Statistical Graph Showcasing Smart Meter Market Growth IoT SS V
This slide showcases information about the global market size of smart meters. It includes key reasons such as government initiatives to promote energy conversation, smart city initiatives, accurate billing process, etc. The Empowering The Future Statistical Graph Showcasing Smart Meter Market Growth IoT SS V is a compilation of the most recent design trends as a series of slides. It is suitable for any subject or industry presentation, containing attractive visuals and photo spots for businesses to clearly express their messages. This template contains a variety of slides for the user to input data, such as structures to contrast two elements, bullet points, and slides for written information. Slidegeeks is prepared to create an impression. This slide showcases information about the global market size of smart meters. It includes key reasons such as government initiatives to promote energy conversation, smart city initiatives, accurate billing process, etc.
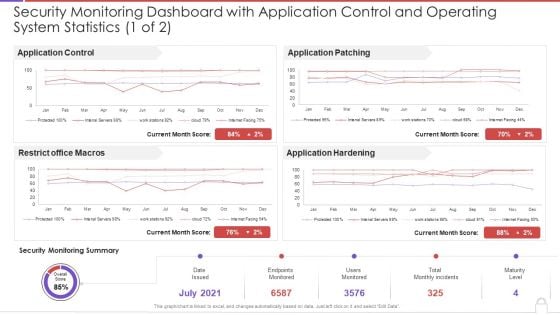
Security Monitoring Dashboard With Application Control And Operating System Statistics Template PDF
This graph or chart is linked to excel, and changes automatically based on data. Just left click on it and select Edit Data. Deliver and pitch your topic in the best possible manner with this security monitoring dashboard with application control and operating system statistics template pdf. Use them to share invaluable insights on application control, restrict office macros, application patching, application hardening and impress your audience. This template can be altered and modified as per your expectations. So, grab it now.
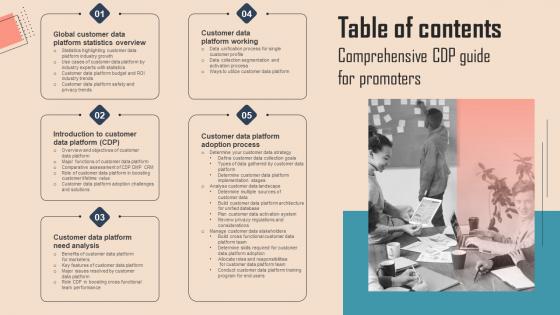
Table Of Contents Comprehensive CDP Guide For Promoters Themes Pdf
Here you can discover an assortment of the finest PowerPoint and Google Slides templates. With these templates, you can create presentations for a variety of purposes while simultaneously providing your audience with an eye-catching visual experience. Download Table Of Contents Comprehensive CDP Guide For Promoters Themes Pdf to deliver an impeccable presentation. These templates will make your job of preparing presentations much quicker, yet still, maintain a high level of quality. Slidegeeks has experienced researchers who prepare these templates and write high-quality content for you. Later on, you can personalize the content by editing the Table Of Contents Comprehensive CDP Guide For Promoters Themes Pdf. Our Table Of Contents Comprehensive CDP Guide For Promoters Themes Pdf are topically designed to provide an attractive backdrop to any subject. Use them to look like a presentation pro.
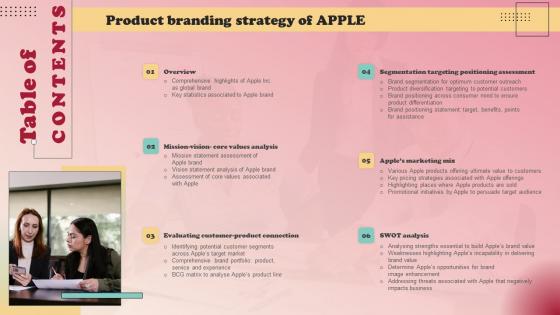
Table Of Contents Product Branding Strategy Of Apple Themes Pdf
From laying roadmaps to briefing everything in detail, our templates are perfect for you. You can set the stage with your presentation slides. All you have to do is download these easy-to-edit and customizable templates. Table Of Contents Product Branding Strategy Of Apple Themes Pdf will help you deliver an outstanding performance that everyone would remember and praise you for. Do download this presentation today. Our Table Of Contents Product Branding Strategy Of Apple Themes Pdf are topically designed to provide an attractive backdrop to any subject. Use them to look like a presentation pro.
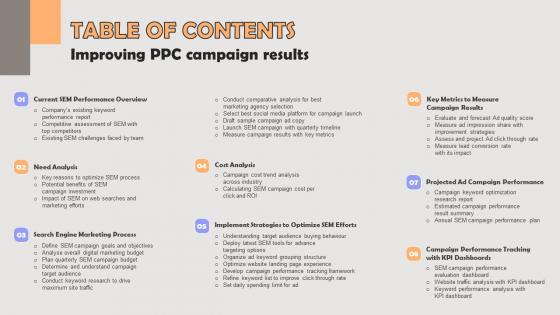
Table Of Contents Improving PPC Campaign Results Themes Pdf
Slidegeeks is one of the best resources for PowerPoint templates. You can download easily and regulate Table Of Contents Improving PPC Campaign Results Themes Pdf for your personal presentations from our wonderful collection. A few clicks is all it takes to discover and get the most relevant and appropriate templates. Use our Templates to add a unique zing and appeal to your presentation and meetings. All the slides are easy to edit and you can use them even for advertisement purposes. Our Table Of Contents Improving PPC Campaign Results Themes Pdf are topically designed to provide an attractive backdrop to any subject. Use them to look like a presentation pro.
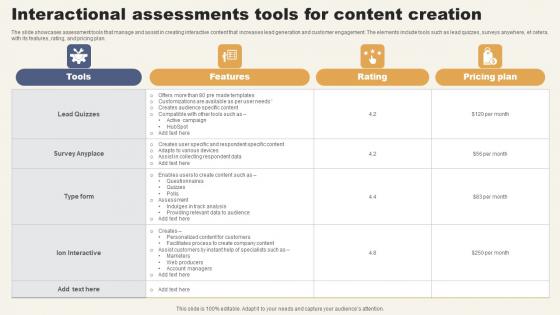
Interactional Assessments Tools For Content Creation Themes Pdf
The slide showcases assessment tools that manage and assist in creating interactive content that increases lead generation and customer engagement. The elements include tools such as lead quizzes, surveys anywhere, et cetera. with its features, rating, and pricing plan. Showcasing this set of slides titled Interactional Assessments Tools For Content Creation Themes Pdf The topics addressed in these templates are Lead Quizzes, Survey Anyplace, Ion Interactive All the content presented in this PPT design is completely editable. Download it and make adjustments in color, background, font etc. as per your unique business setting. The slide showcases assessment tools that manage and assist in creating interactive content that increases lead generation and customer engagement. The elements include tools such as lead quizzes, surveys anywhere, et cetera. with its features, rating, and pricing plan.

Hyper Automation Solutions Table Of Contents Themes PDF
Find a pre-designed and impeccable Hyper Automation Solutions Table Of Contents Themes PDF. The templates can ace your presentation without additional effort. You can download these easy-to-edit presentation templates to make your presentation stand out from others. So, what are you waiting for Download the template from Slidegeeks today and give a unique touch to your presentation. Find a pre-designed and impeccable Hyper Automation Solutions Table Of Contents Themes PDF. The templates can ace your presentation without additional effort. You can download these easy-to-edit presentation templates to make your presentation stand out from others. So, what are you waiting for Download the template from Slidegeeks today and give a unique touch to your presentation.
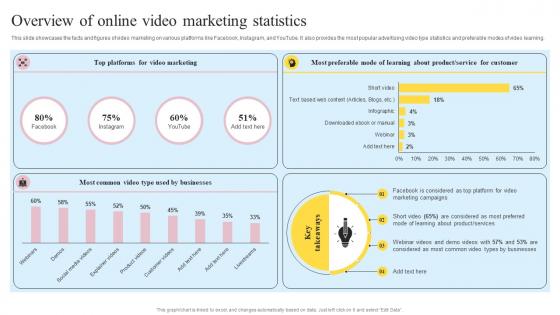
Overview Of Online Video Marketing Statistics Definitive Guide On Mass Advertising Guidelines Pdf
This slide showcases the facts and figures of video marketing on various platforms like Facebook, Instagram, and YouTube. It also provides the most popular advertising video type statistics and preferable modes of video learning. Explore a selection of the finest Overview Of Online Video Marketing Statistics Definitive Guide On Mass Advertising Guidelines Pdf here. With a plethora of professionally designed and pre-made slide templates, you can quickly and easily find the right one for your upcoming presentation. You can use our Overview Of Online Video Marketing Statistics Definitive Guide On Mass Advertising Guidelines Pdf to effectively convey your message to a wider audience. Slidegeeks has done a lot of research before preparing these presentation templates. The content can be personalized and the slides are highly editable. Grab templates today from Slidegeeks. This slide showcases the facts and figures of video marketing on various platforms like Facebook, Instagram, and YouTube. It also provides the most popular advertising video type statistics and preferable modes of video learning.
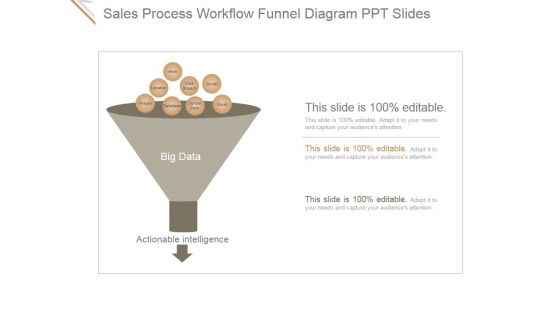
Sales Process Workflow Funnel Diagram Ppt PowerPoint Presentation Microsoft
This is a sales process workflow funnel diagram ppt powerpoint presentation microsoft. This is a three stage process. The stages in this process are html, click stream, social, email, sensor data, database, location, images.
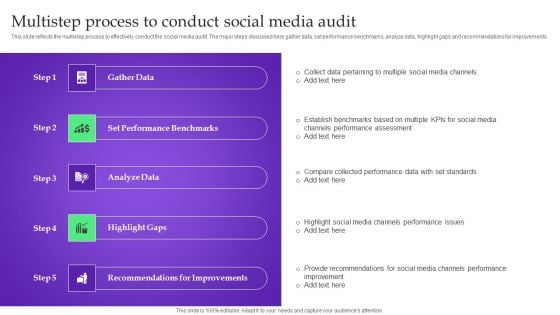
Analysis Plan For E Commerce Promotion Tactics Multistep Process To Conduct Social Media Audit Themes PDF
This slide reflects the multistep process to effectively conduct the social media audit. The major steps discussed here gather data, set performance benchmarks, analyze data, highlight gaps and recommendations for improvements. This slide reflects the multistep process to effectively conduct the social media audit. The major steps discussed here gather data, set performance benchmarks, analyze data, highlight gaps and recommendations for improvements. Want to ace your presentation in front of a live audience Our Analysis Plan For E Commerce Promotion Tactics Multistep Process To Conduct Social Media Audit Themes PDF can help you do that by engaging all the users towards you. Slidegeeks experts have put their efforts and expertise into creating these impeccable powerpoint presentations so that you can communicate your ideas clearly. Moreover, all the templates are customizable, and easy to edit and downloadable. Use these for both personal and commercial use.
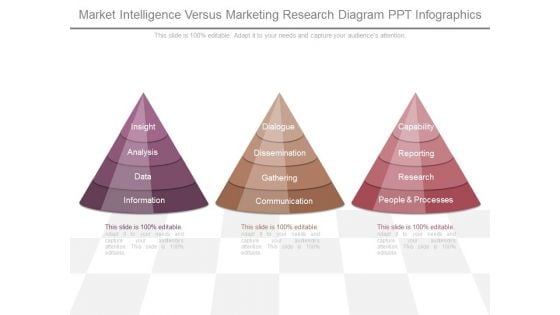
Market Intelligence Versus Marketing Research Diagram Ppt Infographics
This is a market intelligence versus marketing research diagram ppt infographics. This is a three stage process. The stages in this process are insight, analysis, data, information, dialogue, dissemination, gathering, communication, capability, reporting, research, people and processes.
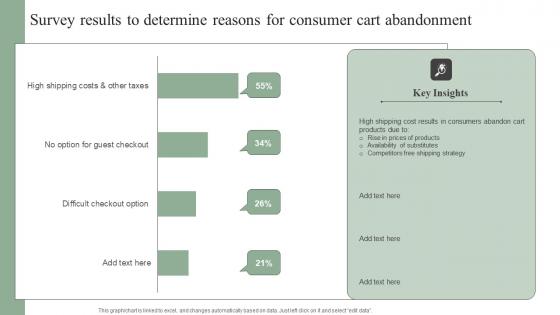
Survey Results To Determine Reasons For Consumer Efficient Marketing Tactics Information Pdf
This graph chart is linked to excel, and changes automatically based on data. Just left click on it and select edit data. Slidegeeks is one of the best resources for PowerPoint templates. You can download easily and regulate Survey Results To Determine Reasons For Consumer Efficient Marketing Tactics Information Pdf for your personal presentations from our wonderful collection. A few clicks is all it takes to discover and get the most relevant and appropriate templates. Use our Templates to add a unique zing and appeal to your presentation and meetings. All the slides are easy to edit and you can use them even for advertisement purposes. This graph chart is linked to excel, and changes automatically based on data. Just left click on it and select edit data.

Set Of Seven Vertical Steps Powerpoint Templates
This PowerPoint slide contains graphics of seven vertical steps. This professional slide may be used for visual explanation of data. Adjust the above diagram in your business presentations to give professional impact.
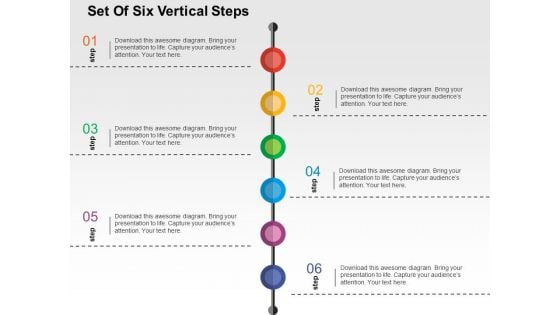
Set Of Six Vertical Steps Powerpoint Templates
This PowerPoint slide contains graphics of six vertical steps. This professional slide may be used for visual explanation of data. Adjust the above diagram in your business presentations to give professional impact.
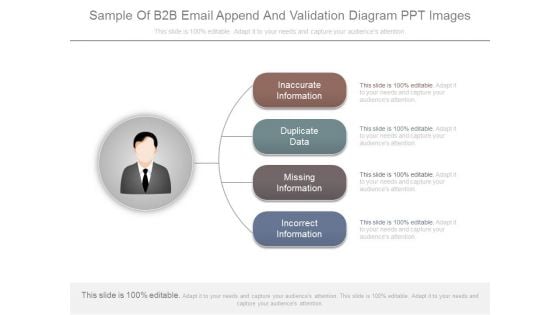
Sample Of B2b Email Append And Validation Diagram Ppt Images
This is a sample of b2b email append and validation diagram ppt images. This is a four stage process. The stages in this process are inaccurate information, duplicate data, missing information, incorrect information.
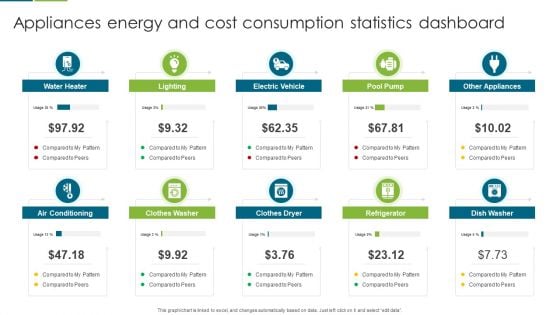
Appliances Energy And Cost Consumption Statistics Dashboard Download PDF
This graph or chart is linked to excel, and changes automatically based on data. Just left click on it and select edit data. Presenting Appliances Energy And Cost Consumption Statistics Dashboard Download PDF to dispense important information. This template comprises ten stages. It also presents valuable insights into the topics including Water Heater, Electric Vehicle, Pool Pump. This is a completely customizable PowerPoint theme that can be put to use immediately. So, download it and address the topic impactfully.
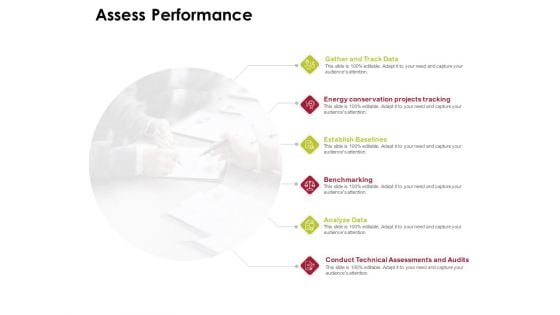
Power Management System And Technology Assess Performance Diagrams PDF
Presenting this set of slides with name power management system and technology assess performance diagrams pdf. This is a six stage process. The stages in this process are gather and track data, energy conservation projects tracking, establish baselines, benchmarking, analyze data, conduct technical assessments and audits. This is a completely editable PowerPoint presentation and is available for immediate download. Download now and impress your audience.
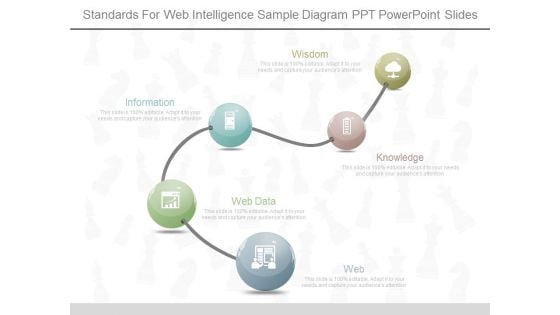
Standards For Web Intelligence Sample Diagram Ppt Powerpoint Slides
This is a standards for web intelligence sample diagram ppt powerpoint slides. This is a five stage process. The stages in this process are web, web data, information, knowledge, wisdom.
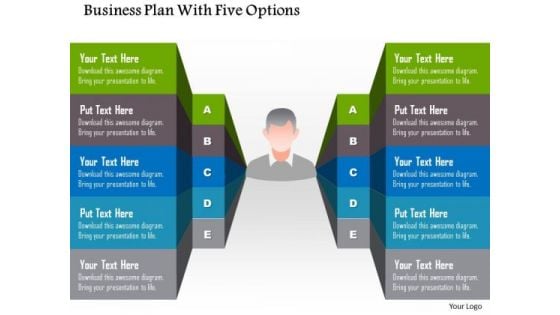
Business Diagram Business Plan With Five Options Presentation Template
This business slide helps to displays business plan with five options. This diagram can help by summarizing the key features of the data. Use this editable diagram for your business and management related presentations.
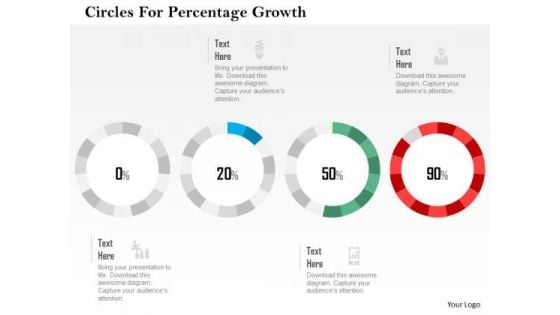
Business Diagram Circles For Percentage Growth Presentation Template
This business slide has been designed with graphics of circles. You may download this diagram to display percentage growth data. This template is innovatively designed to highlight your worthy views
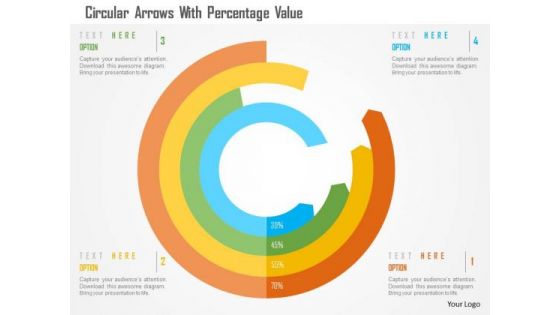
Business Diagram Circular Arrows With Percentage Value Presentation Template
This business slide has been designed with circular arrows. You may download this diagram to display percentage growth data. This template is innovatively designed to highlight your worthy views

B2b Omni Channel Marketing Strategy Diagram Powerpoint Shapes
This is a b2b omni channel marketing strategy diagram powerpoint shapes. This is a six stage process. The stages in this process are crm, big data, mobile, social media, online, physical store.

Omni Channel Marketing For Online Retailing Diagram Ppt Slides
This is a omni channel marketing for online retailing diagram ppt slides. This is a five stage process. The stages in this process are social media, online, physical store, crm, big data.

 Home
Home