Data Visualization
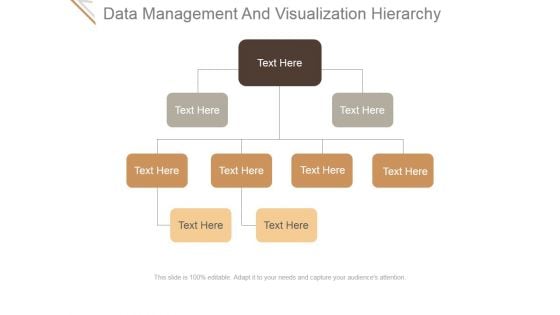
Data Management And Visualization Hierarchy Ppt PowerPoint Presentation Inspiration
This is a data management and visualization hierarchy ppt powerpoint presentation inspiration. This is a four stage process. The stages in this process are business, marketing, hierarchy, visualization, data management.
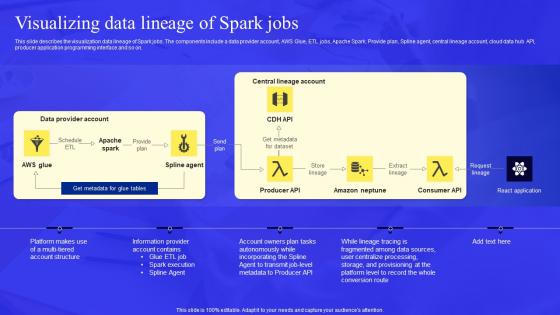
Business Process Data Lineage Visualizing Data Lineage Of Spark Jobs Ideas Pdf
This slide describes the visualization data lineage of Spark jobs. The components include a data provider account, AWS Glue, ETL jobs, Apache Spark, Provide plan, Spline agent, central lineage account, cloud data hub API, producer application programming interface and so on. Coming up with a presentation necessitates that the majority of the effort goes into the content and the message you intend to convey. The visuals of a PowerPoint presentation can only be effective if it supplements and supports the story that is being told. Keeping this in mind our experts created Business Process Data Lineage Visualizing Data Lineage Of Spark Jobs Ideas Pdf to reduce the time that goes into designing the presentation. This way, you can concentrate on the message while our designers take care of providing you with the right template for the situation. This slide describes the visualization data lineage of Spark jobs. The components include a data provider account, AWS Glue, ETL jobs, Apache Spark, Provide plan, Spline agent, central lineage account, cloud data hub API, producer application programming interface and so on.
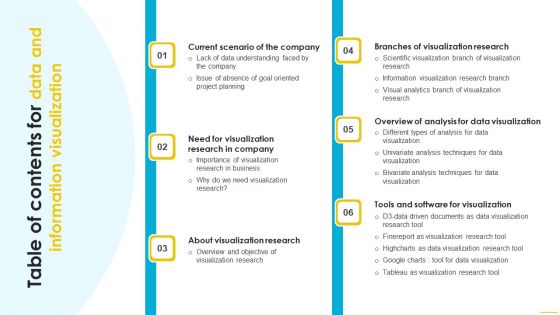
Table Of Contents For Data And Information Visualization Background PDF
Explore a selection of the finest Table Of Contents For Data And Information Visualization Background PDF here. With a plethora of professionally designed and pre made slide templates, you can quickly and easily find the right one for your upcoming presentation. You can use our Table Of Contents For Data And Information Visualization Background PDF to effectively convey your message to a wider audience. Slidegeeks has done a lot of research before preparing these presentation templates. The content can be personalized and the slides are highly editable. Grab templates today from Slidegeeks.
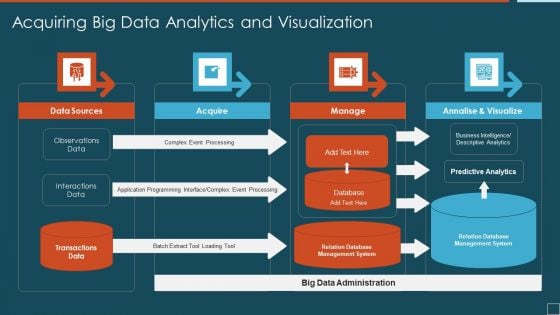
Acquiring Big Data Analytics And Visualization Ideas PDF
Presenting acquiring big data analytics and visualization ideas pdf to dispense important information. This template comprises four stages. It also presents valuable insights into the topics including data sources, acquire, manage. This is a completely customizable PowerPoint theme that can be put to use immediately. So, download it and address the topic impactfully.
Icons Slides For Data And Information Visualization Pictures PDF
Introducing our well designed Icons Slides For Data And Information Visualization Pictures PDF set of slides. The slide displays editable icons to enhance your visual presentation. The icons can be edited easily. So customize according to your business to achieve a creative edge. Download and share it with your audience.
Agenda For Data And Information Visualization Icons PDF
Find a pre designed and impeccable Agenda For Data And Information Visualization Icons PDF. The templates can ace your presentation without additional effort. You can download these easy to edit presentation templates to make your presentation stand out from others. So, what are you waiting for Download the template from Slidegeeks today and give a unique touch to your presentation.

Data And Information Visualization Ppt PowerPoint Presentation Complete With Slides
This presentation slide from our repository helps you draw or design a business idea that address the audiences pain points and simplifies their experience. This Data And Information Visualization Ppt PowerPoint Presentation Complete With Slides provides a comprehensive yet easy to comprehend document to draw attention to your value proposition. Help audience navigate your business with this forty seven slide complete deck. Draw an actionable customer service flow chart to win and retain your customers back. The presentation template is also equipped to do this with its 100 percent editable and customizable capability. Download now.
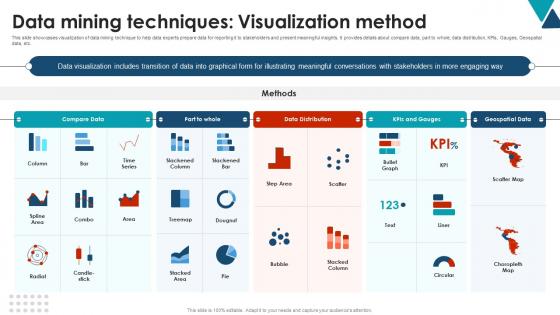
Data Mining Techniques Visualization Method Using Data Mining Tools To Optimize Processes AI SS V
This slide showcases visualization of data mining technique to help data experts prepare data for reporting it to stakeholders and present meaningful insights. It provides details about compare data, part to whole, data distribution, KPIs, Gauges, Geospatial data, etc. Here you can discover an assortment of the finest PowerPoint and Google Slides templates. With these templates, you can create presentations for a variety of purposes while simultaneously providing your audience with an eye-catching visual experience. Download Data Mining Techniques Visualization Method Using Data Mining Tools To Optimize Processes AI SS V to deliver an impeccable presentation. These templates will make your job of preparing presentations much quicker, yet still, maintain a high level of quality. Slidegeeks has experienced researchers who prepare these templates and write high-quality content for you. Later on, you can personalize the content by editing the Data Mining Techniques Visualization Method Using Data Mining Tools To Optimize Processes AI SS V. This slide showcases visualization of data mining technique to help data experts prepare data for reporting it to stakeholders and present meaningful insights. It provides details about compare data, part to whole, data distribution, KPIs, Gauges, Geospatial data, etc.

Departments Of Visualization Research Data Driven Project Planning After Visualization Rules PDF
This slide depicts the impact of visualization research implementation, which results in data-driven project planning, due to which there is a 23 times increase in happy customers.This is a Departments Of Visualization Research Data Driven Project Planning After Visualization Rules PDF template with various stages. Focus and dispense information on three stages using this creative set, that comes with editable features. It contains large content boxes to add your information on topics like Visualization Research, Strategy Of The Company, Customers Are Regained You can also showcase facts, figures, and other relevant content using this PPT layout. Grab it now.
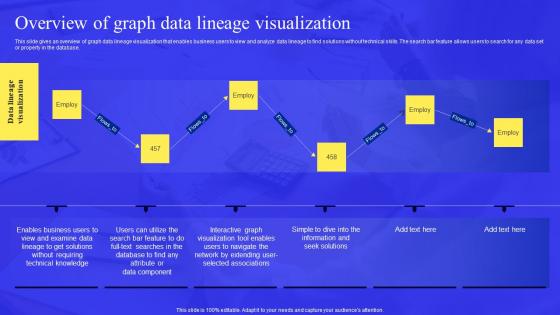
Business Process Data Lineage Overview Of Graph Data Lineage Visualization Microsoft Pdf
This slide gives an overview of graph data lineage visualization that enables business users to view and analyze data lineage to find solutions without technical skills. The search bar feature allows users to search for any data set or property in the database. There are so many reasons you need a Business Process Data Lineage Overview Of Graph Data Lineage Visualization Microsoft Pdf. The first reason is you can not spend time making everything from scratch, Thus, Slidegeeks has made presentation templates for you too. You can easily download these templates from our website easily. This slide gives an overview of graph data lineage visualization that enables business users to view and analyze data lineage to find solutions without technical skills. The search bar feature allows users to search for any data set or property in the database.
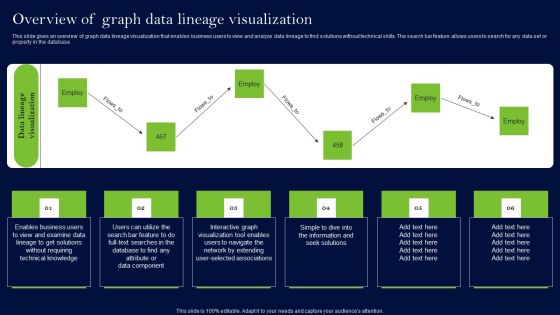
Data Lineage Methods Overview Of Graph Data Lineage Visualization Ideas PDF
This slide gives an overview of graph data lineage visualization that enables business users to view and analyze data lineage to find solutions without technical skills. The search bar feature allows users to search for any data set or property in the database. The best PPT templates are a great way to save time, energy, and resources. Slidegeeks have 100 percent editable powerpoint slides making them incredibly versatile. With these quality presentation templates, you can create a captivating and memorable presentation by combining visually appealing slides and effectively communicating your message. Download Data Lineage Methods Overview Of Graph Data Lineage Visualization Ideas PDF from Slidegeeks and deliver a wonderful presentation.
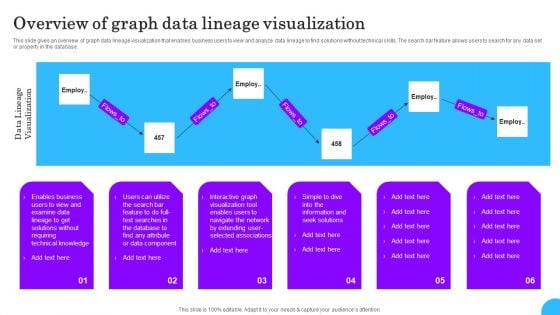
Comprehensive Analysis Of Different Data Lineage Classification Overview Graph Data Lineage Visualization Diagrams PDF
This slide gives an overview of graph data lineage visualization that enables business users to view and analyze data lineage to find solutions without technical skills. The search bar feature allows users to search for any data set or property in the database. Create an editable Comprehensive Analysis Of Different Data Lineage Classification Overview Graph Data Lineage Visualization Diagrams PDF that communicates your idea and engages your audience. Whether you are presenting a business or an educational presentation, pre designed presentation templates help save time. Comprehensive Analysis Of Different Data Lineage Classification Overview Graph Data Lineage Visualization Diagrams PDF is highly customizable and very easy to edit, covering many different styles from creative to business presentations. Slidegeeks has creative team members who have crafted amazing templates. So, go and get them without any delay.

Data Lineage Implementation Overview Of Graph Data Lineage Visualization Demonstration PDF
This slide gives an overview of graph data lineage visualization that enables business users to view and analyze data lineage to find solutions without technical skills. The search bar feature allows users to search for any data set or property in the database. There are so many reasons you need a Data Lineage Implementation Overview Of Graph Data Lineage Visualization Demonstration PDF. The first reason is you cannot spend time making everything from scratch, Thus, Slidegeeks has made presentation templates for you too. You can easily download these templates from our website easily.

Data And Information Visualization Visual Analytics Branch Of Visualization Research Designs PDF
This slide shows visual analytics, the last branch of visualization research, which emerged from the advancements in the other two branches and mainly focused on analytical reasoning. Make sure to capture your audiences attention in your business displays with our gratis customizable Data And Information Visualization Visual Analytics Branch Of Visualization Research Designs PDF. These are great for business strategies, office conferences, capital raising or task suggestions. If you desire to acquire more customers for your tech business and ensure they stay satisfied, create your own sales presentation with these plain slides.
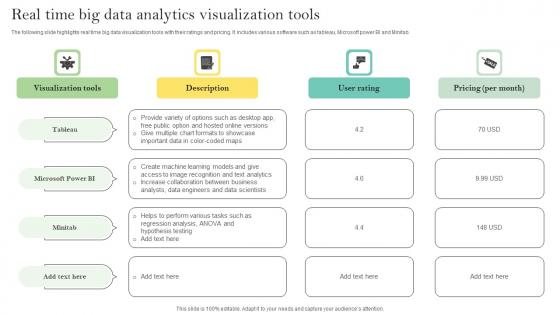
Real Time Big Data Analytics Visualization Tools Ppt Portfolio Example Pdf
The following slide highlights real time big data visualization tools with their ratings and pricing. It includes various software such as tableau, Microsoft power BI and Minitab. Pitch your topic with ease and precision using this Real Time Big Data Analytics Visualization Tools Ppt Portfolio Example Pdf. This layout presents information on Visualization Tools, User Rating, Pricing Per Month. It is also available for immediate download and adjustment. So, changes can be made in the color, design, graphics or any other component to create a unique layout. The following slide highlights real time big data visualization tools with their ratings and pricing. It includes various software such as tableau, Microsoft power BI and Minitab.
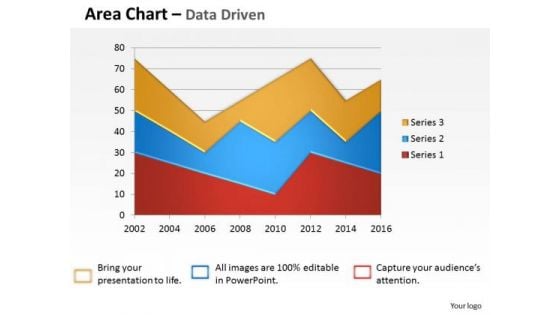
Data Analysis Template Driven Visualization Area Chart PowerPoint Slides Templates
Draw On The Energy Of Our data analysis template driven visualization area chart powerpoint slides Templates . Your Thoughts Will Perk Up.

Data Lineage Methods Visualizing Data Lineage Of Spark Jobs Guidelines PDF
This slide describes the visualization data lineage of Spark jobs. The components include a data provider account, AWS Glue, ETL jobs, Apache Spark, Provide plan, Spline agent, central lineage account, cloud data hub API, producer application programming interface and so on. There are so many reasons you need a Data Lineage Methods Visualizing Data Lineage Of Spark Jobs Guidelines PDF. The first reason is you can not spend time making everything from scratch, Thus, Slidegeeks has made presentation templates for you too. You can easily download these templates from our website easily.
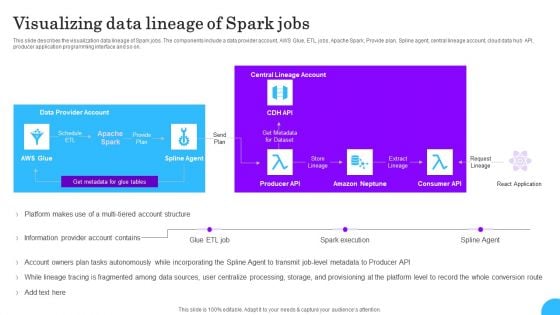
Comprehensive Analysis Of Different Data Lineage Classification Visualizing Data Lineage Of Spark Jobs Slides PDF
This slide describes the visualization data lineage of Spark jobs. The components include a data provider account, AWS Glue, ETL jobs, Apache Spark, Provide plan, Spline agent, central lineage account, cloud data hub API, producer application programming interface and so on. Coming up with a presentation necessitates that the majority of the effort goes into the content and the message you intend to convey. The visuals of a PowerPoint presentation can only be effective if it supplements and supports the story that is being told. Keeping this in mind our experts created Comprehensive Analysis Of Different Data Lineage Classification Visualizing Data Lineage Of Spark Jobs Slides PDF to reduce the time that goes into designing the presentation. This way, you can concentrate on the message while our designers take care of providing you with the right template for the situation.
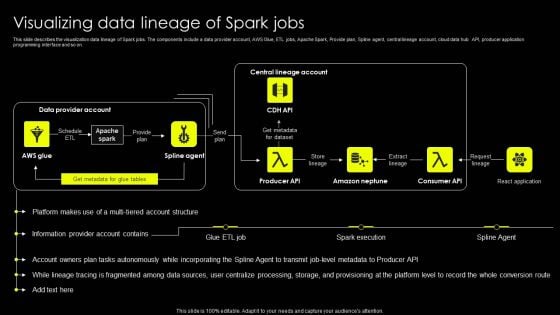
Data Lineage Implementation Visualizing Data Lineage Of Spark Jobs Portrait PDF
This slide describes the visualization data lineage of Spark jobs. The components include a data provider account, AWS Glue, ETL jobs, Apache Spark, Provide plan, Spline agent, central lineage account, cloud data hub API, producer application programming interface and so on. Coming up with a presentation necessitates that the majority of the effort goes into the content and the message you intend to convey. The visuals of a PowerPoint presentation can only be effective if it supplements and supports the story that is being told. Keeping this in mind our experts created Data Lineage Implementation Visualizing Data Lineage Of Spark Jobs Portrait PDF to reduce the time that goes into designing the presentation. This way, you can concentrate on the message while our designers take care of providing you with the right template for the situation.
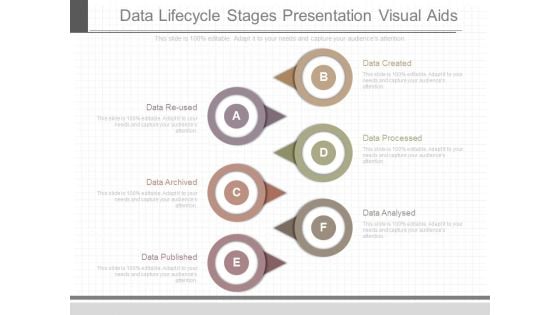
Data Lifecycle Stages Presentation Visual Aids
This is a data lifecycle stages presentation visual aids. This is a six stage process. The stages in this process are data reused, data archived, data published, data analysed, data processed, data created.
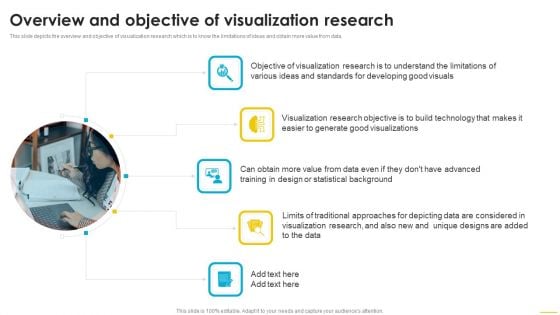
Data And Information Visualization Overview And Objective Of Visualization Research Microsoft PDF
This slide depicts the overview and objective of visualization research which is to know the limitations of ideas and obtain more value from data. Create an editable Data And Information Visualization Overview And Objective Of Visualization Research Microsoft PDF that communicates your idea and engages your audience. Whether you are presenting a business or an educational presentation, pre designed presentation templates help save time. Data And Information Visualization Overview And Objective Of Visualization Research Microsoft PDF is highly customizable and very easy to edit, covering many different styles from creative to business presentations. Slidegeeks has creative team members who have crafted amazing templates. So, go and get them without any delay.
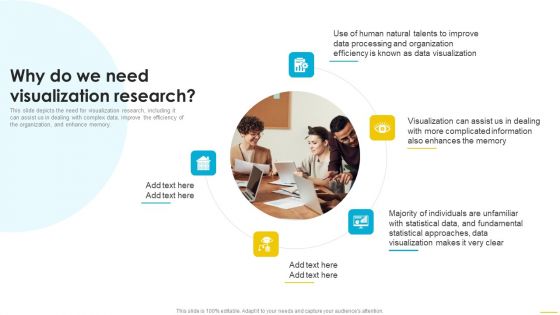
Data And Information Visualization Why Do We Need Visualization Research Summary PDF
This slide depicts the need for visualization research, including it can assist us in dealing with complex data, improve the efficiency of the organization, and enhance memory. Slidegeeks is one of the best resources for PowerPoint templates. You can download easily and regulate Data And Information Visualization Why Do We Need Visualization Research Summary PDF for your personal presentations from our wonderful collection. A few clicks is all it takes to discover and get the most relevant and appropriate templates. Use our Templates to add a unique zing and appeal to your presentation and meetings. All the slides are easy to edit and you can use them even for advertisement purposes.
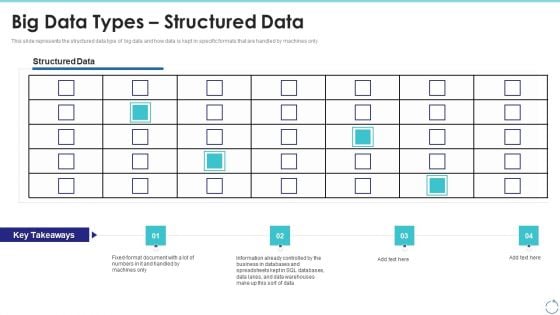
Big Data Types Structured Data Ppt Ideas Visual Aids PDF
This slide represents the structured data type of big data and how data is kept in specific formats that are handled by machines only. Deliver an awe inspiring pitch with this creative big data types structured data ppt ideas visual aids pdf bundle. Topics like data warehouses, databases, information, business can be discussed with this completely editable template. It is available for immediate download depending on the needs and requirements of the user.
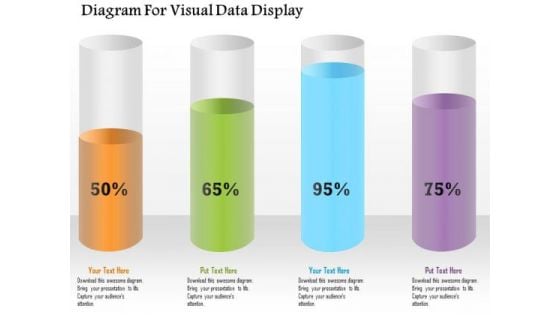
Business Diagram Diagram For Visual Data Display Presentation Template
Four colored cylindrical bars with percentage values are used to design this power point template. This diagram slide helps to display financial data analysis. Use this diagram for your business and finance related presentations.
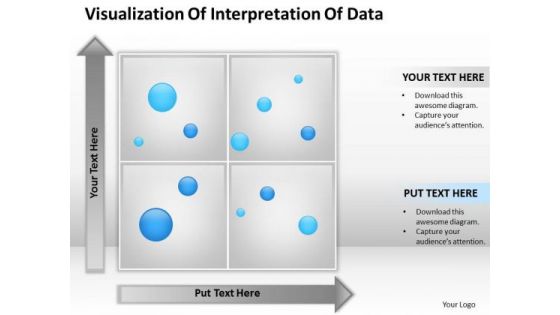
Business PowerPoint Template Visualization Of Interpretation Data Ppt Slides
Open up doors that lead to success. Our Business powerpoint template visualization of interpretation data ppt Slidesprovide the handles. Oppurtunity will come knocking at your door. Welcome it with our Success PowerPoint Templates. Our Advertising PowerPoint Templates abhor doodling. They never let the interest flag. Get your experiment rolling along. Press the button with our Business PowerPoint Template Visualization Of Interpretation Data Ppt Slides.
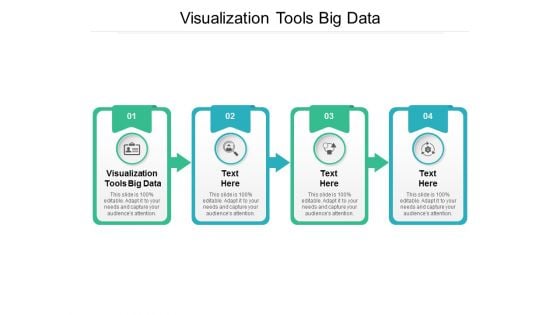
Visualization Tools Big Data Ppt PowerPoint Presentation Summary Outline Cpb
Presenting this set of slides with name visualization tools big data ppt powerpoint presentation summary outline cpb. This is an editable Powerpoint four stages graphic that deals with topics like visualization tools big data to help convey your message better graphically. This product is a premium product available for immediate download and is 100 percent editable in Powerpoint. Download this now and use it in your presentations to impress your audience.
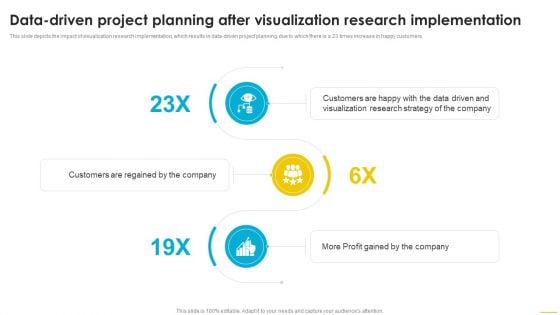
Data Driven Project Planning After Visualization Research Implementation Diagrams PDF
This slide depicts the impact of visualization research implementation, which results in data-driven project planning, due to which there is a 23 times increase in happy customers. Want to ace your presentation in front of a live audience Our Data Driven Project Planning After Visualization Research Implementation Diagrams PDF can help you do that by engaging all the users towards you. Slidegeeks experts have put their efforts and expertise into creating these impeccable powerpoint presentations so that you can communicate your ideas clearly. Moreover, all the templates are customizable, and easy to edit and downloadable. Use these for both personal and commercial use.
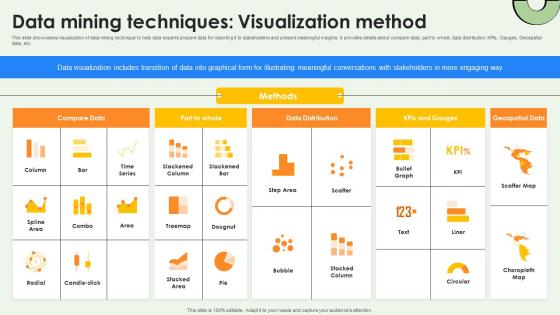
Data Warehousing And Data Mining Techniques Visualization Method AI SS V
This slide showcases visualization of data mining technique to help data experts prepare data for reporting it to stakeholders and present meaningful insights. It provides details about compare data, part to whole, data distribution, KPIs, Gauges, Geospatial data, etc. Find a pre-designed and impeccable Data Warehousing And Data Mining Techniques Visualization Method AI SS V. The templates can ace your presentation without additional effort. You can download these easy-to-edit presentation templates to make your presentation stand out from others. So, what are you waiting for Download the template from Slidegeeks today and give a unique touch to your presentation. This slide showcases visualization of data mining technique to help data experts prepare data for reporting it to stakeholders and present meaningful insights. It provides details about compare data, part to whole, data distribution, KPIs, Gauges, Geospatial data, etc.
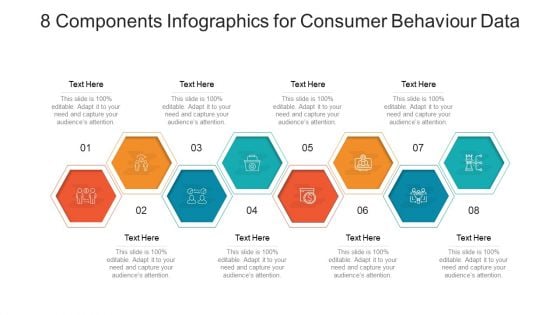
8 Components Infographics For Consumer Behaviour Data Ppt Visual Aids Portfolio PDF
Presenting 8 components infographics for consumer behaviour data ppt visual aids portfolio pdf to dispense important information. This template comprises eight stages. It also presents valuable insights into the topics including 8 components infographics for consumer behaviour data. This is a completely customizable PowerPoint theme that can be put to use immediately. So, download it and address the topic impactfully.
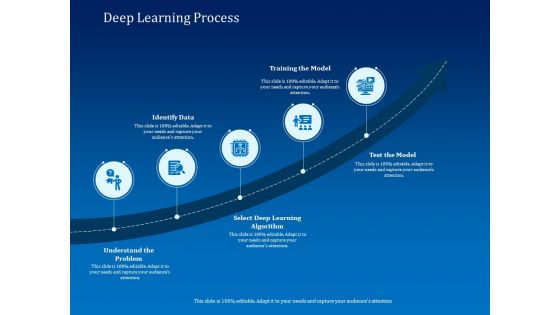
Back Propagation Program AI Deep Learning Process Identify Data Ppt Visual Aids Inspiration PDF
Presenting back propagation program ai deep learning process identify data ppt visual aids inspiration pdf to provide visual cues and insights. Share and navigate important information on five stages that need your due attention. This template can be used to pitch topics like identify data, training model, test model, deep learning algorithm. In addition, this PPT design contains high-resolution images, graphics, etc, that are easily editable and available for immediate download.
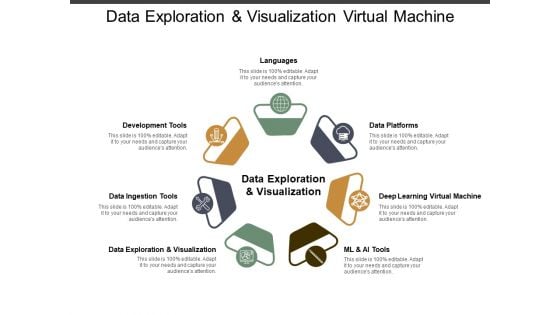
Data Exploration And Visualization Virtual Machine Ppt PowerPoint Presentation Infographics Diagrams
This is a data exploration and visualization virtual machine ppt powerpoint presentation infographics diagrams. This is a seven stage process. The stages in this process are data, analysis, data science, information science.
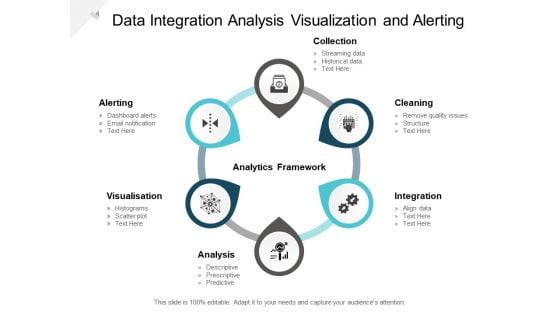
Data Integration Analysis Visualization And Alerting Ppt PowerPoint Presentation Gallery Deck Cpb
This is a data integration analysis visualization and alerting ppt powerpoint presentation gallery deck cpb. This is a six stage process. The stages in this process are data analysis, analytics architecture, analytics framework.
Business Intelligence Dashboard Icon For Data Analysis And Visualization Information PDF
Persuade your audience using this Business Intelligence Dashboard Icon For Data Analysis And Visualization Information PDF. This PPT design covers three stages, thus making it a great tool to use. It also caters to a variety of topics including Business Intelligence Dashboard Icon, Data Analysis And Visualization. Download this PPT design now to present a convincing pitch that not only emphasizes the topic but also showcases your presentation skills.
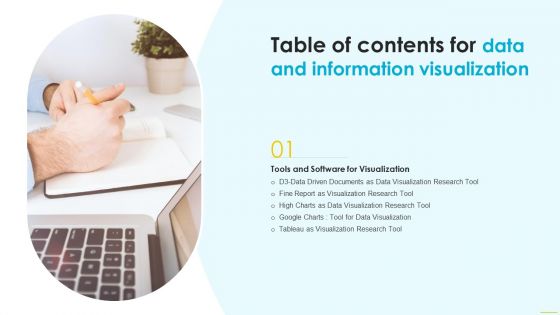
Table Of Contents For Data And Information Visualization Tool Structure PDF
Whether you have daily or monthly meetings, a brilliant presentation is necessary. Table Of Contents For Data And Information Visualization Tool Structure PDF can be your best option for delivering a presentation. Represent everything in detail using Table Of Contents For Data And Information Visualization Tool Structure PDF and make yourself stand out in meetings. The template is versatile and follows a structure that will cater to your requirements. All the templates prepared by Slidegeeks are easy to download and edit. Our research experts have taken care of the corporate themes as well. So, give it a try and see the results.
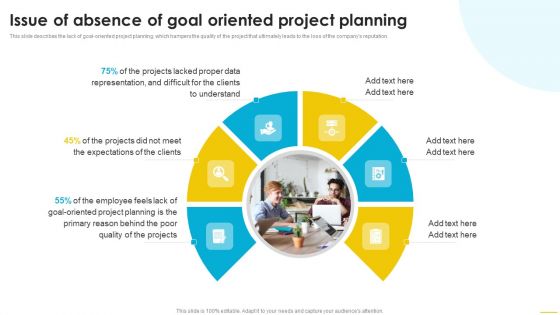
Data And Information Visualization Issue Of Absence Of Goal Oriented Project Planning Demonstration PDF
This slide describes the lack of goal oriented project planning, which hampers the quality of the project that ultimately leads to the loss of the companys reputation. Boost your pitch with our creative Data And Information Visualization Issue Of Absence Of Goal Oriented Project Planning Demonstration PDF. Deliver an awe inspiring pitch that will mesmerize everyone. Using these presentation templates you will surely catch everyones attention. You can browse the ppts collection on our website. We have researchers who are experts at creating the right content for the templates. So you do not have to invest time in any additional work. Just grab the template now and use them.
Plan Financial Data Governance Icon Ppt Visual Aids PDF
Presenting Plan Financial Data Governance Icon Ppt Visual Aids PDF to dispense important information. This template comprises four stages. It also presents valuable insights into the topics including Plan Financial, Data Governance, Icon. This is a completely customizable PowerPoint theme that can be put to use immediately. So, download it and address the topic impactfully.
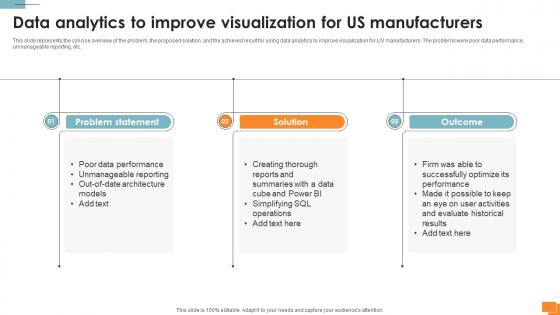
Statistical Tools For Evidence Data Analytics To Improve Visualization For Us Manufacturers
This slide represents the concise overview of the problem, the proposed solution, and the achieved result for using data analytics to improve visualization for US manufacturers. The problems were poor data performance, unmanageable reporting, etc. Crafting an eye-catching presentation has never been more straightforward. Let your presentation shine with this tasteful yet straightforward Statistical Tools For Evidence Data Analytics To Improve Visualization For Us Manufacturers template. It offers a minimalistic and classy look that is great for making a statement. The colors have been employed intelligently to add a bit of playfulness while still remaining professional. Construct the ideal Statistical Tools For Evidence Data Analytics To Improve Visualization For Us Manufacturers that effortlessly grabs the attention of your audience Begin now and be certain to wow your customers This slide represents the concise overview of the problem, the proposed solution, and the achieved result for using data analytics to improve visualization for US manufacturers. The problems were poor data performance, unmanageable reporting, etc.
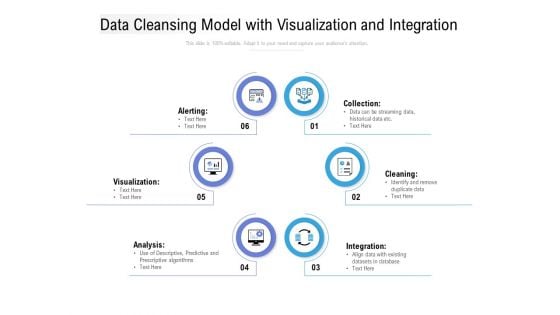
Data Cleansing Model With Visualization And Integration Ppt Slides Guidelines PDF
Presenting this set of slides with name data cleansing model with visualization and integration ppt slides guidelines pdf. This is a six stage process. The stages in this process are collection, cleaning, integration, analysis, visualization, alerting. This is a completely editable PowerPoint presentation and is available for immediate download. Download now and impress your audience.
Table Of Contents Information Visualizations Playbook Data Pictures PDF
Presenting Table Of Contents Information Visualizations Playbook Data Pictures PDF to provide visual cues and insights. Share and navigate important information on one stages that need your due attention. This template can be used to pitch topics like Automated Data Analysis, Information Visualizations Playbook. In addtion, this PPT design contains high resolution images, graphics, etc, that are easily editable and available for immediate download.
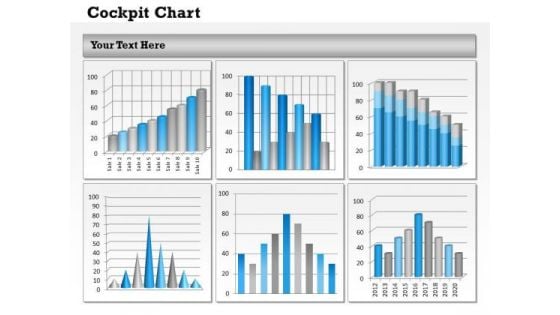
Consulting Diagram Dashboard To Visualize Business Data Consulting Diagram
Establish Your Dominion With Our Consulting Diagram Dashboard To Visualize Business Data Consulting Diagram Powerpoint Templates. Rule The Stage With Your Thoughts.
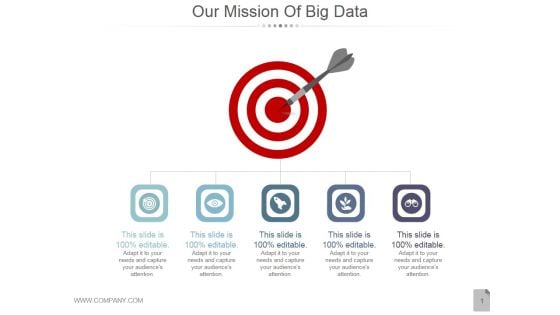
Our Mission Of Big Data Ppt PowerPoint Presentation Visuals
This is a our mission of big data ppt powerpoint presentation visuals. This is a five stage process. The stages in this process are targets, business, marketing, success, icons.
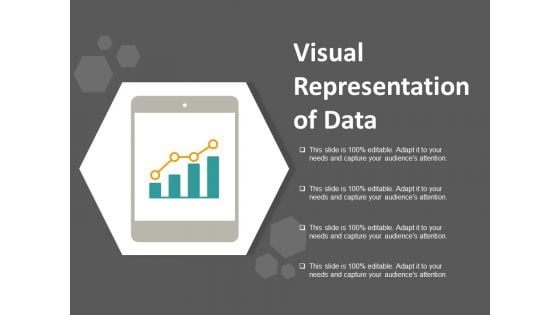
Visual Representation Of Data Ppt Powerpoint Presentation Model Images
This is a visual representation of data ppt powerpoint presentation model images. This is a four stage process. The stages in this process are data visualization icon, data management icon.
Visual Representation Of Data Ppt PowerPoint Presentation Icon Sample
Presenting this set of slides with name visual representation of data ppt powerpoint presentation icon sample. This is a one stage process. The stages in this process are data visualization icon, research analysis, business focus. This is a completely editable PowerPoint presentation and is available for immediate download. Download now and impress your audience.
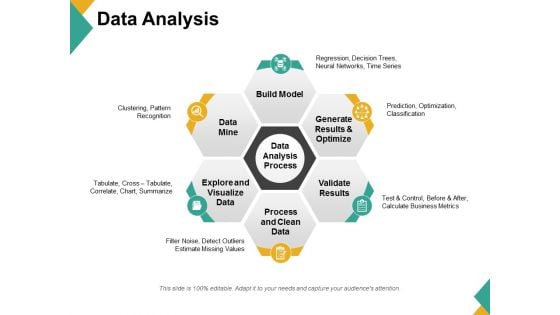
Data Analysis Ppt PowerPoint Presentation Visual Aids Diagrams
This is a data analysis ppt powerpoint presentation visual aids diagrams. This is a six stage process. The stages in this process are build model, generate results and optimize, validate results, process and clean data, explore and visualize data, data mine.
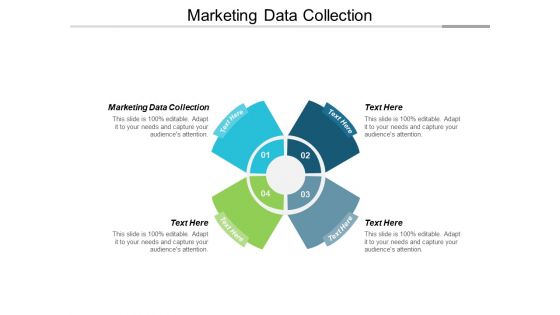
Marketing Data Collection Ppt Powerpoint Presentation Visual Aids Diagrams Cpb
This is a marketing data collection ppt powerpoint presentation visual aids diagrams cpb. This is a four stage process. The stages in this process are marketing data collection.
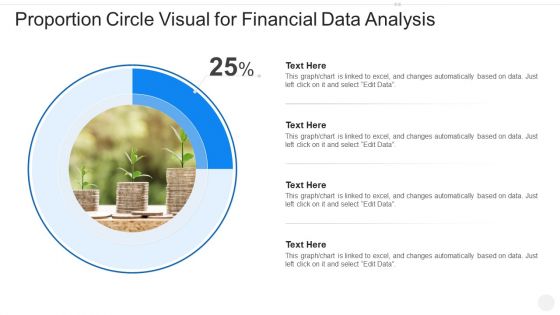
Proportion Circle Visual For Financial Data Analysis Guidelines PDF
Showcasing this set of slides titled proportion circle visual for financial data analysis guidelines pdf. The topics addressed in these templates are proportion circle visual for financial data analysis. All the content presented in this PPT design is completely editable. Download it and make adjustments in color, background, font etc. as per your unique business setting.
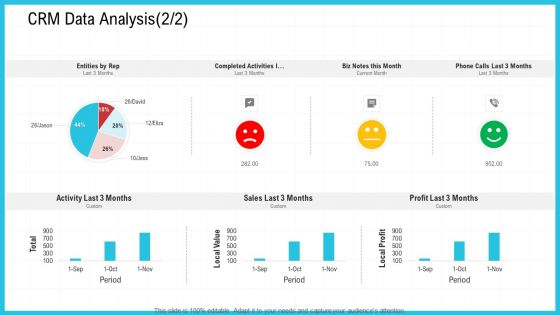
CRM Data Analysis Value Ppt Ideas Visual Aids PDF
Deliver an awe inspiring pitch with this creative crm data analysis value ppt ideas visual aids pdf bundle. Topics like crm data analysis can be discussed with this completely editable template. It is available for immediate download depending on the needs and requirements of the user.
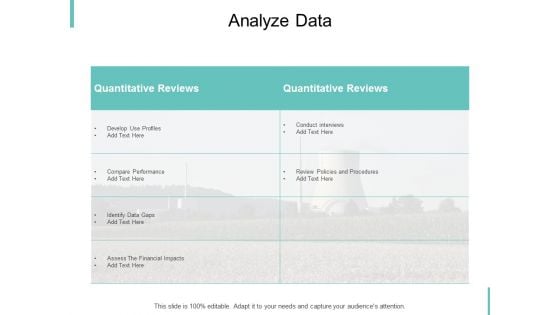
Analyze Data Ppt PowerPoint Presentation Slides Visual Aids
Presenting this set of slides with name analyze data ppt powerpoint presentation slides visual aids. The topics discussed in these slides are business, management, planning, strategy, marketing. This is a completely editable PowerPoint presentation and is available for immediate download. Download now and impress your audience.
Work Performance Data Ppt PowerPoint Presentation Show Visual Aids Cpb
Presenting this set of slides with name work performance data ppt powerpoint presentation show visual aids cpb. This is an editable Powerpoint three stages graphic that deals with topics like work performance data to help convey your message better graphically. This product is a premium product available for immediate download and is 100 percent editable in Powerpoint. Download this now and use it in your presentations to impress your audience.
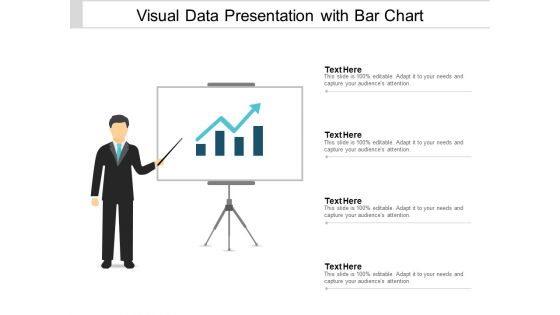
Visual Data Presentation With Bar Chart Ppt PowerPoint Presentation Portfolio Brochure
This is a visual data presentation with bar chart ppt powerpoint presentation portfolio brochure. This is a four stage process. The stages in this process are visual aids, communication, business.

Decision Support System What Is Cloud Data Warehouse Ppt Visual Aids Pictures PDF
This slide depicts what a cloud data warehouse is and how it can store data from many data sources and is scalable as per the organizational needs. Presenting Decision Support System What Is Cloud Data Warehouse Ppt Visual Aids Pictures PDF to provide visual cues and insights. Share and navigate important information on four stages that need your due attention. This template can be used to pitch topics like Data Sources, Cloud Data Warehouse, Essential Component. In addtion, this PPT design contains high resolution images, graphics, etc, that are easily editable and available for immediate download.
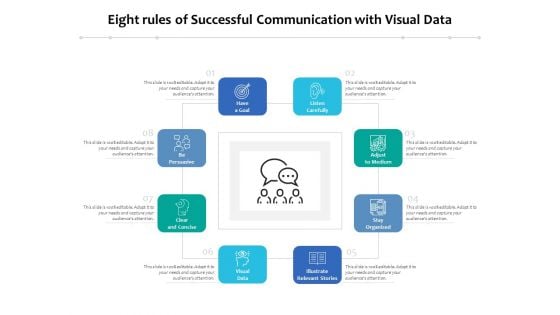
Eight Rules Of Successful Communication With Visual Data Ppt PowerPoint Presentation File Outline PDF
Persuade your audience using this eight rules of successful communication with visual data ppt powerpoint presentation file outline pdf. This PPT design covers eight stages, thus making it a great tool to use. It also caters to a variety of topics including organized, persuasive, goal. Download this PPT design now to present a convincing pitch that not only emphasizes the topic but also showcases your presentation skills.
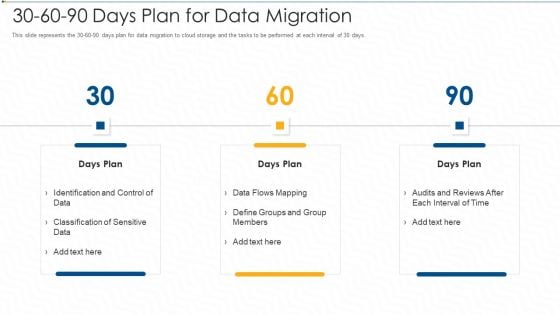
30 60 90 Days Plan For Data Migration Ppt Visual Aids Background Images PDF
This slide represents the 30 60 90 days plan for data migration to cloud storage and the tasks to be performed at each interval of 30 days. This is a 30 60 90 days plan for data migration ppt visual aids background images pdf template with various stages. Focus and dispense information on three stages using this creative set, that comes with editable features. It contains large content boxes to add your information on topics like 30 60 90 days plan for data migration. You can also showcase facts, figures, and other relevant content using this PPT layout. Grab it now.
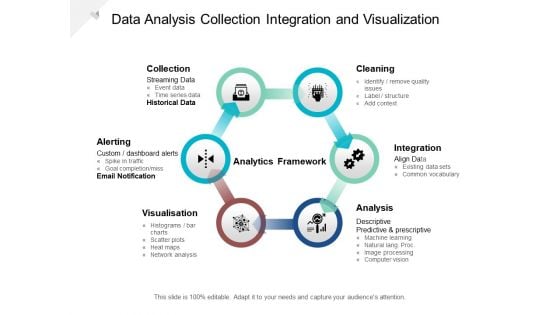
Data Analysis Collection Integration And Visualization Ppt PowerPoint Presentation Summary Graphics Tutorials Cpb
This is a data analysis collection integration and visualization ppt powerpoint presentation summary graphics tutorials cpb. This is a six stage process. The stages in this process are data analysis, analytics architecture, analytics framework.
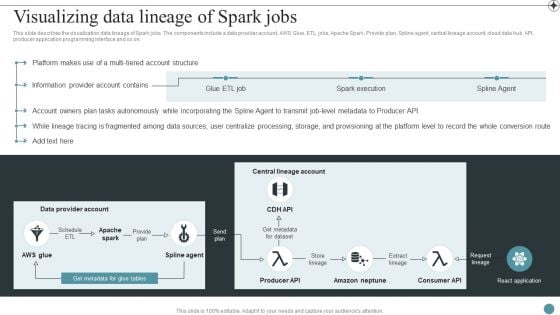
Visualizing Data Lineage Of Spark Jobs Deploying Data Lineage IT Professional PDF
This slide describes the visualization data lineage of Spark jobs. The components include a data provider account, AWS Glue, ETL jobs, Apache Spark, Provide plan, Spline agent, central lineage account, cloud data hub API, producer application programming interface and so on.Make sure to capture your audiences attention in your business displays with our gratis customizable Visualizing Data Lineage Of Spark Jobs Deploying Data Lineage IT Professional PDF. These are great for business strategies, office conferences, capital raising or task suggestions. If you desire to acquire more customers for your tech business and ensure they stay satisfied, create your own sales presentation with these plain slides.

Social Media Big Data Facts Ppt PowerPoint Presentation Visuals
This is a social media big data facts ppt powerpoint presentation visuals. This is a eight stage process. The stages in this process are search queries, of data, tweets, new emails are generated, transactions.
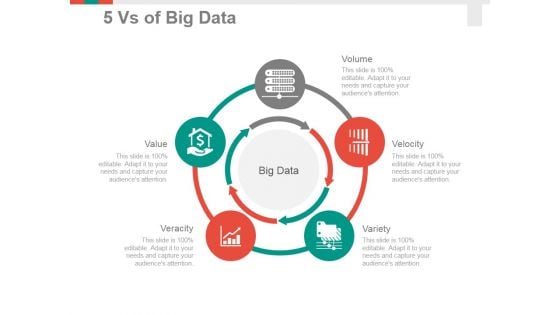
5 Vs Of Big Data Ppt PowerPoint Presentation Summary Visuals
This is a 5 vs of big data ppt powerpoint presentation summary visuals. This is a five stage process. The stages in this process are volume, velocity, variety, veracity, value.
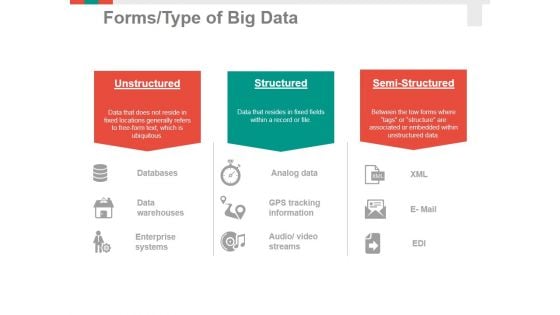
Forms Type Of Big Data Ppt PowerPoint Presentation Ideas Visuals
This is a forms type of big data ppt powerpoint presentation ideas visuals. This is a three stage process. The stages in this process are unstructured, structured, semi structured.
Financial Enterprise Data Governance Plan Ppt Icon Visuals PDF
This slide showcases an ideal structure to utilize data within the organization to ensure security and reliability of data in enterprises according to the data usage policies and standards. The key strategies include identify data source, define data, standardize data and data handling. Persuade your audience using this Financial Enterprise Data Governance Plan Ppt Icon Visuals PDF. This PPT design covers four stages, thus making it a great tool to use. It also caters to a variety of topics including Identify Data Source, Define Data, Standardize Data, Data Handling. Download this PPT design now to present a convincing pitch that not only emphasizes the topic but also showcases your presentation skills.

Future Data Mining Ppt PowerPoint Presentation Visuals Cpb
Presenting this set of slides with name future data mining ppt powerpoint presentation visuals cpb. This is an editable Powerpoint four stages graphic that deals with topics like future data mining to help convey your message better graphically. This product is a premium product available for immediate download and is 100 percent editable in Powerpoint. Download this now and use it in your presentations to impress your audience.


 Continue with Email

 Home
Home


