Data Visualization
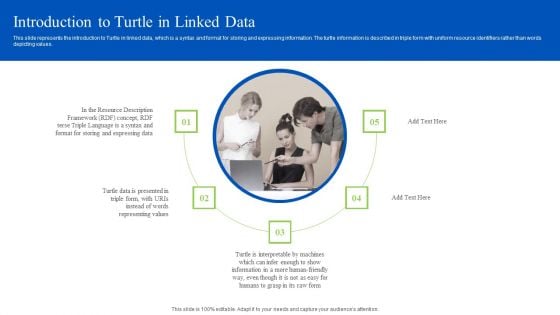
Linked Data Visualization Introduction To Turtle In Linked Data Demonstration PDF
This slide represents the introduction to Turtle in linked data, which is a syntax and format for storing and expressing information. The turtle information is described in triple form with uniform resource identifiers rather than words depicting values. Whether you have daily or monthly meetings, a brilliant presentation is necessary. Linked Data Visualization Introduction To Turtle In Linked Data Demonstration PDF can be your best option for delivering a presentation. Represent everything in detail using Linked Data Visualization Introduction To Turtle In Linked Data Demonstration PDF and make yourself stand out in meetings. The template is versatile and follows a structure that will cater to your requirements. All the templates prepared by Slidegeeks are easy to download and edit. Our research experts have taken care of the corporate themes as well. So, give it a try and see the results.
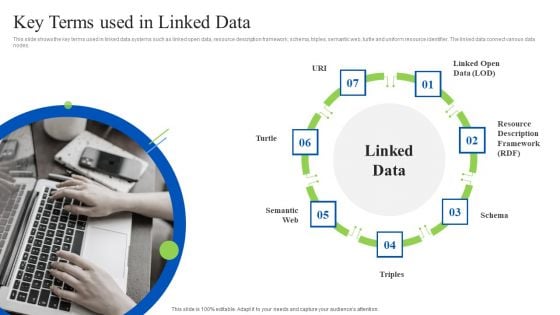
Linked Data Visualization Key Terms Used In Linked Data Ppt Styles Sample PDF
This slide shows the key terms used in linked data systems such as linked open data, resource description framework, schema, triples, semantic web, turtle and uniform resource identifier. The linked data connect various data nodes. Formulating a presentation can take up a lot of effort and time, so the content and message should always be the primary focus. The visuals of the PowerPoint can enhance the presenters message, so our Linked Data Visualization Key Terms Used In Linked Data Ppt Styles Sample PDF was created to help save time. Instead of worrying about the design, the presenter can concentrate on the message while our designers work on creating the ideal templates for whatever situation is needed. Slidegeeks has experts for everything from amazing designs to valuable content, we have put everything into Linked Data Visualization Key Terms Used In Linked Data Ppt Styles Sample PDF.
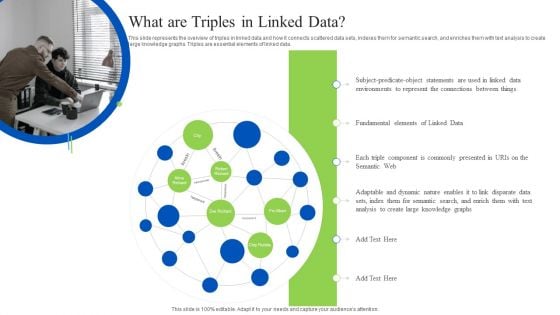
Linked Data Visualization What Are Triples In Linked Data Ppt Model Topics PDF
This slide represents the overview of triples in linked data and how it connects scattered data sets, indexes them for semantic search, and enriches them with text analysis to create large knowledge graphs. Triples are essential elements of linked data. Retrieve professionally designed Linked Data Visualization What Are Triples In Linked Data Ppt Model Topics PDF to effectively convey your message and captivate your listeners. Save time by selecting pre-made slideshows that are appropriate for various topics, from business to educational purposes. These themes come in many different styles, from creative to corporate, and all of them are easily adjustable and can be edited quickly. Access them as PowerPoint templates or as Google Slides themes. You dont have to go on a hunt for the perfect presentation because Slidegeeks got you covered from everywhere.
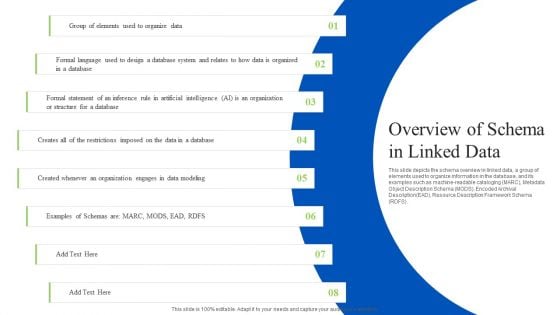
Linked Data Visualization Overview Of Schema In Linked Data Ppt File Sample PDF
This slide depicts the schema overview in linked data, a group of elements used to organize information in the database, and its examples such as machine-readable cataloging MARC, Metadata Object Description Schema MODS, Encoded Archival Description EAD, Resource Description Framework Schema RDFS. Welcome to our selection of the Linked Data Visualization Overview Of Schema In Linked Data Ppt File Sample PDF. These are designed to help you showcase your creativity and bring your sphere to life. Planning and Innovation are essential for any business that is just starting out. This collection contains the designs that you need for your everyday presentations. All of our PowerPoints are 100 percent editable, so you can customize them to suit your needs. This multi-purpose template can be used in various situations. Grab these presentation templates today.
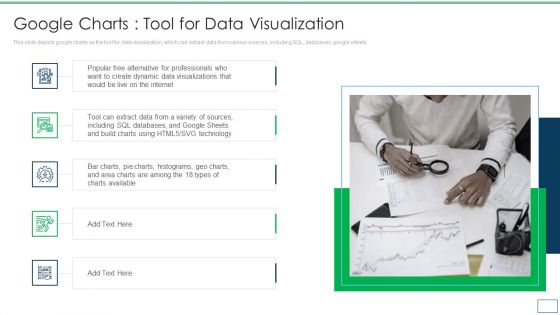
Departments Of Visualization Research Google Charts Tool For Data Visualization Themes PDF
This slide depicts google charts as the tool for data visualization, which can extract data from various sources, including SQL, databases, google sheets.This is a Departments Of Visualization Research Google Charts Tool For Data Visualization Themes PDF template with various stages. Focus and dispense information on five stages using this creative set, that comes with editable features. It contains large content boxes to add your information on topics like Popular Free Alternative, Create Dynamic Data, Including SQL Databases You can also showcase facts, figures, and other relevant content using this PPT layout. Grab it now.
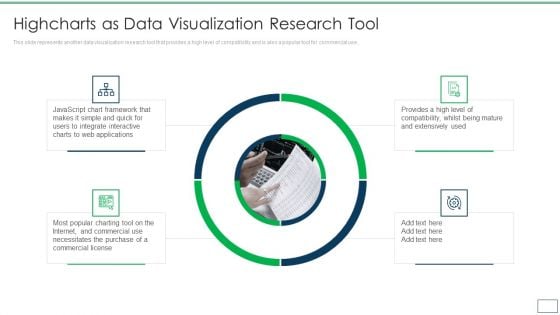
Departments Of Visualization Research Highcharts As Data Visualization Research Tool Ideas PDF
This slide represents another data visualization research tool that provides a high level of compatibility and is also a popular tool for commercial use.Presenting Departments Of Visualization Research Highcharts As Data Visualization Research Tool Ideas PDF to provide visual cues and insights. Share and navigate important information on four stages that need your due attention. This template can be used to pitch topics like Integrate Interactive, Necessitates The Purchase, Javascript Chart Framework In addtion, this PPT design contains high resolution images, graphics, etc, that are easily editable and available for immediate download.
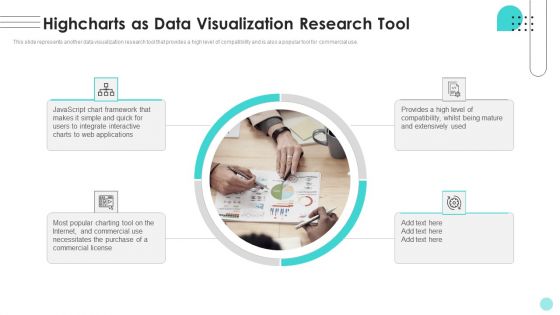
Branches For Visualization Research And Development Highcharts As Data Visualization Ideas PDF
This slide represents another data visualization research tool that provides a high level of compatibility and is also a popular tool for commercial use. Whether you have daily or monthly meetings, a brilliant presentation is necessary. Branches For Visualization Research And Development Highcharts As Data Visualization Ideas PDF can be your best option for delivering a presentation. Represent everything in detail using Branches For Visualization Research And Development Highcharts As Data Visualization Ideas PDF and make yourself stand out in meetings. The template is versatile and follows a structure that will cater to your requirements. All the templates prepared by Slidegeeks are easy to download and edit. Our research experts have taken care of the corporate themes as well. So, give it a try and see the results.

Departments Of Visualization Research Different Types Of Analysis For Data Visualization Summary PDF
This slide describes the different types of analysis for data visualization, such as univariate analysis, bivariate analysis, and multivariate analysis.This is a Departments Of Visualization Research Different Types Of Analysis For Data Visualization Summary PDF template with various stages. Focus and dispense information on five stages using this creative set, that comes with editable features. It contains large content boxes to add your information on topics like Multivariate Analysis, Assess Practically, Univariate Analysis You can also showcase facts, figures, and other relevant content using this PPT layout. Grab it now.
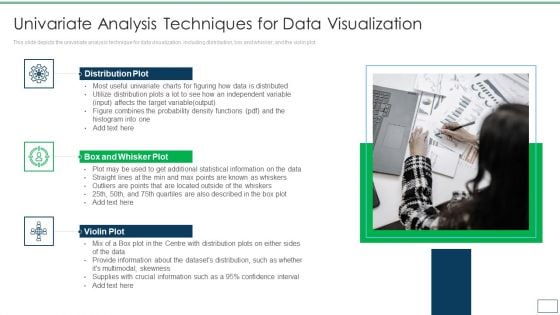
Departments Of Visualization Research Univariate Analysis Techniques For Data Visualization Microsoft PDF
This slide depicts the univariate analysis technique for data visualization, including distribution, box and whisker, and the violin plot.This is a Departments Of Visualization Research Univariate Analysis Techniques For Data Visualization Microsoft PDF template with various stages. Focus and dispense information on three stages using this creative set, that comes with editable features. It contains large content boxes to add your information on topics like Distribution Plot, Box And Whisker Plot, Violin Plot You can also showcase facts, figures, and other relevant content using this PPT layout. Grab it now.

Departments Of Visualization Research Bivariate Analysis Techniques For Data Visualization Ideas PDF
This slide describes the second analysis technique, bivariate analysis for data visualization, which includes three plots line, bar, and scatter.This is a Departments Of Visualization Research Bivariate Analysis Techniques For Data Visualization Ideas PDF template with various stages. Focus and dispense information on three stages using this creative set, that comes with editable features. It contains large content boxes to add your information on topics like Effective In Evaluating, Displaying Basic, Range Of Applications, Including You can also showcase facts, figures, and other relevant content using this PPT layout. Grab it now.
Departments Of Visualization Research Data Visualization Helps In Academic Research Icons PDF
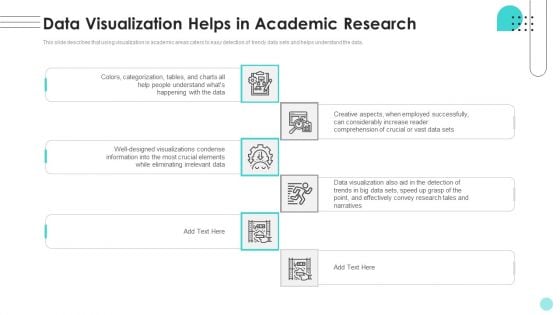
This slide describes that using visualization in academic areas caters to easy detection of trendy data sets and helps understand the data. Presenting Departments Of Visualization Research Data Visualization Helps In Academic Research Icons PDF to provide visual cues and insights. Share and navigate important information on six stages that need your due attention. This template can be used to pitch topics like Eliminating Irrelevant, Visualizations Condense, Employed Successfully In addtion, this PPT design contains high resolution images, graphics, etc, that are easily editable and available for immediate download.
Branches For Visualization Research And Development Data Visualization Helps In Academic Download PDF
This slide describes that using visualization in academic areas caters to easy detection of trendy data sets and helps understand the data. From laying roadmaps to briefing everything in detail, our templates are perfect for you. You can set the stage with your presentation slides. All you have to do is download these easy-to-edit and customizable templates. Branches For Visualization Research And Development Data Visualization Helps In Academic Download PDF will help you deliver an outstanding performance that everyone would remember and praise you for. Do download this presentation today.
Linked Data Visualization Importance To Publish 5 Stars Linked Data Clipart PDF
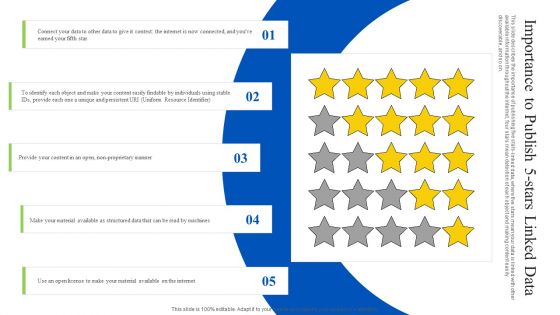
This slide describes the importance of publishing five stars-linked data, where five stars mean your data is linked with other available information throughout the internet, four stars mean detection of each object and making content easily discoverable, and so on. Present like a pro with Linked Data Visualization Importance To Publish 5 Stars Linked Data Clipart PDF Create beautiful presentations together with your team, using our easy-to-use presentation slides. Share your ideas in real-time and make changes on the fly by downloading our templates. So whether youre in the office, on the go, or in a remote location, you can stay in sync with your team and present your ideas with confidence. With Slidegeeks presentation got a whole lot easier. Grab these presentations today.
Data Visualization Advertising Media Ppt PowerPoint Presentation Visual Aids Outline Cpb
Presenting this set of slides with name data visualization advertising media ppt powerpoint presentation visual aids outline cpb. This is an editable Powerpoint three stages graphic that deals with topics like data visualization advertising media to help convey your message better graphically. This product is a premium product available for immediate download and is 100 percent editable in Powerpoint. Download this now and use it in your presentations to impress your audience.
Oracle Cloud Data Analytics Administration IT Oracle Data Visualization Cloud Service DVCS Inspiration PDF
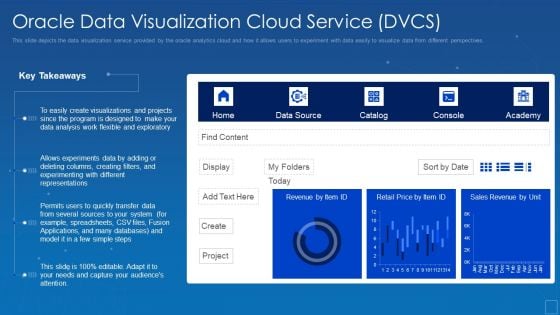
This slide depicts the data visualization service provided by the oracle analytics cloud and how it allows users to experiment with data easily to visualize data from different perspectives. Deliver an awe inspiring pitch with this creative oracle cloud data analytics administration it oracle data visualization cloud service dvcs inspiration pdf bundle. Topics like experiments, representations, sources, visualizations can be discussed with this completely editable template. It is available for immediate download depending on the needs and requirements of the user.
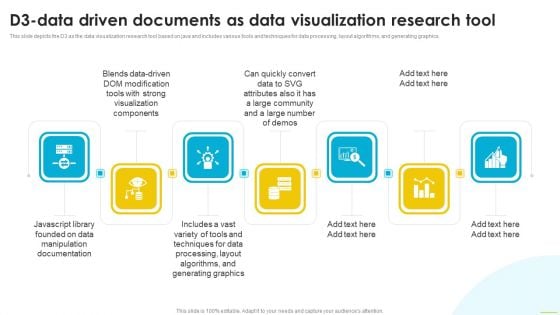
D3 Data Driven Documents As Data Visualization Research Tool Brochure PDF
This slide depicts the D3 as the data visualization research tool based on java and includes various tools and techniques for data processing, layout algorithms, and generating graphics. Crafting an eye catching presentation has never been more straightforward. Let your presentation shine with this tasteful yet straightforward D3 Data Driven Documents As Data Visualization Research Tool Brochure PDF template. It offers a minimalistic and classy look that is great for making a statement. The colors have been employed intelligently to add a bit of playfulness while still remaining professional. Construct the ideal D3 Data Driven Documents As Data Visualization Research Tool Brochure PDF that effortlessly grabs the attention of your audience Begin now and be certain to wow your customers.
Data Analytics Visualization Ppt PowerPoint Presentation Visual Aids Portfolio Cpb
This is a data analytics visualization ppt powerpoint presentation visual aids portfolio cpb. This is a five stage process. The stages in this process are data analytics visualization.
Data Reports Visualization Vector Ppt PowerPoint Presentation Visual Aids Deck
Presenting this set of slides with name data reports visualization vector ppt powerpoint presentation visual aids deck. The topics discussed in these slides are data visualization icon, research analysis, business focus. This is a completely editable PowerPoint presentation and is available for immediate download. Download now and impress your audience.
Business Plan And Strategy 4 Stages For Data Visualization Strategic Planning Template Ppt Slide
Your Listeners Will Never Doodle. Our business plan and strategy 4 stages for data visualization strategic planning template ppt slide Powerpoint Templates Will Hold Their Concentration. Do The One Thing With Your Thoughts. Uphold Custom With Our Process and Flows Powerpoint Templates.
Personal Data Visualization On Computer Screen Ppt Powerpoint Presentation Infographics Vector
This is a personal data visualization on computer screen ppt powerpoint presentation infographics vector. This is a three stage process. The stages in this process are data visualization icon, data management icon.
Business Value Data Visualization Ppt PowerPoint Presentation Infographic Template Background Images Cpb
This is a business value data visualization ppt powerpoint presentation infographic template background images cpb. This is a three stage process. The stages in this process are business value data visualization.
Personal Data Visualization On Computer Screen Ppt PowerPoint Presentation Show Layout Ideas
Presenting this set of slides with name personal data visualization on computer screen ppt powerpoint presentation show layout ideas. This is a one stage process. The stages in this process are data visualization icon, research analysis, business focus. This is a completely editable PowerPoint presentation and is available for immediate download. Download now and impress your audience.
Key Nodes With Data Visualization Vector Icon Ppt PowerPoint Presentation Icon Example Introduction PDF
Presenting key nodes with data visualization vector icon ppt powerpoint presentation icon example introduction pdf to dispense important information. This template comprises three stages. It also presents valuable insights into the topics including key nodes with data visualization vector icon. This is a completely customizable PowerPoint theme that can be put to use immediately. So, download it and address the topic impactfully.
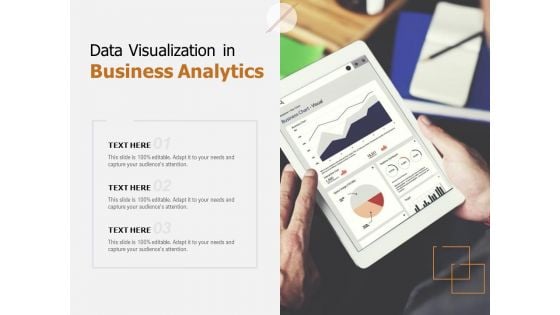
Data Visualization In Business Analytics Ppt PowerPoint Presentation Portfolio File Formats
Presenting this set of slides with name data visualization in business analytics ppt powerpoint presentation portfolio file formats. This is a three stage process. The stages in this process are data visualization, business analytics. This is a completely editable PowerPoint presentation and is available for immediate download. Download now and impress your audience.

Image For Real Time Iot Internet Of Things In Healthcare Industry Data Visualization Guidelines PDF
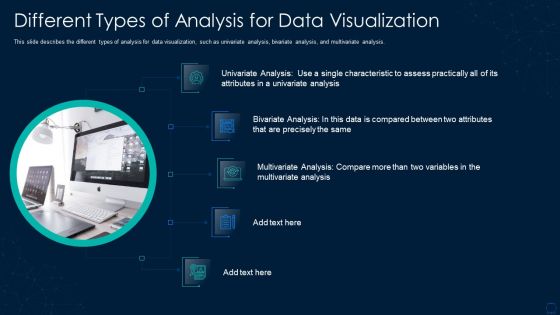
Graphical Representation Of Research IT Different Types Of Analysis For Data Visualization Structure PDF
This slide describes the different types of analysis for data visualization, such as univariate analysis, bivariate analysis, and multivariate analysis. This is a graphical representation of research it different types of analysis for data visualization structure pdf template with various stages. Focus and dispense information on five stages using this creative set, that comes with editable features. It contains large content boxes to add your information on topics like different types of analysis for data visualization. You can also showcase facts, figures, and other relevant content using this PPT layout. Grab it now.
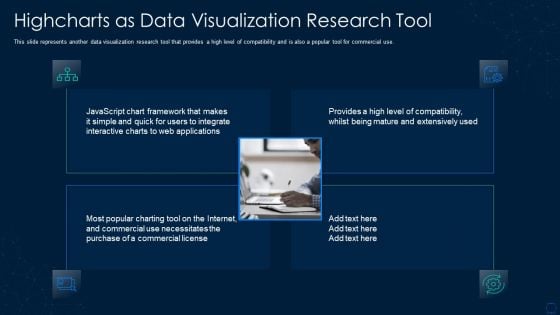
Graphical Representation Of Research IT Highcharts As Data Visualization Research Demonstration PDF
This slide represents another data visualization research tool that provides a high level of compatibility and is also a popular tool for commercial use. This is a graphical representation of research it highcharts as data visualization research demonstration pdf template with various stages. Focus and dispense information on four stages using this creative set, that comes with editable features. It contains large content boxes to add your information on topics like highcharts as data visualization research tool. You can also showcase facts, figures, and other relevant content using this PPT layout. Grab it now.
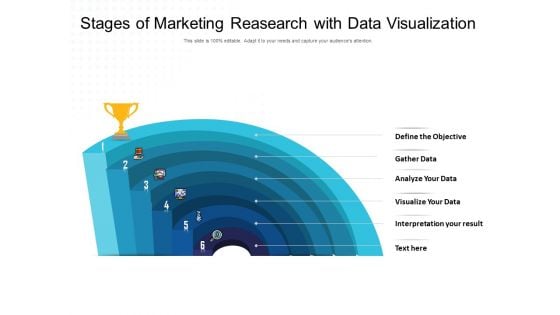
Stages Of Marketing Reasearch With Data Visualization Ppt PowerPoint Presentation Styles Ideas PDF
Presenting this set of slides with name stages of marketing reasearch with data visualization ppt powerpoint presentation styles ideas pdf. This is a six stage process. The stages in this process are define the objective, gather data, analyze your data, visualize your data, interpretation your result. This is a completely editable PowerPoint presentation and is available for immediate download. Download now and impress your audience.
Four Steps Process For Data Visualization Ppt PowerPoint Presentation Infographic Template Inspiration
This is a four steps process for data visualization ppt powerpoint presentation infographic template inspiration. This is a four stage process. The stages in this process are circle process 4 arrows, circle cycle 4 arrows, circular process 4 arrows.
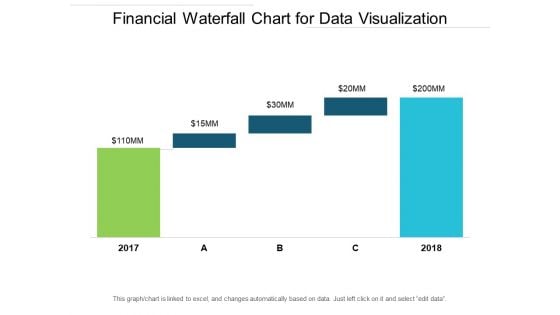
Financial Waterfall Chart For Data Visualization Ppt PowerPoint Presentation Ideas Elements
This is a financial waterfall chart for data visualization ppt powerpoint presentation ideas elements. This is a five stage process. The stages in this process are sales waterfall, waterfall chart, business.
Business Intelligence Data Visualization Ppt PowerPoint Presentation Infographics Graphics Tutorials Cpb
Presenting this set of slides with name business intelligence data visualization ppt powerpoint presentation infographics graphics tutorials cpb. This is an editable Powerpoint four stages graphic that deals with topics like business intelligence data visualization to help convey your message better graphically. This product is a premium product available for immediate download and is 100 percent editable in Powerpoint. Download this now and use it in your presentations to impress your audience.
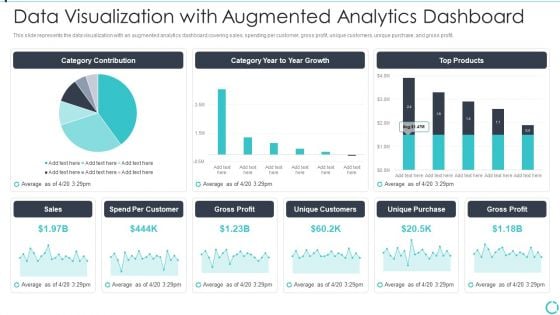
Augmented Analytics Implementation IT Data Visualization With Augmented Analytics Microsoft PDF
This slide represents the data visualization with an augmented analytics dashboard covering sales, spending per customer, gross profit, unique customers, unique purchase, and gross profit. Deliver an awe inspiring pitch with this creative Augmented Analytics Implementation IT Data Visualization With Augmented Analytics Microsoft PDF bundle. Topics like Category Contribution, Category Year To Year Growth, Top Products, Sales, Gross Profit can be discussed with this completely editable template. It is available for immediate download depending on the needs and requirements of the user.
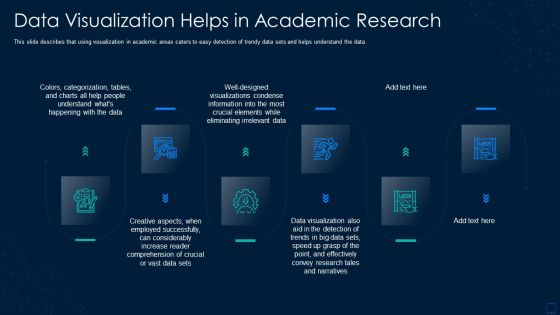
Graphical Representation Of Research IT Data Visualization Helps In Academic Research Microsoft PDF
This slide describes that using visualization in academic areas caters to easy detection of trendy data sets and helps understand the data. Presenting graphical representation of research it data visualization helps in academic research microsoft pdf to provide visual cues and insights. Share and navigate important information on six stages that need your due attention. This template can be used to pitch topics like data visualization helps in academic research. In addtion, this PPT design contains high resolution images, graphics, etc, that are easily editable and available for immediate download.
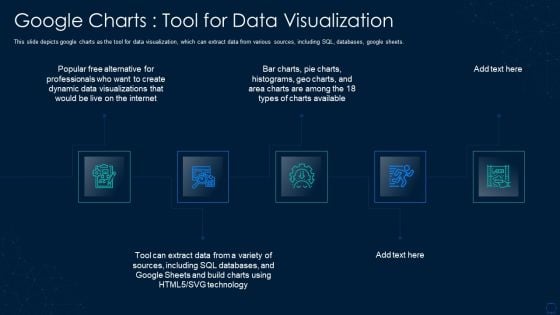
Graphical Representation Of Research IT Google Charts Tool For Data Visualization Introduction PDF
This slide depicts google charts as the tool for data visualization, which can extract data from various sources, including SQL, databases, google sheets. This is a graphical representation of research it google charts tool for data visualization introduction pdf template with various stages. Focus and dispense information on five stages using this creative set, that comes with editable features. It contains large content boxes to add your information on topics like dynamic, databases, sources, technology. You can also showcase facts, figures, and other relevant content using this PPT layout. Grab it now.
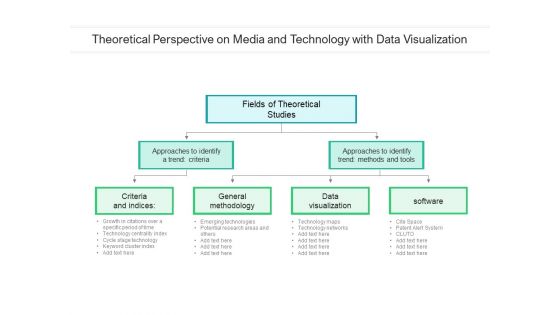
Theoretical Perspective On Media And Technology With Data Visualization Ppt PowerPoint Presentation File Background Image PDF
Presenting this set of slides with name theoretical perspective on media and technology with data visualization ppt powerpoint presentation file background image pdf. This is a three stage process. The stages in this process are methodology, visualization, criteria. This is a completely editable PowerPoint presentation and is available for immediate download. Download now and impress your audience.
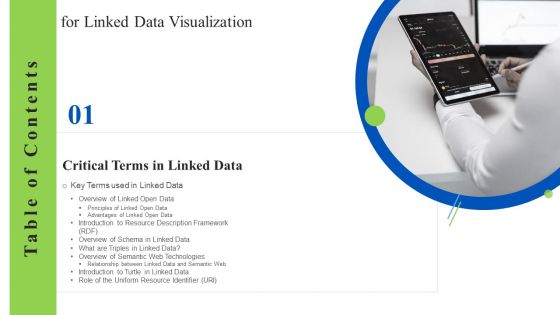
Table Of Contents For Linked Data Visualization Ppt Show Designs Download PDF
Presenting this PowerPoint presentation, titled Table Of Contents For Linked Data Visualization Ppt Show Designs Download PDF, with topics curated by our researchers after extensive research. This editable presentation is available for immediate download and provides attractive features when used. Download now and captivate your audience. Presenting this Table Of Contents For Linked Data Visualization Ppt Show Designs Download PDF. Our researchers have carefully researched and created these slides with all aspects taken into consideration. This is a completely customizable Table Of Contents For Linked Data Visualization Ppt Show Designs Download PDF that is available for immediate downloading. Download now and make an impact on your audience. Highlight the attractive features available with our PPTs.
Data Visualization Vector Icon With Text Holders Ppt Powerpoint Presentation Summary Design Inspiration
This is a data visualization vector icon with text holders ppt powerpoint presentation summary design inspiration. The topics discussed in this diagram are data management icon, big data icon. This is a completely editable PowerPoint presentation, and is available for immediate download.
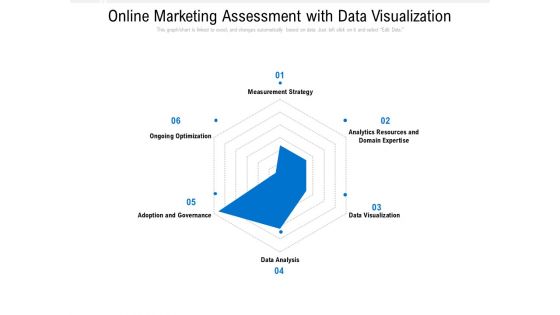
Online Marketing Assessment With Data Visualization Ppt PowerPoint Presentation Gallery Background Images PDF
Presenting this set of slides with name online marketing assessment with data visualization ppt powerpoint presentation gallery background images pdf. The topics discussed in these slides are strategy, data analysis, optimization. This is a completely editable PowerPoint presentation and is available for immediate download. Download now and impress your audience.
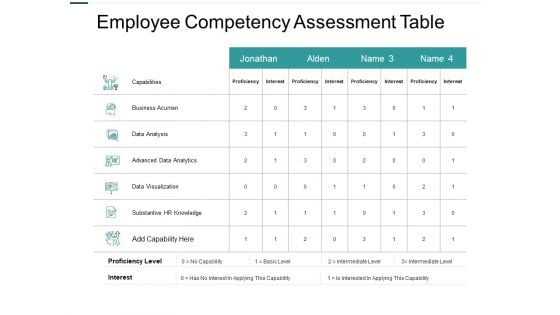
Employee Competency Assessment Table Data Visualization Ppt PowerPoint Presentation Infographic Template Grid
Presenting this set of slides with name employee competency assessment table data visualization ppt powerpoint presentation infographic template grid. The topics discussed in these slides are marketing, business, management, planning, strategy. This is a completely editable PowerPoint presentation and is available for immediate download. Download now and impress your audience.
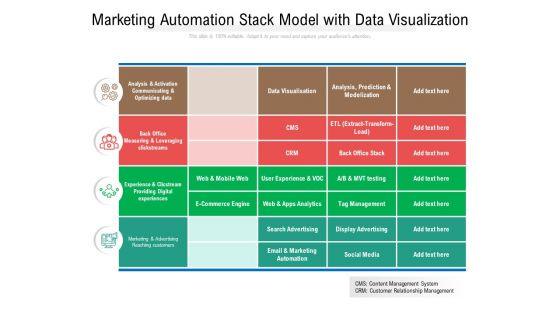
Marketing Automation Stack Model With Data Visualization Ppt PowerPoint Presentation File Show PDF
Showcasing this set of slides titled marketing automation stack model with data visualization ppt powerpoint presentation file show pdf. The topics addressed in these templates are analysis, communicating, optimizing. All the content presented in this PPT design is completely editable. Download it and make adjustments in color, background, font etc. as per your unique business setting.
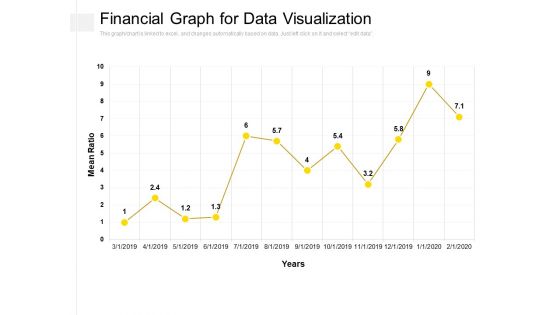
Financial Graph For Data Visualization Ppt PowerPoint Presentation Slides Picture PDF
Presenting this set of slides with name financial graph for data visualization ppt powerpoint presentation slides picture pdf. The topics discussed in these slides are mean ration, year. This is a completely editable PowerPoint presentation and is available for immediate download. Download now and impress your audience.
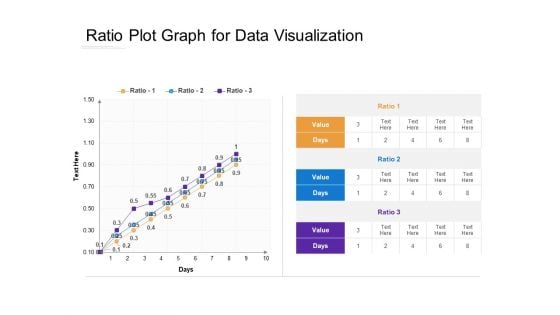
Ratio Plot Graph For Data Visualization Ppt PowerPoint Presentation Ideas Outfit PDF
Presenting this set of slides with name ratio plot graph for data visualization ppt powerpoint presentation ideas outfit pdf. The topics discussed in these slides are ratio, value, days. This is a completely editable PowerPoint presentation and is available for immediate download. Download now and impress your audience.
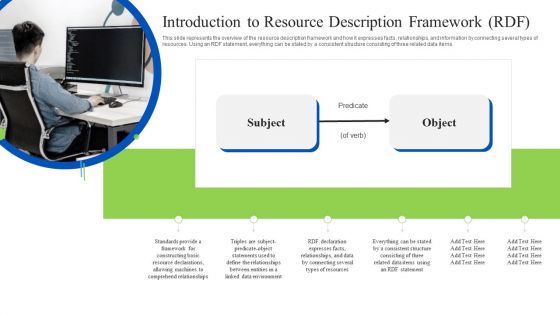
Linked Data Visualization Introduction To Resource Description Framework RDF Clipart PDF
This slide represents the overview of the resource description framework and how it expresses facts, relationships, and information by connecting several types of resources. Using an RDF statement, everything can be stated by a consistent structure consisting of three related data items. Do you have an important presentation coming up Are you looking for something that will make your presentation stand out from the rest Look no further than Linked Data Visualization Introduction To Resource Description Framework RDF Clipart PDF. With our professional designs, you can trust that your presentation will pop and make delivering it a smooth process. And with Slidegeeks, you can trust that your presentation will be unique and memorable. So why wait Grab Linked Data Visualization Introduction To Resource Description Framework RDF Clipart PDF today and make your presentation stand out from the rest.
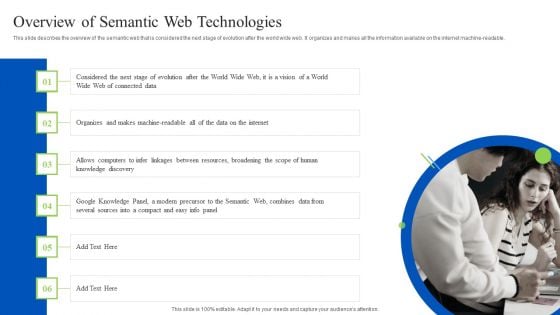
Linked Data Visualization Overview Of Semantic Web Technologies Ppt Summary Skills PDF
This slide describes the overview of the semantic web that is considered the next stage of evolution after the world wide web. It organizes and makes all the information available on the internet machine-readable. Explore a selection of the finest Linked Data Visualization Overview Of Semantic Web Technologies Ppt Summary Skills PDF here. With a plethora of professionally designed and pre-made slide templates, you can quickly and easily find the right one for your upcoming presentation. You can use our Linked Data Visualization Overview Of Semantic Web Technologies Ppt Summary Skills PDF to effectively convey your message to a wider audience. Slidegeeks has done a lot of research before preparing these presentation templates. The content can be personalized and the slides are highly editable. Grab templates today from Slidegeeks.
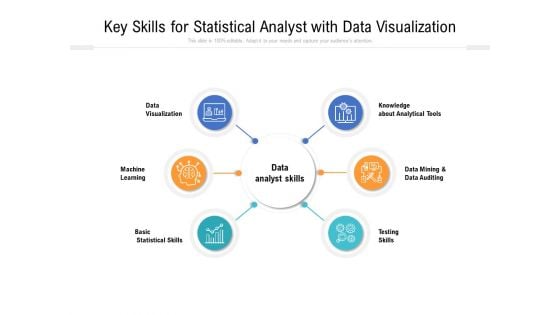
Key Skills For Statistical Analyst With Data Visualization Ppt PowerPoint Presentation Gallery Elements PDF
Presenting key skills for statistical analyst with data visualization ppt powerpoint presentation gallery elements pdf. to dispense important information. This template comprises six stages. It also presents valuable insights into the topics including machine, learning, statistical skills analyst, testing skills, analytical tools, knowledge. This is a completely customizable PowerPoint theme that can be put to use immediately. So, download it and address the topic impactfully.
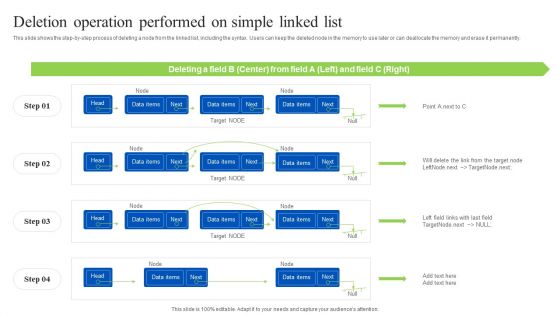
Linked Data Visualization Deletion Operation Performed On Simple Linked List Microsoft PDF
This slide shows the step-by-step process of deleting a node from the linked list, including the syntax. Users can keep the deleted node in the memory to use later or can deallocate the memory and erase it permanently. Get a simple yet stunning designed Linked Data Visualization Deletion Operation Performed On Simple Linked List Microsoft PDF. It is the best one to establish the tone in your meetings. It is an excellent way to make your presentations highly effective. So, download this PPT today from Slidegeeks and see the positive impacts. Our easy-to-edit Linked Data Visualization Deletion Operation Performed On Simple Linked List Microsoft PDF can be your go-to option for all upcoming conferences and meetings. So, what are you waiting for Grab this template today.
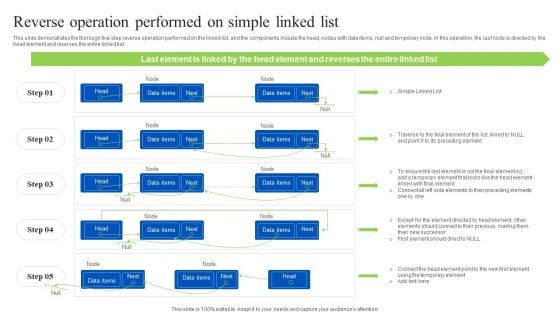
Linked Data Visualization Reverse Operation Performed On Simple Linked List Formats PDF
This slide demonstrates the thorough five-step reverse operation performed on the linked list, and the components include the head, nodes with data items, null and temporary node. In this operation, the last node is directed by the head element and reverses the entire linked list. If your project calls for a presentation, then Slidegeeks is your go-to partner because we have professionally designed, easy-to-edit templates that are perfect for any presentation. After downloading, you can easily edit Linked Data Visualization Reverse Operation Performed On Simple Linked List Formats PDF and make the changes accordingly. You can rearrange slides or fill them with different images. Check out all the handy templates.
Stages Data Visualization Of Stack Overflow Online Business Plan Software PowerPoint Slides
We present our stages data visualization of stack overflow online business plan software PowerPoint Slides.Download and present our Advertising PowerPoint Templates because Our PowerPoint Templates and Slides will let you Clearly mark the path for others to follow. Download and present our Competition PowerPoint Templates because Our PowerPoint Templates and Slides will let Your superior ideas hit the target always and everytime. Download our Business PowerPoint Templates because Timeline crunches are a fact of life. Meet all deadlines using our PowerPoint Templates and Slides. Download and present our Shapes PowerPoint Templates because Our PowerPoint Templates and Slides are innately eco-friendly. Their high recall value negate the need for paper handouts. Use our Targets PowerPoint Templates because You can Hit the nail on the head with our PowerPoint Templates and Slides. Embed your ideas in the minds of your audience.Use these PowerPoint slides for presentations relating to Legal, pressure, heap, documents, file, messy, copy, bureaucracy, order, business, problems, chaos, stack, pile, occupation, finance, data, cardboard, supply, report, vertical, folders, tall, paperwork, stacking, up, overflowing, high, excess, group, objects, paper, over-sized, organization, archive, working, angle, space, drudgery, organized, office, large, ideas, 3d. The prominent colors used in the PowerPoint template are Blue, Gray, White. Assist the audience to comprehend with our Stages Data Visualization Of Stack Overflow Online Business Plan Software PowerPoint Slides. They will always be in your debt.
Stages Data Visualization Of Stack Overflow Short Business Plan Template PowerPoint Slides
We present our stages data visualization of stack overflow short business plan template PowerPoint Slides.Download and present our Advertising PowerPoint Templates because Our PowerPoint Templates and Slides are truly out of this world. Even the MIB duo has been keeping tabs on our team. Present our Competition PowerPoint Templates because You canTake a leap off the starting blocks with our PowerPoint Templates and Slides. They will put you ahead of the competition in quick time. Download and present our Business PowerPoint Templates because Our PowerPoint Templates and Slides come in all colours, shades and hues. They help highlight every nuance of your views. Use our Shapes PowerPoint Templates because you can Set pulses racing with our PowerPoint Templates and Slides. They will raise the expectations of your team. Use our Targets PowerPoint Templates because you should once Tap the ingenuity of our PowerPoint Templates and Slides. They are programmed to succeed.Use these PowerPoint slides for presentations relating to Legal, pressure, heap, documents, file, messy, copy, bureaucracy, order, business, problems, chaos, stack, pile, occupation, finance, data, cardboard, supply, report, vertical, folders, tall, paperwork, stacking, up, overflowing, high, excess, group, objects, paper, over-sized, organization, archive, working, angle, space, drudgery, organized, office, large, ideas, 3d. The prominent colors used in the PowerPoint template are Blue, Gray, White. Optimize your business cyclewith our Stages Data Visualization Of Stack Overflow Short Business Plan Template PowerPoint Slides. You'll deliver your best presentation yet.
Stages Data Visualization Of Stack Overflow Company Business Plan PowerPoint Slides
We present our stages data visualization of stack overflow company business plan PowerPoint Slides.Download our Business PowerPoint Templates because you should Whip up a frenzy with our PowerPoint Templates and Slides. They will fuel the excitement of your team. Use our Leadership PowerPoint Templates because It can Leverage your style with our PowerPoint Templates and Slides. Charm your audience with your ability. Present our Layers PowerPoint Templates because You will get more than you ever bargained for. Present our Shapes PowerPoint Templates because Our PowerPoint Templates and Slides will help you be quick off the draw. Just enter your specific text and see your points hit home. Use our Triangles PowerPoint Templates because Our PowerPoint Templates and Slides will generate and maintain the level of interest you desire. They will create the impression you want to imprint on your audience.Use these PowerPoint slides for presentations relating to layers, icon, stratum, 3d, surface, isolated, segment, grow, blank, presentation, illustration, section, cutting, coat, set, background, thickness, spread, multiple. The prominent colors used in the PowerPoint template are Blue light, Blue navy, White. Our Stages Data Visualization Of Stack Overflow Company Business Plan PowerPoint Slides will ensure your ideas are noticed. You will be glad you tried us out.
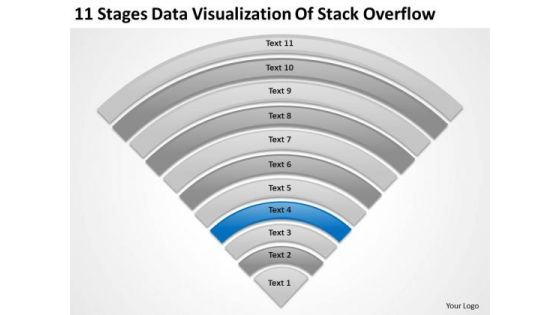
11 Stages Data Visualization Of Stack Overflow Business Plan Format PowerPoint Slides
We present our 11 stages data visualization of stack overflow business plan format PowerPoint Slides.Present our Semicircles PowerPoint Templates because Our PowerPoint Templates and Slides are the chords of your song. String them along and provide the lilt to your views. Present our Business PowerPoint Templates because Our PowerPoint Templates and Slides are effectively colour coded to prioritise your plans They automatically highlight the sequence of events you desire. Use our Triangles PowerPoint Templates because Our PowerPoint Templates and Slides are created with admirable insight. Use them and give your group a sense of your logical mind. Present our Process and Flows PowerPoint Templates because Our PowerPoint Templates and Slides will let Your superior ideas hit the target always and everytime. Use our Shapes PowerPoint Templates because Our PowerPoint Templates and Slides will Activate the energies of your audience. Get their creative juices flowing with your words.Use these PowerPoint slides for presentations relating to Saturation, strip, saturated, line, spectrum, pantone, bright, diagram, circle, sampler, guide, element, paint, scale,shape, label, multicolored, palette, illustration, spectral, guidance, chart, collection, abstraction, selection, choice, visible, variation, painter, contrast, ,gradient, pattern, chooser, analyzer, eleven, steps. The prominent colors used in the PowerPoint template are Blue, Black, White. Approach any ambiguity with assurance. Achieve better balance with our 11 Stages Data Visualization Of Stack Overflow Business Plan Format PowerPoint Slides.
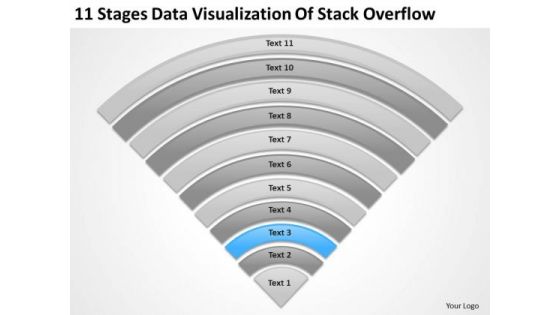
11 Stages Data Visualization Of Stack Overflow Download Business Plan PowerPoint Templates
We present our 11 stages data visualization of stack overflow download business plan PowerPoint templates.Use our Triangles PowerPoint Templates because you should once Tap the ingenuity of our PowerPoint Templates and Slides. They are programmed to succeed. Download our Process and Flows PowerPoint Templates because Our PowerPoint Templates and Slides will give good value for money. They also have respect for the value of your time. Download our Shapes PowerPoint Templates because Our PowerPoint Templates and Slides will embellish your thoughts. See them provide the desired motivation to your team. Download and present our Semicircles PowerPoint Templates because It can be used to Set your controls for the heart of the sun. Our PowerPoint Templates and Slides will be the propellant to get you there. Download and present our Business PowerPoint Templates because Your ideas provide food for thought. Our PowerPoint Templates and Slides will help you create a dish to tickle the most discerning palate.Use these PowerPoint slides for presentations relating to Saturation, strip, saturated, line, spectrum, pantone, bright, diagram, circle, sampler, guide, element, paint, scale,shape, label, multicolored, palette, illustration, spectral, guidance, chart, collection, abstraction, selection, choice, visible, variation, painter, contrast, ,gradient, pattern, chooser, analyzer, eleven, steps. The prominent colors used in the PowerPoint template are Blue light, White, Gray. Discerning clients can be very demanding. But even they will findour 11 Stages Data Visualization Of Stack Overflow Download Business Plan PowerPoint Templates exceptional.
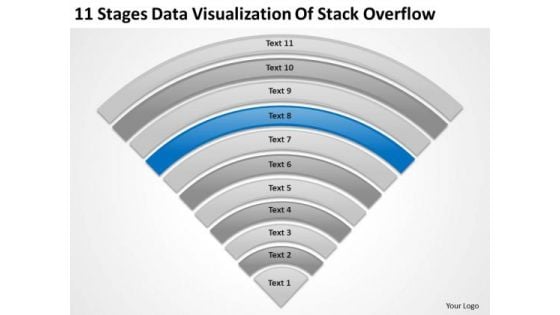
11 Stages Data Visualization Of Stack Overflow How Make Business Plan PowerPoint Slides
We present our 11 stages data visualization of stack overflow how make business plan PowerPoint Slides.Download our Triangles PowerPoint Templates because You canTake a leap off the starting blocks with our PowerPoint Templates and Slides. They will put you ahead of the competition in quick time. Download our Process and Flows PowerPoint Templates because Our PowerPoint Templates and Slides will provide weight to your words. They will bring out the depth of your thought process. Present our Shapes PowerPoint Templates because Our PowerPoint Templates and Slides will Activate the energies of your audience. Get their creative juices flowing with your words. Present our Semicircles PowerPoint Templates because our PowerPoint Templates and Slides will give your ideas the shape. Download our Business PowerPoint Templates because It will get your audience in sync.Use these PowerPoint slides for presentations relating to Saturation, strip, saturated, line, spectrum, pantone, bright, diagram, circle, sampler, guide, element, paint, scale,shape, label, multicolored, palette, illustration, spectral, guidance, chart, collection, abstraction, selection, choice, visible, variation, painter, contrast, ,gradient, pattern, chooser, analyzer, eleven, steps. The prominent colors used in the PowerPoint template are Blue, Gray, Black. Identify likely ares of failure. Alert your team with our 11 Stages Data Visualization Of Stack Overflow How Make Business Plan PowerPoint Slides.
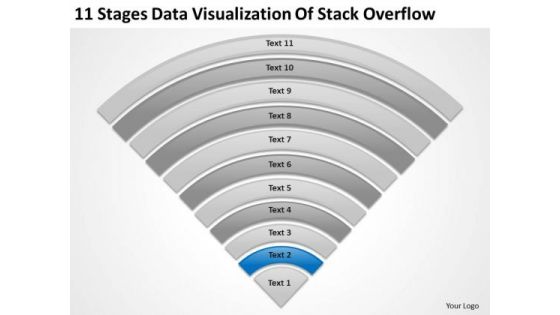
Data Visualization Of Stack Overflow Template For Writing Business Plan PowerPoint Slides
We present our data visualization of stack overflow template for writing business plan PowerPoint Slides.Download our Business PowerPoint Templates because Our PowerPoint Templates and Slides will embellish your thoughts. See them provide the desired motivation to your team. Present our Process and Flows PowerPoint Templates because Our PowerPoint Templates and Slides are the chords of your song. String them along and provide the lilt to your views. Use our Flow Charts PowerPoint Templates because Our PowerPoint Templates and Slides are effectively colour coded to prioritise your plans They automatically highlight the sequence of events you desire. Use our Shapes PowerPoint Templates because You can Bask in the warmth of our PowerPoint Templates and Slides. Enjoy the heartfelt glowing response of your listeners. Use our Triangles PowerPoint Templates because Our PowerPoint Templates and Slides help you meet the demand of the Market. Just browse and pick the slides that appeal to your intuitive senses.Use these PowerPoint slides for presentations relating to Saturation, strip, saturated, line, spectrum, pantone, bright, diagram, circle, sampler, guide, element, paint, scale,shape, ten, multicolored, palette, illustration, spectral, guidance, chart, collection, abstraction, selection, choice, visible, variation, painter, contrast, ,gradient, pattern, chooser, analyzer. The prominent colors used in the PowerPoint template are Blue navy, White, Gray. Get to the core of the issue. Bring out the essence with our Data Visualization Of Stack Overflow Template For Writing Business Plan PowerPoint Slides.
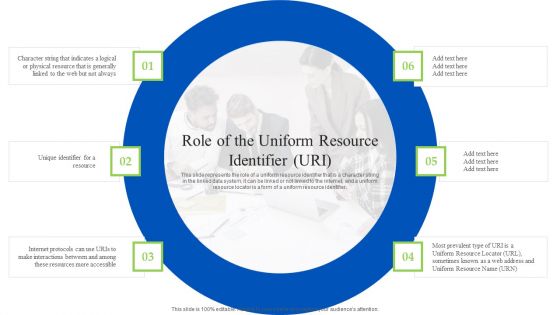
Linked Data Visualization Role Of The Uniform Resource Identifier URI Slides PDF
This slide represents the role of a uniform resource identifier that is a character string in the linked data system, it can be linked or not linked to the internet, and a uniform resource locator is a form of a uniform resource identifier. Are you in need of a template that can accommodate all of your creative concepts This one is crafted professionally and can be altered to fit any style. Use it with Google Slides or PowerPoint. Include striking photographs, symbols, depictions, and other visuals. Fill, move around, or remove text boxes as desired. Test out color palettes and font mixtures. Edit and save your work, or work with colleagues. Download Linked Data Visualization Role Of The Uniform Resource Identifier URI Slides PDF and observe how to make your presentation outstanding. Give an impeccable presentation to your group and make your presentation unforgettable.
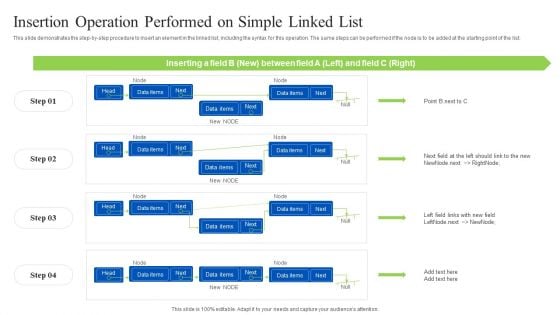
Linked Data Visualization Insertion Operation Performed On Simple Linked List Mockup PDF
This slide demonstrates the step-by-step procedure to insert an element in the linked list, including the syntax for this operation. The same steps can be performed if the node is to be added at the starting point of the list. Slidegeeks is here to make your presentations a breeze with Linked Data Visualization Insertion Operation Performed On Simple Linked List Mockup PDF With our easy-to-use and customizable templates, you can focus on delivering your ideas rather than worrying about formatting. With a variety of designs to choose from, youre sure to find one that suits your needs. And with animations and unique photos, illustrations, and fonts, you can make your presentation pop. So whether youre giving a sales pitch or presenting to the board, make sure to check out Slidegeeks first.
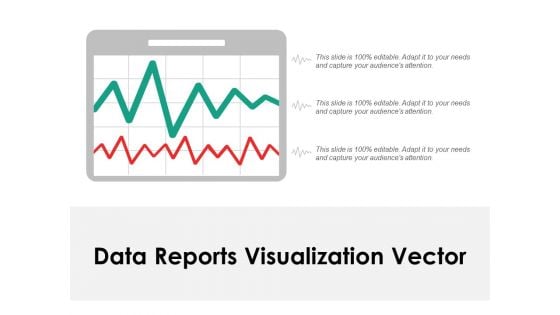
Data Reports Visualization Vector Ppt Powerpoint Presentation Portfolio Grid
This is a data reports visualization vector ppt powerpoint presentation portfolio grid. This is a three stage process. The stages in this process are data visualization icon, data management icon.
Data Analysis Visualization Ppt PowerPoint Presentation Portfolio Graphic Images Cpb
Presenting this set of slides with name data analysis visualization ppt powerpoint presentation portfolio graphic images cpb. This is an editable Powerpoint four stages graphic that deals with topics like data analysis visualization to help convey your message better graphically. This product is a premium product available for immediate download and is 100 percent editable in Powerpoint. Download this now and use it in your presentations to impress your audience.
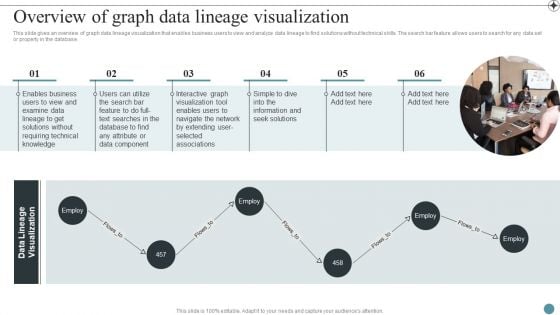
Overview Of Graph Data Lineage Visualization Deploying Data Lineage IT Professional PDF
This slide outlines the pattern-based data lineage technique that generates the data lineage using patterns in metadata. It doesnt require knowledge of programming language for data processing, which is added advantage for non-technical stakeholders.Find a pre-designed and impeccable Overview Of Graph Data Lineage Visualization Deploying Data Lineage IT Professional PDF. The templates can ace your presentation without additional effort. You can download these easy-to-edit presentation templates to make your presentation stand out from others. So, what are you waiting for Download the template from Slidegeeks today and give a unique touch to your presentation.
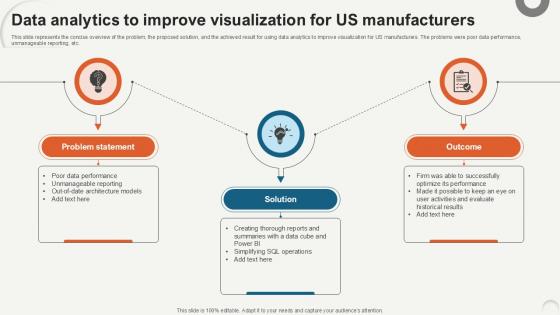
Data Analytics To Improve Visualization Data Analytics For Informed Decision Ppt PowerPoint
This slide represents the concise overview of the problem, the proposed solution, and the achieved result for using data analytics to improve visualization for US manufacturers. The problems were poor data performance, unmanageable reporting, etc. Whether you have daily or monthly meetings, a brilliant presentation is necessary. Data Analytics To Improve Visualization Data Analytics For Informed Decision Ppt PowerPoint can be your best option for delivering a presentation. Represent everything in detail using Data Analytics To Improve Visualization Data Analytics For Informed Decision Ppt PowerPoint and make yourself stand out in meetings. The template is versatile and follows a structure that will cater to your requirements. All the templates prepared by Slidegeeks are easy to download and edit. Our research experts have taken care of the corporate themes as well. So, give it a try and see the results. This slide represents the concise overview of the problem, the proposed solution, and the achieved result for using data analytics to improve visualization for US manufacturers. The problems were poor data performance, unmanageable reporting, etc.


 Continue with Email

 Home
Home


