Data Visualization
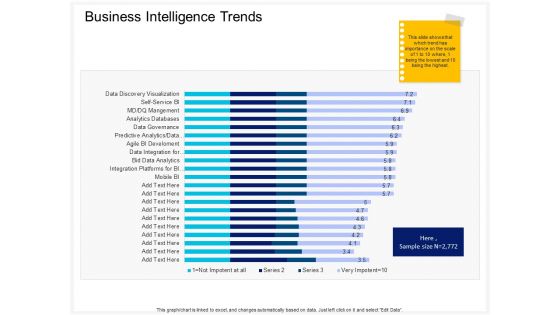
Enterprise Problem Solving And Intellect Business Intelligence Trends Ppt PowerPoint Presentation Styles Graphics PDF
Presenting this set of slides with name enterprise problem solving and intellect business intelligence trends ppt powerpoint presentation styles graphics pdf. The topics discussed in these slides are mobile bi, integration platforms bi and pm, bid data analytics, data integration for business users, agile bi development, predictive analytics, data mining, data governance, analytics databases. This is a completely editable PowerPoint presentation and is available for immediate download. Download now and impress your audience.
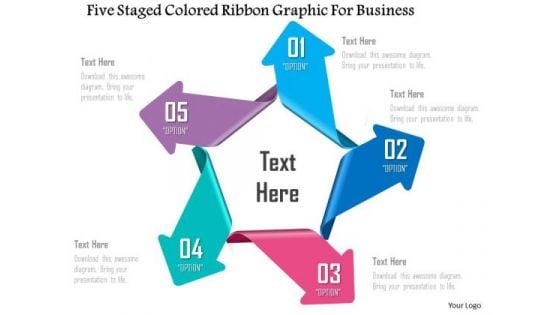
Business Diagram Five Staged Colored Ribbon Graphic For Business PowerPoint Template
Five staged colored ribbon text boxes are used to design this power point template. This PPT contains the concept of data representation. Use this PPT slide for your marketing and business data related presentations.
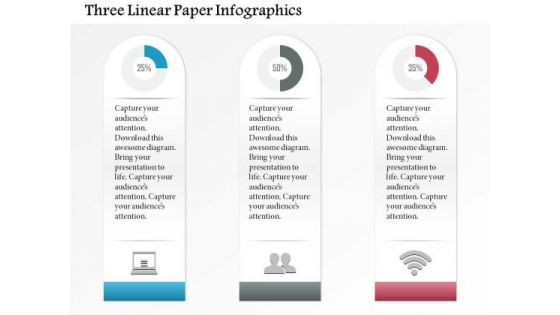
Business Diagram Three Linear Paper Infographics Presentation Template
Three linear paper info graphics has been used to design this power point template slide. This PPT slide contains the concept of data analysis and business data flow. Use this PPT slide for your business and marketing related presentations.
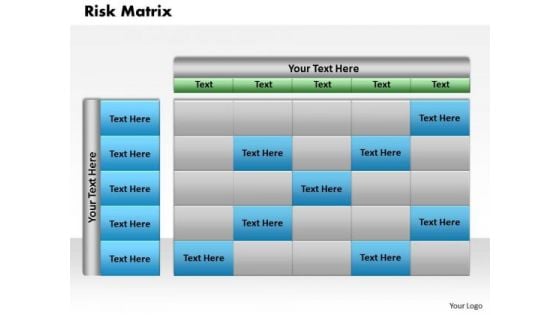
Business Framework Matrix PowerPoint Presentation
This business framework power point template has been designed with graphic of matrix. This two variable matrix can be used for data manipulation and analysis. Use this template to show business data analysis and create an impact on viewers.
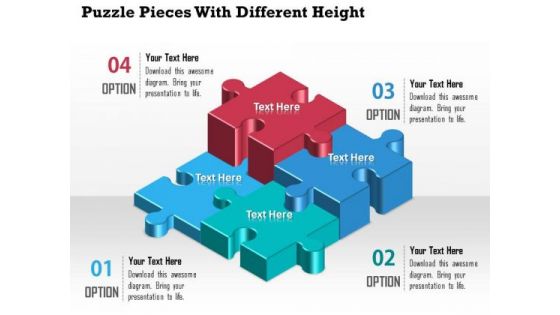
Business Diagram Puzzle Pieces With Different Height Presentation Template
A professional bar graph has been crafted with graphic of puzzles. All these puzzles are in different heights which shows the various levels of any data result representations. Use this diagram for your business result and data analysis related topics.
Business Diagram Globe With Colorful Arrows And Icons Presentation Template
This business diagram has been designed with graphic of globe with arrow and icons. Use our diagram slide to organize data and to display data analysis. This diagram is suitable for global business and marketing related presentations.
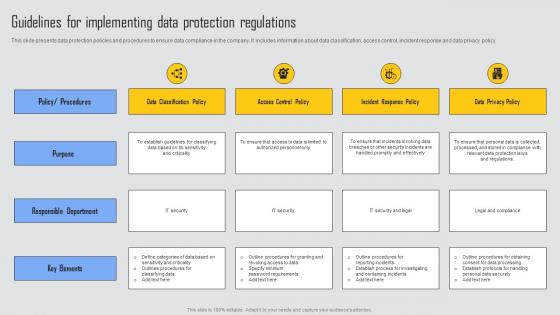
Guidelines For Implementing Managing Risks And Establishing Trust Through Efficient Formats Pdf
This slide presents data protection policies and procedures to ensure data compliance in the company. It includes information about data classification, access control, incident response and data privacy policy. Do you have an important presentation coming up Are you looking for something that will make your presentation stand out from the rest Look no further than Guidelines For Implementing Managing Risks And Establishing Trust Through Efficient Formats Pdf. With our professional designs, you can trust that your presentation will pop and make delivering it a smooth process. And with Slidegeeks, you can trust that your presentation will be unique and memorable. So why wait Grab Guidelines For Implementing Managing Risks And Establishing Trust Through Efficient Formats Pdf today and make your presentation stand out from the rest This slide presents data protection policies and procedures to ensure data compliance in the company. It includes information about data classification, access control, incident response and data privacy policy.
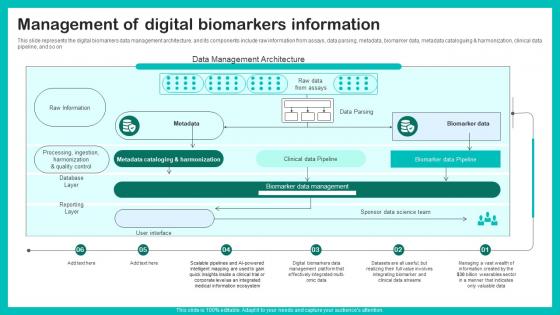
Management Of Digital Biomarkers Digital Biomarkers For Personalized Health Insights Slides Pdf
This slide represents the digital biomarkers data management architecture, and its components include raw information from assays, data parsing, metadata, biomarker data, metadata cataloguing and harmonization, clinical data pipeline, and so on Welcome to our selection of the Management Of Digital Biomarkers Digital Biomarkers For Personalized Health Insights Slides Pdf. These are designed to help you showcase your creativity and bring your sphere to life. Planning and Innovation are essential for any business that is just starting out. This collection contains the designs that you need for your everyday presentations. All of our PowerPoints are 100 percent editable, so you can customize them to suit your needs. This multi purpose template can be used in various situations. Grab these presentation templates today This slide represents the digital biomarkers data management architecture, and its components include raw information from assays, data parsing, metadata, biomarker data, metadata cataloguing and harmonization, clinical data pipeline, and so on
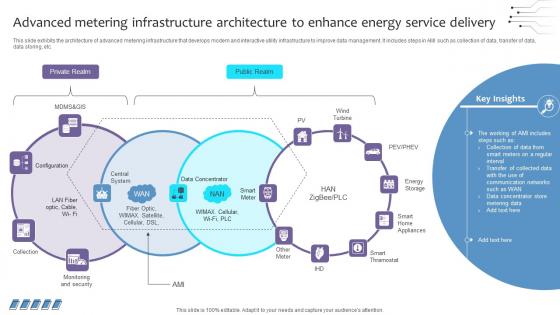
Empowering The Future Advanced Metering Infrastructure Architecture To Enhance IoT SS V
This slide exhibits the architecture of advanced metering infrastructure that develops modern and interactive utility infrastructure to improve data management. It includes steps in AMI such as collection of data, transfer of data, data storing, etc. There are so many reasons you need a Empowering The Future Advanced Metering Infrastructure Architecture To Enhance IoT SS V. The first reason is you can not spend time making everything from scratch, Thus, Slidegeeks has made presentation templates for you too. You can easily download these templates from our website easily. This slide exhibits the architecture of advanced metering infrastructure that develops modern and interactive utility infrastructure to improve data management. It includes steps in AMI such as collection of data, transfer of data, data storing, etc.
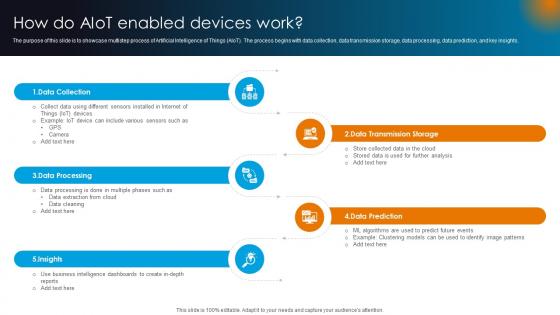
Integrating AI With IoT How Do AIoT Enabled Devices Work IoT SS V
The purpose of this slide is to showcase multistep process of Artificial Intelligence of Things AIoT. The process begins with data collection, data transmission storage, data processing, data prediction, and key insights. This Integrating AI With IoT How Do AIoT Enabled Devices Work IoT SS V is perfect for any presentation, be it in front of clients or colleagues. It is a versatile and stylish solution for organizing your meetings. The Integrating AI With IoT How Do AIoT Enabled Devices Work IoT SS V features a modern design for your presentation meetings. The adjustable and customizable slides provide unlimited possibilities for acing up your presentation. Slidegeeks has done all the homework before launching the product for you. So, do not wait, grab the presentation templates today The purpose of this slide is to showcase multistep process of Artificial Intelligence of Things AIoT. The process begins with data collection, data transmission storage, data processing, data prediction, and key insights.
Stock Photo Computer Server And Colorful Books Pwerpoint Slide
This business image has been crafted with computer server and colorful books. This image displays the concept of data storage and data communication. This image is useful for technical and education related presentation.
Stock Photo Stack Of Books With Computer Server Pwerpoint Slide
This business image has been crafted with computer server and stack of books. This image displays the concept of data storage and data communication. This image is useful for technical and education related presentation.
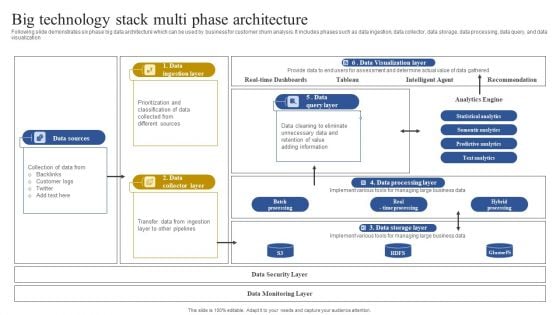
Big Technology Stack Multi Phase Architecture Graphics PDF
Showcasing this set of slides titled Big Technology Stack Multi Phase Architecture Graphics PDF. The topics addressed in these templates are Data Sources, Data Ingestion Layer, Data Query Layer. All the content presented in this PPT design is completely editable. Download it and make adjustments in color, background, font etc. as per your unique business setting.
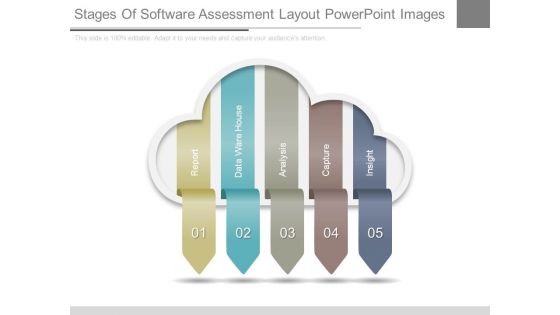
Stages Of Software Assessment Layout Powerpoint Images
This is a stages of software assessment layout powerpoint images. This is a five stage process. The stages in this process are report, data ware house, analysis, capture, insight.
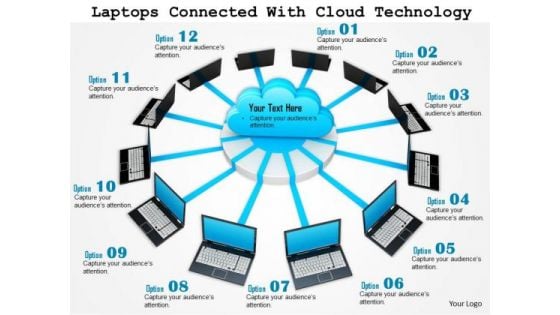
Stock Photo Laptops Connected With Cloud Technology PowerPoint Slide
Graphic of multiple laptops and cloud are used to decorate this power point template. This image template contains the concept of data storage and transfer. Use this PPT for all your data technology and cloud computing related presentations.
1 Icon Of Database Or Disk Storage For A Network File System Or Storage Area Network Ppt Slides
This Powerpoint image slide has been designed with graphic of database icon. This PPT slide contains network file system and storage area network to show data storage. Use this PPT slide in your data storage related presentation.
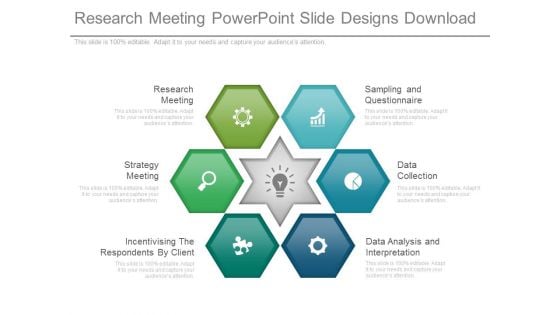
Research Meeting Powerpoint Slide Designs Download
This is a research meeting powerpoint slide designs download. This is a six stage process. The stages in this process are research meeting, sampling and questionnaire, strategy meeting, data collection, incentivising the respondents by client, data analysis and interpretation.
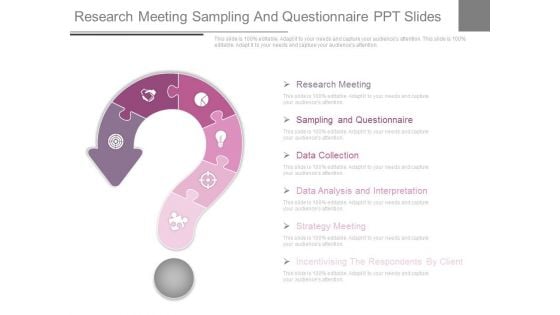
Research Meeting Sampling And Questionnaire Ppt Slides
This is a research meeting sampling and questionnaire ppt slides. This is a six stage process. The stages in this process are sampling and questionnaire, research meeting, data collection, data analysis and interpretation, strategy meeting, incentivising the respondents by client.
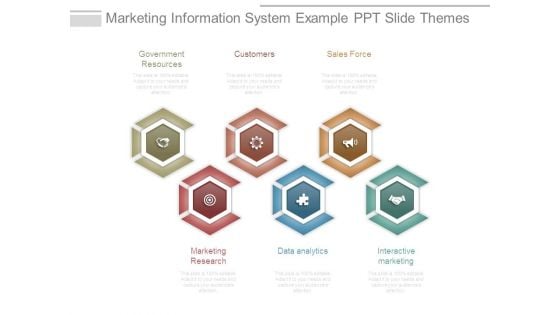
Marketing Information System Example Ppt Slide Themes
This is a marketing information system example ppt slide themes. This is a six stage process. The stages in this process are government resources, customers, sales force, marketing research, data analytics, interactive marketing.
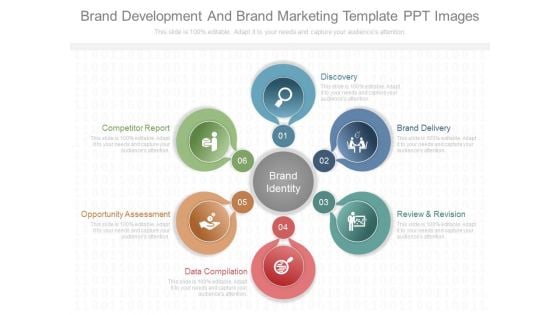
Brand Development And Brand Marketing Template Ppt Images
This is a brand development and brand marketing template ppt images. This is a six stage process. The stages in this process are discovery, brand delivery, review and revision, data compilation, opportunity assessment, competitor report, brand identity.
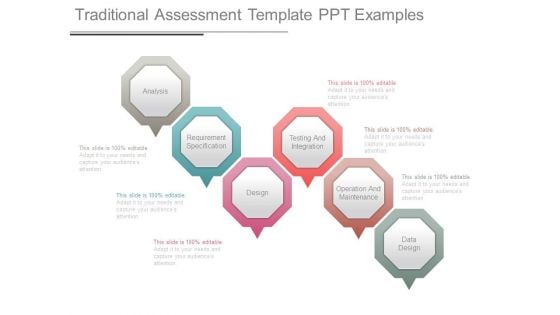
Traditional Assessment Template Ppt Examples
This is a traditional assessment template ppt examples. This is a six stage process. The stages in this process are analysis, requirement specification, design, testing and integration, operation and maintenance, data design.
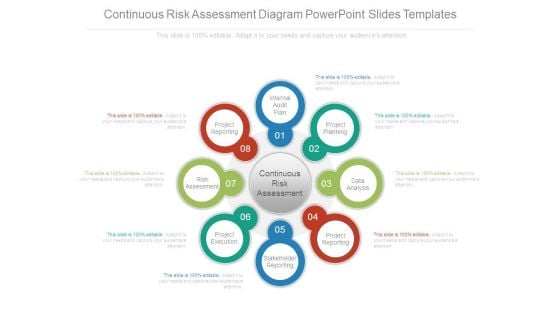
Continuous Risk Assessment Diagram Powerpoint Slides Templates
This is a continuous risk assessment diagram powerpoint slides templates. This is a eight stage process. The stages in this process are internal audit plan, project planning, data analysis, project reporting, stakeholder reporting, project execution, risk assessment, project reporting.
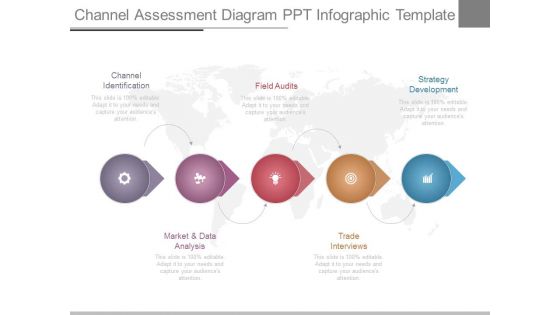
Channel Assessment Diagram Ppt Infographic Template
This is a channel assessment diagram ppt infographic template. This is a five stage process. The stages in this process are channel identification, market and data analysis, field audits, trade interviews, strategy development.
Financial Graph Economic Growth Vector Icon Ppt PowerPoint Presentation Infographics Graphic Images Cpb
This is a financial graph economic growth vector icon ppt powerpoint presentation infographics graphic images cpb. This is a three stage process. The stages in this process are bar chart icon, bar graph icon, data chart icon.
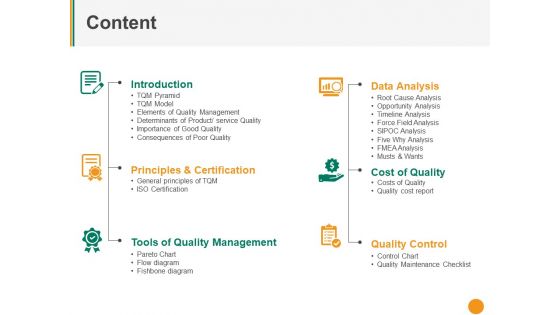
Content Ppt PowerPoint Presentation Layouts Elements
This is a content ppt powerpoint presentation layouts elements. This is a six stage process. The stages in this process are introduction, data analysis, cost of quality, quality control, tools of quality management.
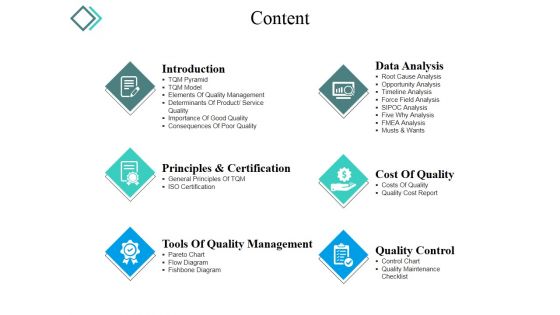
Content Ppt PowerPoint Presentation File Display
This is a content ppt powerpoint presentation file display. This is a six stage process. The stages in this process are introduction, data analysis, cost of quality, quality control.
Histogram Financial Analysis Vector Icon Ppt PowerPoint Presentation Layouts File Formats Cpb
This is a histogram financial analysis vector icon ppt powerpoint presentation layouts file formats cpb. This is a three stage process. The stages in this process are bar chart icon, bar graph icon, data chart icon.
Three Bars For Financial Analysis Vector Icon Ppt PowerPoint Presentation Pictures Background Cpb
This is a three bars for financial analysis vector icon ppt powerpoint presentation pictures background cpb. This is a three stage process. The stages in this process are bar chart icon, bar graph icon, data chart icon.
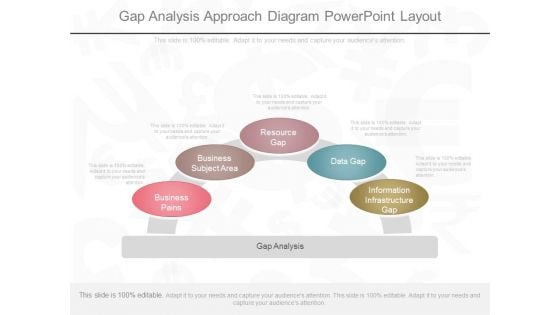
Gap Analysis Approach Diagram Powerpoint Layout
This is a gap analysis approach diagram powerpoint layout. This is a five stage process. The stages in this process are information infrastructure gap, data gap, resource gap, business subject area, business pains.
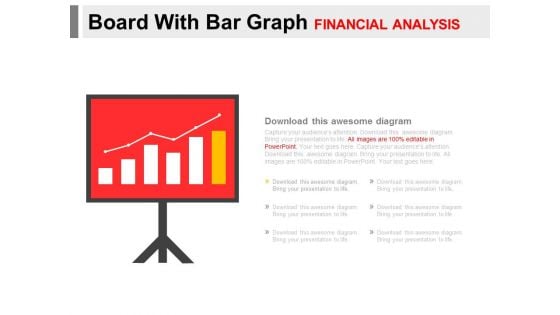
Board With Bar Graph For Financial Analysis Powerpoint Slides
You can download this PowerPoint template to display statistical data and analysis. This PPT slide contains display board with bar graph. Draw an innovative business idea using this professional diagram.
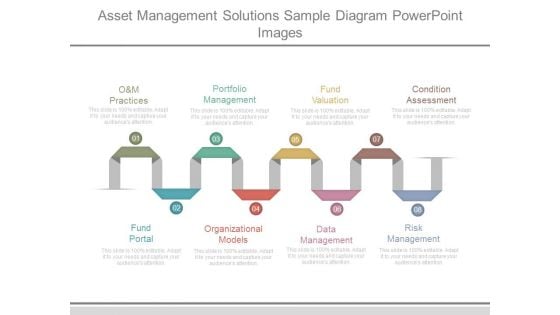
Asset Management Solutions Sample Diagram Powerpoint Images
This is a asset management solutions sample diagram powerpoint images. This is a eight stage process. The stages in this process are o and m practices, portfolio management, fund valuation, condition assessment, fund portal, organizational models, data management, risk management.
Four Colored Text Boxes With Icons Powerpoint Slides
This PowerPoint template has been designed with graphics of four text boxes. Download this PPT slide to display percentage data display. Use this professional template to build an exclusive presentation.
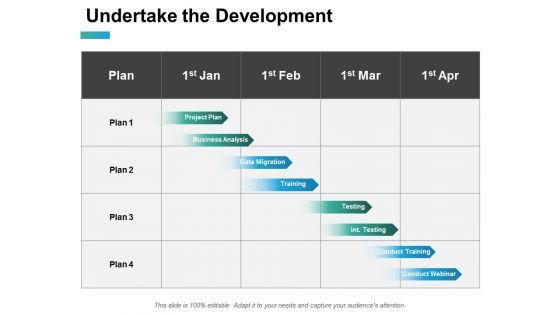
Undertake The Development Ppt PowerPoint Presentation Summary Guide
This is a undertake the development ppt powerpoint presentation summary guide. This is a four stage process. The stages in this process are project plan, business analysis, data migration, training, testing.
Procurement Steps Ppt PowerPoint Presentation Icon Objects
This is a procurement steps ppt powerpoint presentation icon objects. This is a six stage process. The stages in this process are understanding your goals, data analysis, beginning the pricing process, manage the pricing process, execution.
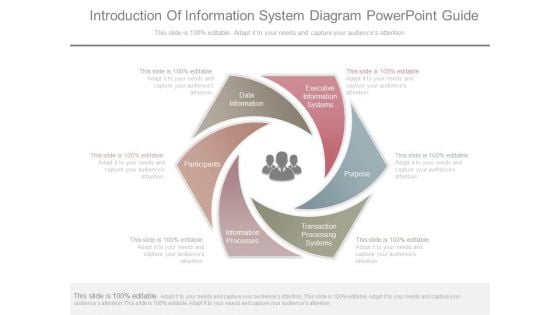
Introduction Of Information System Diagram Powerpoint Guide
This is a introduction of information system diagram powerpoint guide. This is a six stage process. The stages in this process are executive information systems, purpose, transaction processing systems, information processes, participants, data information.
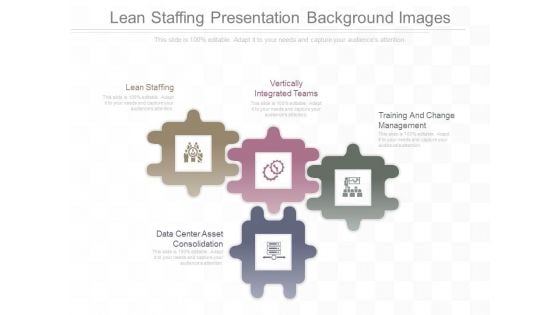
Lean Staffing Presentation Background Images
This is a lean staffing presentation background images. This is a four stage process. The stages in this process are lean staffing, vertically integrated teams, training and change management, data center asset consolidation.
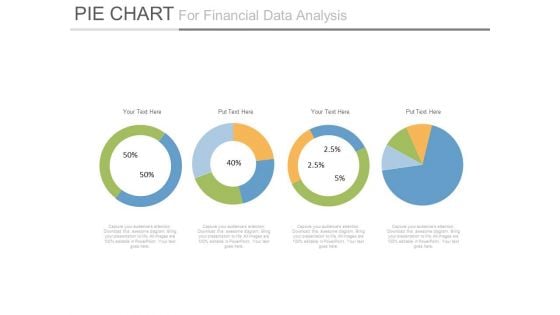
Pie Charts For Financial Ratio Analysis Powerpoint Slides
This PowerPoint template has been designed with diagram of pie charts. This PPT slide can be used to prepare presentations for profit growth report and also for financial data analysis. You can download finance PowerPoint template to prepare awesome presentations.
Consumer Insights Outline Ppt PowerPoint Presentation Icon Example File
This is a consumer insights outline ppt powerpoint presentation icon example file. This is a six stage process. The stages in this process are research methodology, key statistics, data collection, need for consumer insights.
Business Diagram Infographics Design With Six Options Presentation Template
Graphic of six staged info graphics has been used to design this power point template. This PPT diagram contains the concept of data flow and representation. Use this PPT for data technology related presentations.
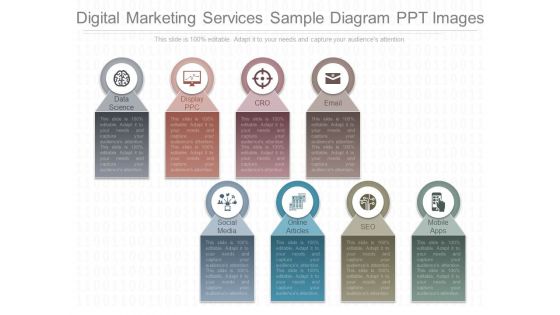
Digital Marketing Services Sample Diagram Ppt Images
This is a digital marketing services sample diagram ppt images. This is a eight stage process. The stages in this process are data science, display ppc, cro, email, social media, online articles, seo, mobile apps.
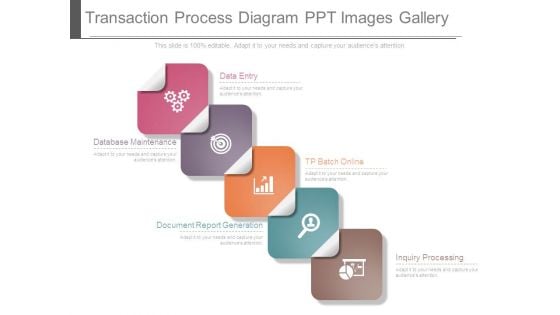
Transaction Process Diagram Ppt Images Gallery
This is a transaction process diagram ppt images gallery. This is a five stage process. The stages in this process are data entry, tp batch online, database maintenance, document report generation, inquiry processing.
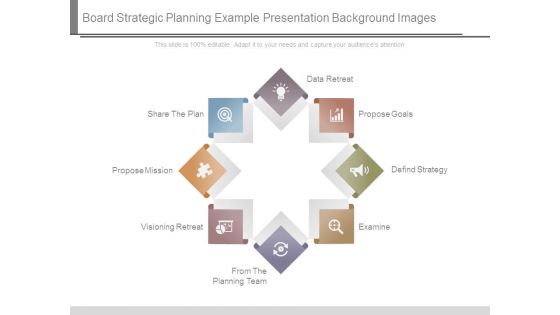
Board Strategic Planning Example Presentation Background Image
This is a board strategic planning example presentation background image. This is a eight stage process. The stages in this process are data retreat, propose goals, defind strategy, examine, share the plan, propose mission, visioning retreat, from the planning team.
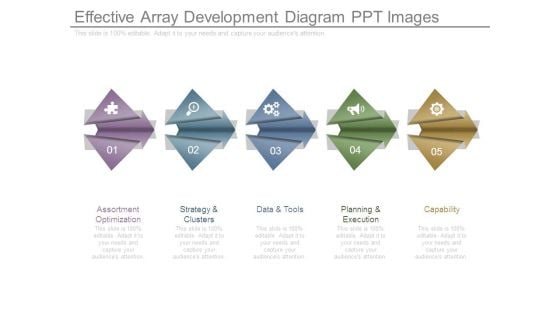
Effective Array Development Diagram Ppt Images
This is a effective array development diagram ppt images. This is a five stage process. The stages in this process are assortment optimization, strategy and clusters, data and tools, planning and execution, capability.
Point To Point Communication In Internet Web Ppt PowerPoint Presentation Icon Styles
This is a point to point communication in internet web ppt powerpoint presentation icon styles. This is a five stage process. The stages in this process are data feed, web feed, information feed.
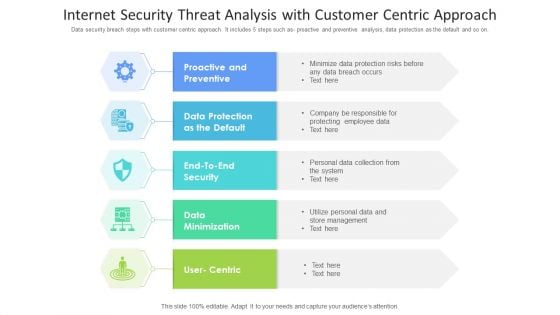
Internet Security Threat Analysis With Customer Centric Approach Mockup PDF
Data security breach steps with customer centric approach. It includes 5 steps such as- proactive and preventive analysis, data protection as the default and so on. Showcasing this set of slides titled internet security threat analysis with customer centric approach mockup pdf. The topics addressed in these templates are data minimization, data protection, proactive and preventive. All the content presented in this PPT design is completely editable. Download it and make adjustments in color, background, font etc. as per your unique business setting.
Five Business Options Representation With Icons Ppt Powerpoint Presentation Portfolio Aids
This is a five business options representation with icons ppt powerpoint presentation portfolio aids. This is a five stage process. The stages in this process are data presentation, content presentation, information presentation.
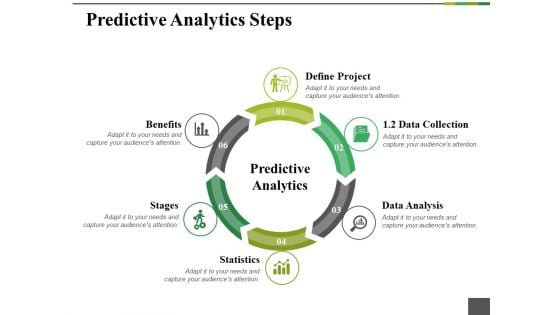
Predictive Analytics Steps Ppt PowerPoint Presentation Portfolio Template
This is a predictive analytics steps ppt powerpoint presentation portfolio template. This is a six stage process. The stages in this process are define project, benefits, stages, statistics, data analysis.

Business Framework Cascading Placement Style For Strategy Map PowerPoint Presentation
This exclusive Power point slide template has been crafted with graphic of two foot prints. This graphic contains the text boxes to display and highlight important data. Use this PPT slide for your business data representation
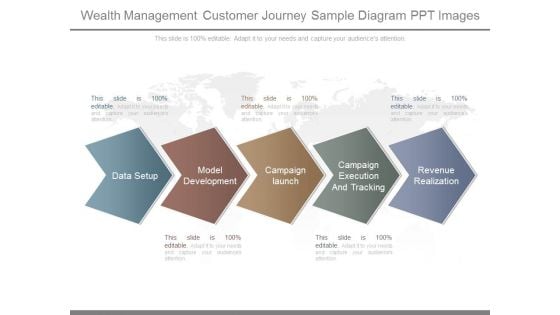
Wealth Management Customer Journey Sample Diagram Ppt Images
This is a wealth management customer journey sample diagram ppt images. This is a five stage process. The stages in this process are data setup, model development, campaign launch, campaign execution and tracking, revenue realization.
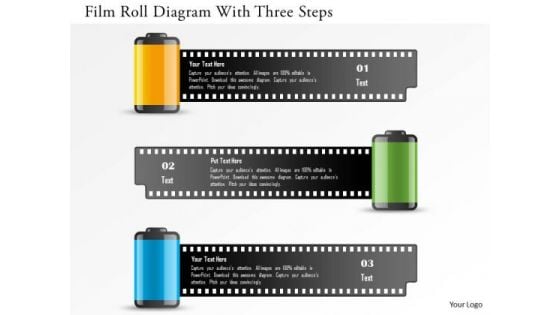
Business Diagram Film Roll Diagram With Three Steps Presentation Template
This power point template has been crafted with graphic of three film roll graphics. This PPT contains the concept of data flow. Use this PPT for your data related presentations.

Business Interrelationship Graphic Design Powerpoint Presentation Examples
This is a business interrelationship graphic design powerpoint presentation examples. This is a six stage process. The stages in this process are data integration, performance management, sales, accounting, assemble product, decision support systems.
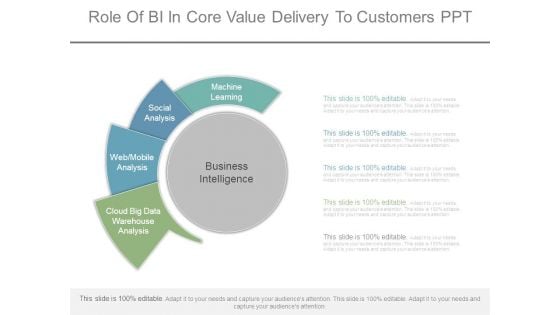
Role Of Bi In Core Value Delivery To Customers Ppt
This is a role of bi in core value delivery to customers ppt. This is a five stage process. The stages in this process are business intelligence, machine learning, social analysis, web mobile analysis, cloud big data warehouse analysis.
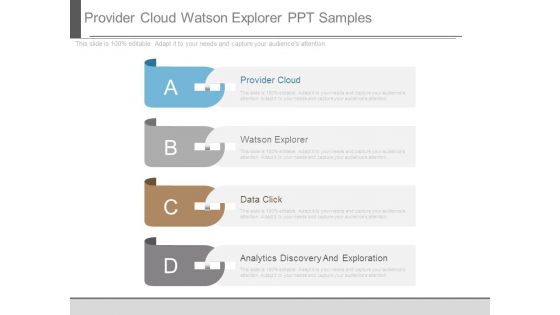
Provider Cloud Watson Explorer Ppt Samples
This is a provider cloud watson explorer ppt samples. This is a four stage process. The stages in this process are provider cloud, watson explorer, data click, analytics discovery and exploration.
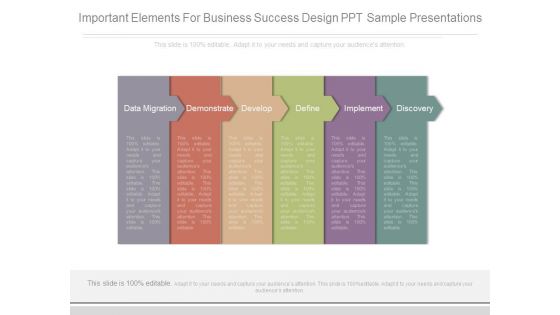
Important Elements For Business Success Design Ppt Sample Presentations
This is a important elements for business success design ppt sample presentations. This is a six stage process. The stages in this process are data migration, demonstrate, develop, define, implement, discovery.
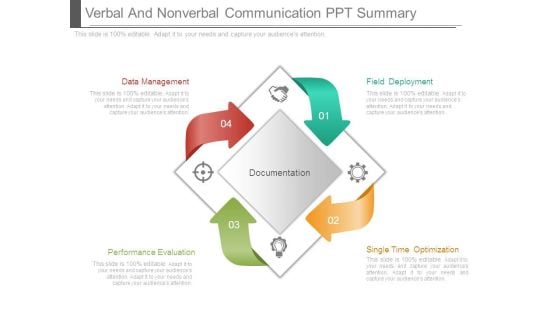
Verbal And Nonverbal Communication Ppt Summary
This is a verbal and nonverbal communication ppt summary. This is a four stage process. The stages in this process are data management, performance evaluation, single time optimization, field deployment, documentation.
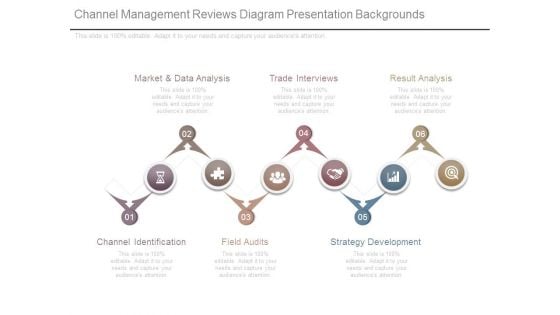
Channel Management Reviews Diagram Presentation Backgrounds
This is a channel management reviews diagram presentation backgrounds. This is a six stage process. The stages in this process are channel identification, market and data analysis, trade interviews, result analysis, strategy development, field audits.
Stock Photo Small And Big Cubes For Text Representation PowerPoint Slide
This Power Point template has been crafted with graphic of cubes. This image slide contains the concept data representations. Use this editable image slide for your business and marketing related topics and to impress your viewers.
Ladder With Icons For Financial Growth And Success Powerpoint Template
Our above slide contains graphics of ladder with icons. This PowerPoint template helps to display financial growth and success. Use this diagram to impart more clarity to data and to create more sound impact on viewers.
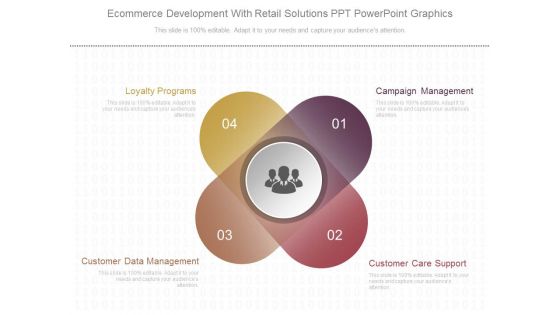
Ecommerce Development With Retail Solutions Ppt Powerpoint Graphics
This is a ecommerce development with retail solutions ppt powerpoint graphics. This is a four stage process. The stages in this process are loyalty programs, campaign management, customer data management, customer care support.\n\n\n\n\n\n
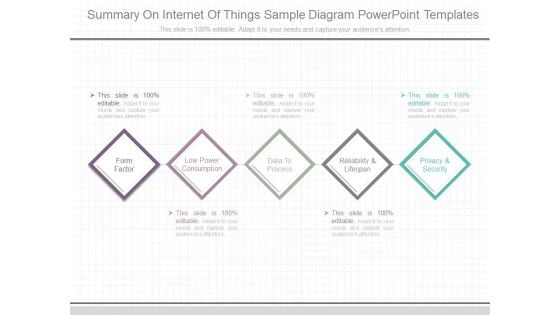
Summary On Internet Of Things Sample Diagram Powerpoint Templates
This is a summary on internet of things sample diagram powerpoint templates. This is a five stage process. The stages in this process are form factor, low power consumption, data to process, reliability and lifespan, privacy and security.


 Continue with Email

 Home
Home


