Data Visualization
Curve Line Diagram With Icons Powerpoint Template
Our above slide contains diagram of curve line infographic. This infographic slide helps to exhibit business analysis. Use this diagram to impart more clarity to data and to create more sound impact on viewers.
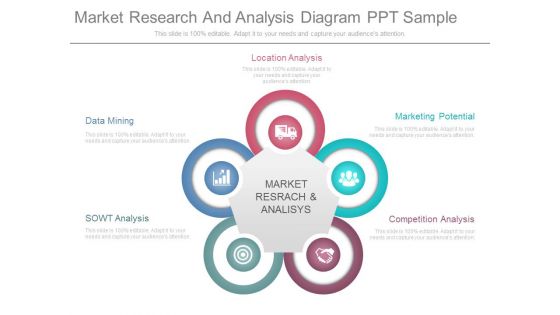
Market Research And Analysis Diagram Ppt Sample
This is a market research and analysis diagram ppt sample. This is a five stage process. The stages in this process are location analysis, data mining, sowt analysis, market research and analysis, competition analysis, marketing potential.
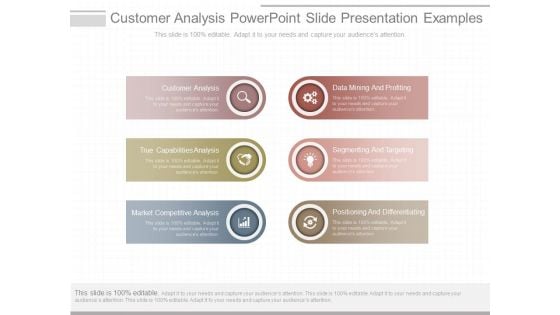
Customer Analysis Powerpoint Slide Presentation Examples
This is a customer analysis powerpoint slide presentation examples. This is a six stage process. The stages in this process are customer analysis, true capabilities analysis, market competitive analysis, data mining and profiting, segmenting and targeting, positioning and differentiating.
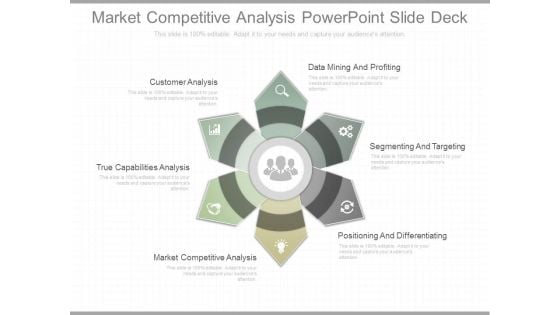
Market Competitive Analysis Powerpoint Slide Deck
This is a market competitive analysis powerpoint slide deck. This is a six stage process. The stages in this process are customer analysis, true capabilities analysis, market competitive analysis, positioning and differentiating, segmenting and targeting, data mining and profiting.
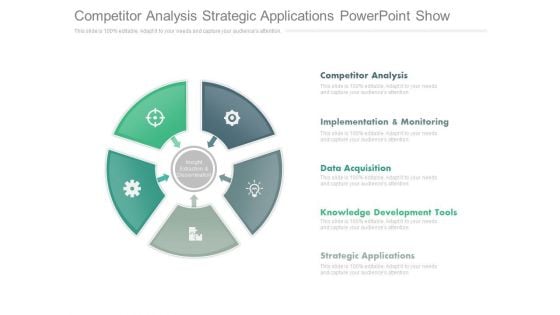
Competitor Analysis Strategic Applications Powerpoint Show
This is a competitor analysis strategic applications powerpoint show. This is a five stage process. The stages in this process are competitor analysis, implementation & monitoring, data acquisition, knowledge development tools, strategic applications.
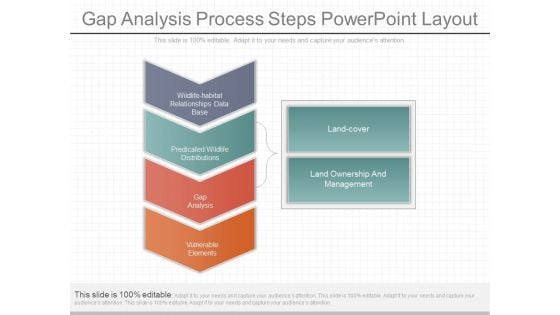
Gap Analysis Process Steps Powerpoint Layout
This is a gap analysis process steps powerpoint layout. This is a six stage process. The stages in this process are wildlife habitat relationships data base, predicated wildlife distributions, gap analysis, vulnerable elements, land cover, land ownership and management.
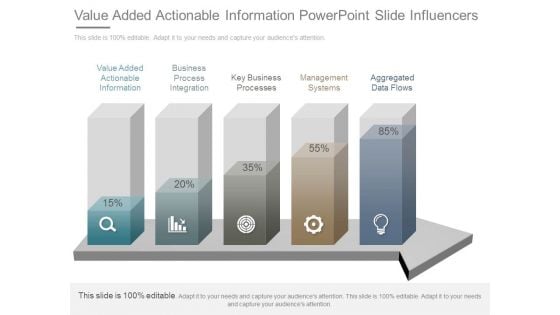
Value Added Actionable Information Powerpoint Slide Influencers
This is a value added actionable information powerpoint slide influencers. This is a five stage process. The stages in this process are value added actionable information, business process integration, key business processes , management systems, aggregated data flows.
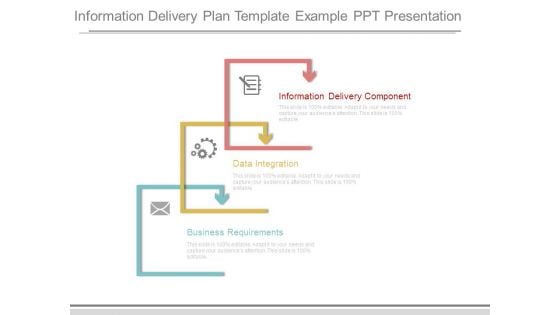
Information Delivery Plan Template Example Ppt Presentation
This is a information delivery plan template example ppt presentation. This is a three stage process. The stages in this process are information delivery component, data integration, business requirements.
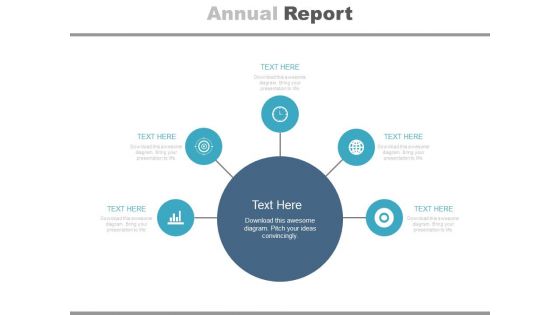
Diagram For Market Research Analysis Powerpoint Slides
This PowerPoint template has been designed with circular infographic diagram. It can be used to display steps for market research and also for financial data analysis. You can download finance PowerPoint template to prepare awesome presentations.
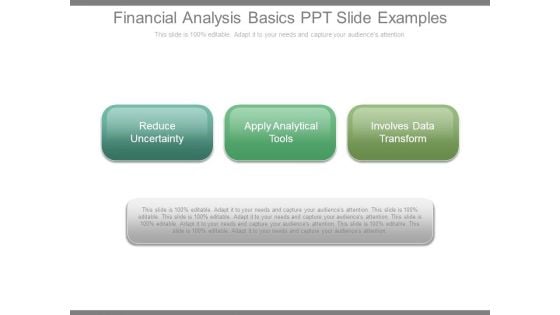
Financial Analysis Basics Ppt Slide Examples
This is a financial analysis basics ppt slide examples. This is a three stage process. The stages in this process are reduce uncertainty, apply analytical tools, involves data transform.
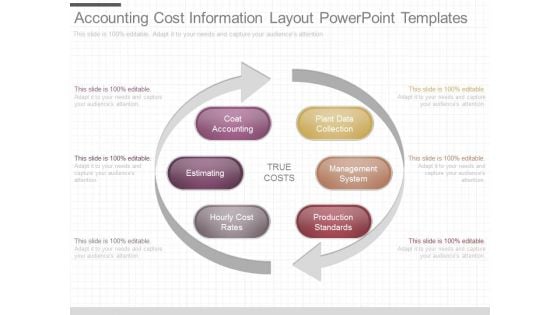
Accounting Cost Information Layout Powerpoint Templates
This is a accounting cost information layout powerpoint templates. This is a six stage process. The stages in this process are true costs, coat accounting, estimating, hourly cost rates, plant data collection, management system, production standards.

Technical Specifications Powerpoint Slide Presentation Tips
This is a technical specifications powerpoint slide presentation tips. This is a seven stage process. The stages in this process are discovery planning and development, project brief, user profiles, assets inventory, technical specifications, data entry.
Six Staged Infographics Square With Business Icons Powerpoint Templates
This business diagram displays circular puzzle infographic. This editable slide is suitable to present global communication. Use this diagram for business and finance related topics and display complete data analysis in your presentation.
Four Circles Venn Diagram With Icons Powerpoint Slides
Four circles Venn diagram has been used to design this power point template. This PPT helps to portray the concept of business data analysis. Use this PPT for your business and marketing related presentations.
Two Circles Venn Diagram With Icons Powerpoint Slides
Venn diagram of two circles has been used to design this power point template. This PPT helps to portray the concept of business data analysis. Use this PPT for your business and marketing related presentations.
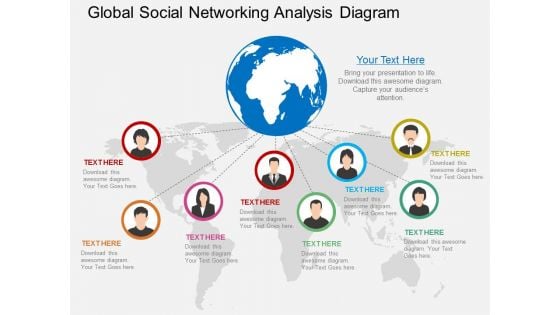
Global Social Networking Analysis Diagram Powerpoint Template
Our above PowerPoint slide contains diagram of globe with people pictures. Download this business slide to illustrate social networking. Use this diagram to impart more clarity to data and to create more sound impact on viewers.
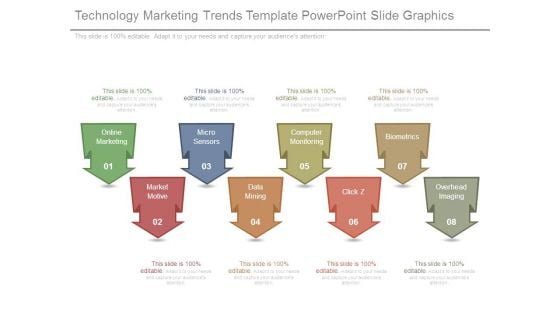
Technology Marketing Trends Template Powerpoint Slide Graphics
This is a technology marketing trends template powerpoint slide graphics. This is a eight stage process. The stages in this process are online marketing, market motive, micro sensors, data mining, computer monitoring, click z, biometrics, overhead imaging.
Consumer Insight Capabilities Ppt PowerPoint Presentation Icon Graphics
This is a consumer insight capabilities ppt powerpoint presentation icon graphics. This is a six stage process. The stages in this process are business support services, business intelligence services, research services, data management services, insight services.
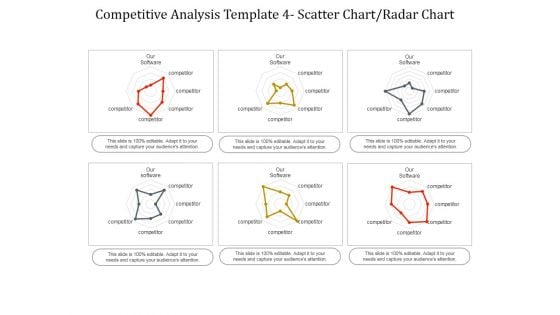
Competitive Analysis Scatter Chart Radar Chart Ppt PowerPoint Presentation Infographics
This is a competitive analysis scatter chart radar chart ppt powerpoint presentation infographics. This is a eight stage process. The stages in this process are users interface, data import, example, pricing, support, update, tutorials, easy to use.
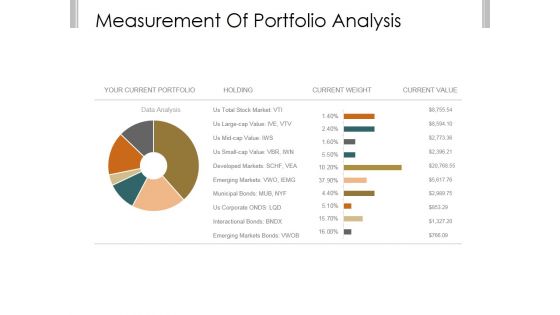
Measurement Of Portfolio Analysis Ppt PowerPoint Presentation Clipart
This is a measurement of portfolio analysis ppt powerpoint presentation clipart. This is a two stage process. The stages in this process are your current portfolio, holding, current weight, current value, data analysis.
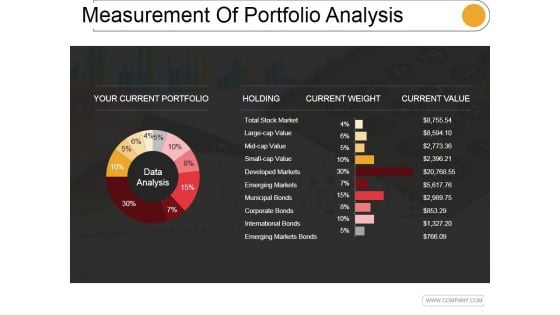
Measurement Of Portfolio Analysis Ppt PowerPoint Presentation Topics
This is a measurement of portfolio analysis ppt powerpoint presentation topics. This is a ten stage process. The stages in this process are data analysis, holding, current weight, current value.
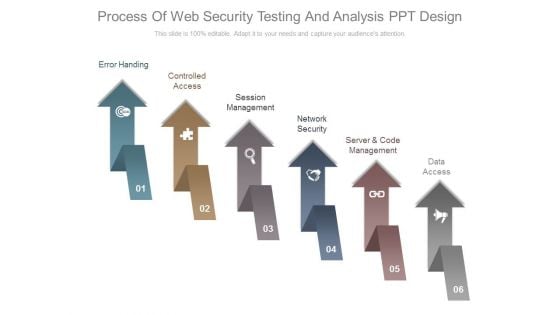
Process Of Web Security Testing And Analysis Ppt Design
This is a process of web security testing and analysis ppt design. This is a six stage process. The stages in this process are error handing, controlled access, session management, network security, server and code management, data access.
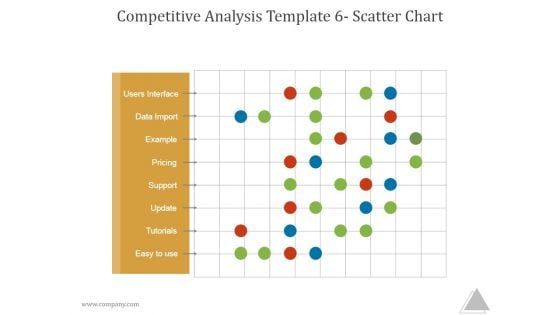
Competitive Analysis Template 6 Scatter Chart Ppt PowerPoint Presentation Shapes
This is a competitive analysis template 6 scatter chart ppt powerpoint presentation shapes. This is a one stage process. The stages in this process are users interface, data import, example, pricing, support update, tutorials, easy to use.
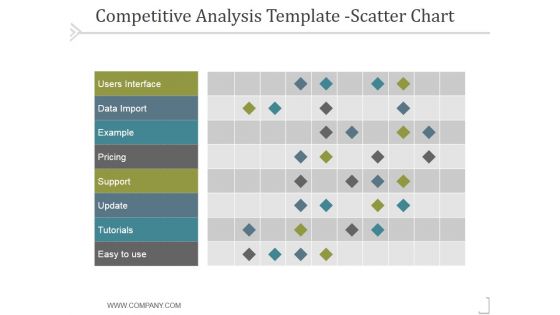
Competitive Analysis Scatter Chart Template 2 Ppt PowerPoint Presentation Files
This is a competitive analysis scatter chart template 2 ppt powerpoint presentation files. This is a nine stage process. The stages in this process are users interface, data import, example, pricing, support, update.
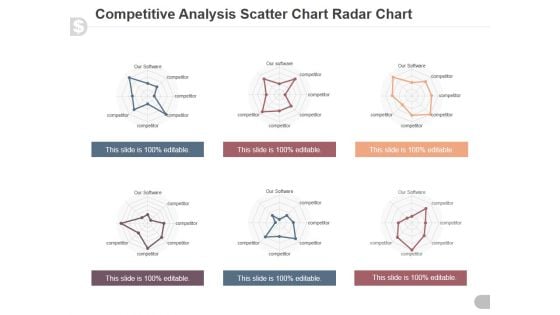
Competitive Analysis Scatter Chart Radar Chart Ppt PowerPoint Presentation Model
This is a competitive analysis scatter chart radar chart ppt powerpoint presentation model. This is a eight stage process. The stages in this process are users interface, data import, example, pricing, support, update, tutorials, easy to use.
Illustration For Business Steps With Icons Powerpoint Template
Our above PowerPoint slide contains graphics of four text boxes with icons. Download this business slide to illustrate four business steps. Use this diagram to impart more clarity to data and to create more sound impact on viewers.
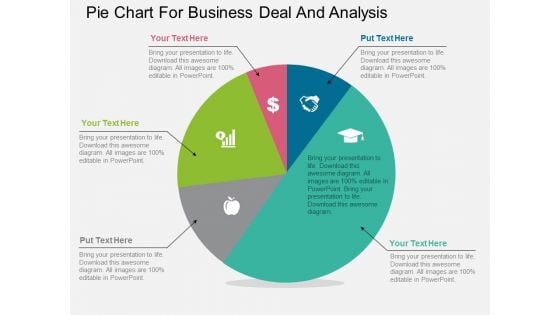
Pie Chart For Business Deal And Analysis Powerpoint Template
Our above PPT slide contains diagram of pentagon infographic. It helps to display steps of corporate marketing. Use this diagram to impart more clarity to data and to create more sound impact on viewers.
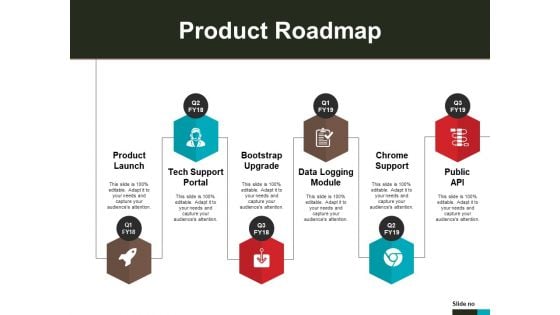
Product Roadmap Template 2 Ppt PowerPoint Presentation Infographic Template Information
This is a product roadmap template 2 ppt powerpoint presentation infographic template information. This is a six stage process. The stages in this process are product launch, tech support portal, bootstrap upgrade, data logging module, chrome support.
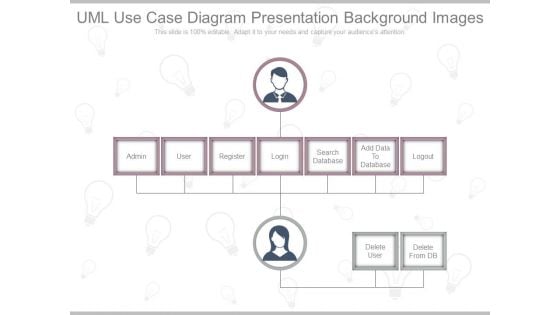
Uml Use Case Diagram Presentation Background Images
This is a uml use case diagram presentation background images. This is a seven stage process. The stages in this process are admin, user, register, login, search database, add data to database, logout.
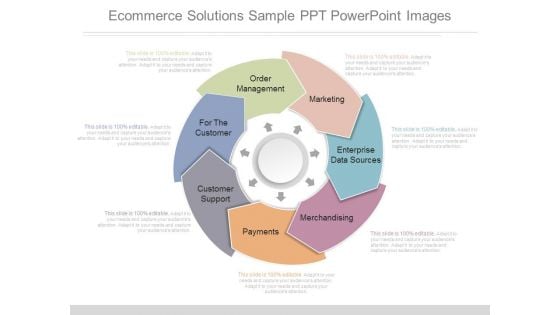
Ecommerce Solutions Sample Ppt Powerpoint Images
This is a ecommerce solutions sample ppt powerpoint images. This is a seven stage process. The stages in this process are order management, for the customer, customer support, payments, merchandising, enterprise data sources, marketing.
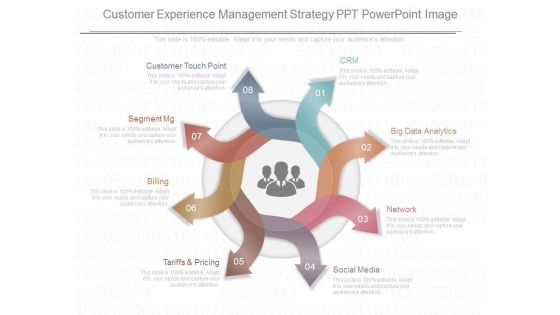
Customer Experience Management Strategy Ppt Powerpoint Image
This is a customer experience management strategy ppt powerpoint image. This is a eight stage process. The stages in this process are customer touch point, segment mg, billing, tariffs and pricing, social media, network, big data analytics, crm.
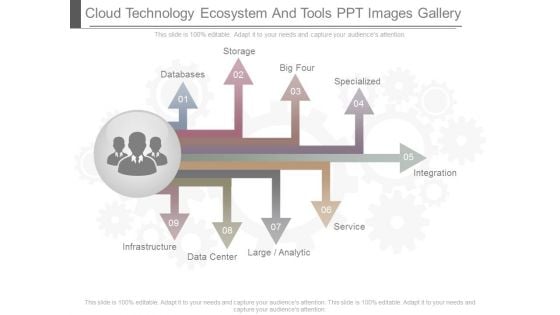
Cloud Technology Ecosystem And Tools Ppt Images Gallery
This is a cloud technology ecosystem and tools ppt images gallery. This is a nine stage process. The stages in this process are databases, storage, big four, specialized, infrastructure, data center, large analytic, service.
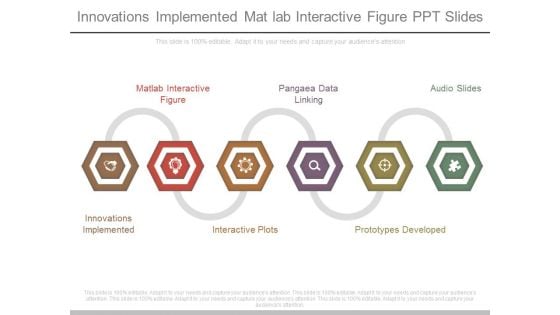
Innovations Implemented Mat Lab Interactive Figure Ppt Slides
This is a innovations implemented mat lab interactive figure ppt slides. This is a six stage process. The stages in this process are mat lab interactive figure, pangaea data linking, audio slides, innovations implemented, interactive plots, prototypes developed.
Colorful Bulb With Three Icons Powerpoint Templates
This PowerPoint slide contains graphics of bulb diagram with icons. It helps to exhibit concepts of sales planning. Use this diagram to impart more clarity to data and to create more sound impact on viewers.
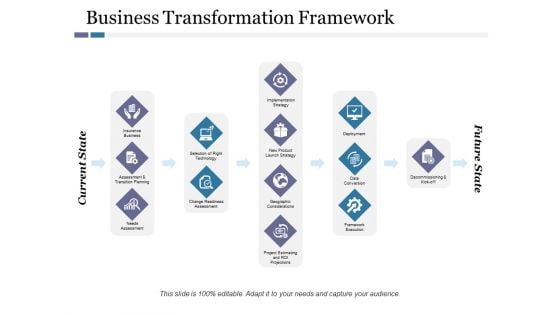
Business Transformation Framework Ppt PowerPoint Presentation Gallery Summary
This is a business transformation framework ppt powerpoint presentation gallery summary. This is a five stage process. The stages in this process are implementation strategy, new product launch strategy, selection of right technology, deployment, data conversion, framework execution.
Four Tags With Mobile And Icons Powerpoint Template
Our above PPT slide contains graphics mobile with four tags and icons. This business diagram helps to display technology and communication concepts. Use this template to impart more clarity to data and to create more sound impact on viewers.
Profit Growth Bars With Icons And Mouse Powerpoint Template
Our above slide contains graphics of profit growth bars with icons. This PowerPoint template helps to display outline of business plan. Use this diagram to impart more clarity to data and to create more sound impact on viewers.
Cloud Icons With Paper Clips PowerPoint Template
Visually support your presentation with our above template showing cloud icons with paper clips. This slide has been professionally designed to portray concepts like cloud computing and data storage. This template offers an excellent background to build impressive presentation.
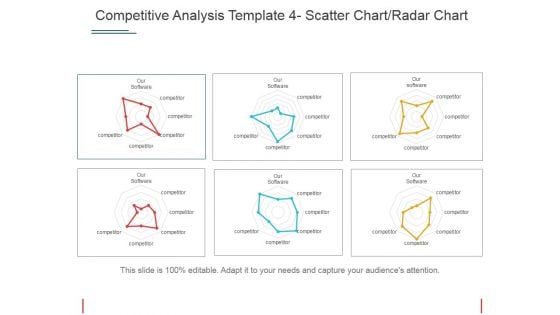
Competitive Analysis Scatter Chart Radar Chart Ppt PowerPoint Presentation Portfolio Templates
This is a competitive analysis scatter chart radar chart ppt powerpoint presentation portfolio templates. This is a eight stage process. The stages in this process are users interface, data import, example, pricing, support.
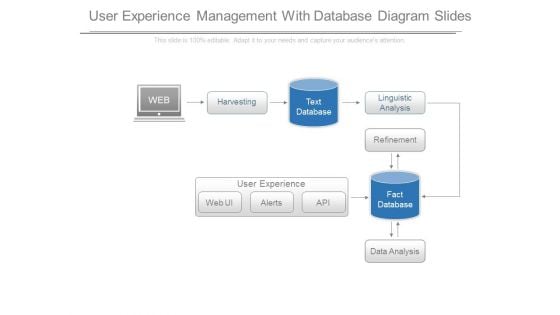
User Experience Management With Database Diagram Slides
This is a user experience management with database diagram slides. This is a six stage process. The stages in this process are web, harvesting, text database, linguistic analysis, refinement, fact database, data analysis, web ui, alerts, api, user experience.
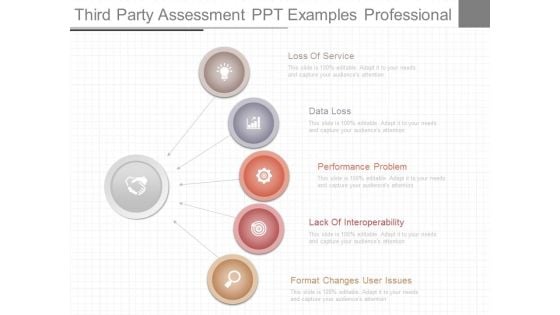
Third Party Assessment Ppt Examples Professional
This is a Third Party Assessment Ppt Examples Professional. This is a five stage process. The stages in this process are data loss, performance problem, lack of interoperability, format changes user issues.
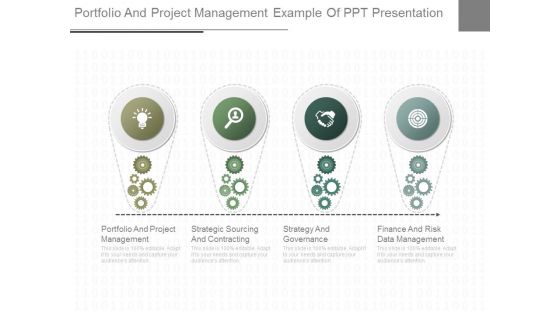
Portfolio And Project Management Example Of Ppt Presentation
This is a portfolio and project management example of ppt presentation. This is a four stage process. The stages in this process are portfolio and project management, strategic sourcing and contracting, strategy and governance, finance and risk data management.
Voice Of The Customer Six Sigma Diagram Ppt Images
This is a voice of the customer six sigma diagram ppt images. This is a five stage process. The stages in this process are groups, warranty, metrics, data returns, survey, voice of customer.
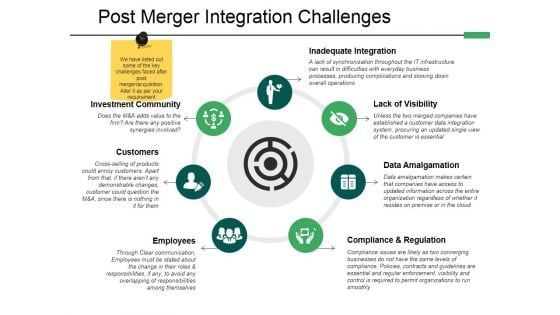
Post Merger Integration Challenges Ppt PowerPoint Presentation Layouts Images
This is a post merger integration challenges ppt powerpoint presentation layouts images. This is a seven stage process. The stages in this process are customers, employees, lack of visibility, data amalgamation, compliance regulation.
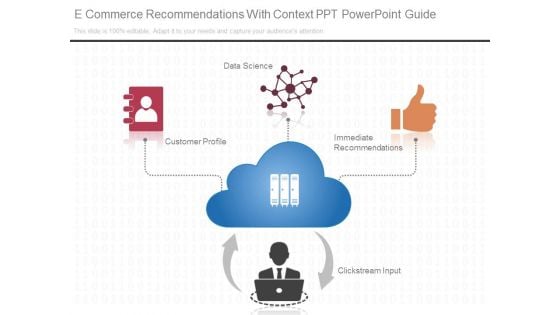
E Commerce Recommendations With Context Ppt Powerpoint Guide
This is a e commerce recommendations with context ppt powerpoint guide. This is a four stage process. The stages in this process are data science, customer profile, immediate recommendations, clickstream input.
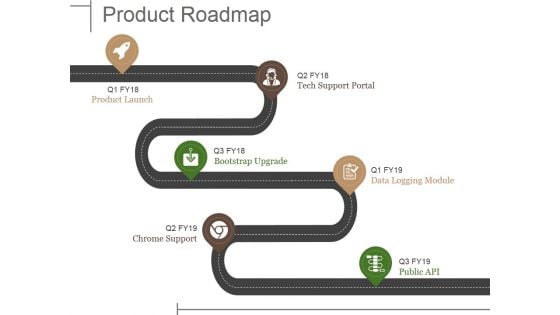
Product Roadmap Ppt PowerPoint Presentation Ideas Graphics
This is a product roadmap ppt powerpoint presentation ideas graphics. This is a six stage process. The stages in this process are product launch, bootstrap upgrade, chrome support, tech support portal, data logging module.
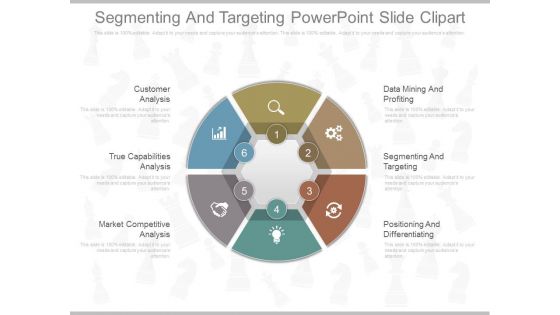
Segmenting And Targeting Powerpoint Slide Clipart
This is a segmenting and targeting powerpoint slide clipart. This is a six stage process. The stages in this process are data mining and profiting, segmenting and targeting, positioning and differentiating, market competitive analysis, true capabilities analysis, customer analysis.
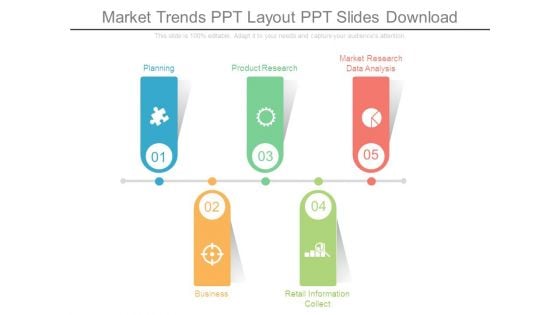
Market Trends Ppt Layout Ppt Slides Download
This is a market trends ppt layout ppt slides download. This is a five stage process. The stages in this process are planning, business, product research, retail information collect, market research data analysis.
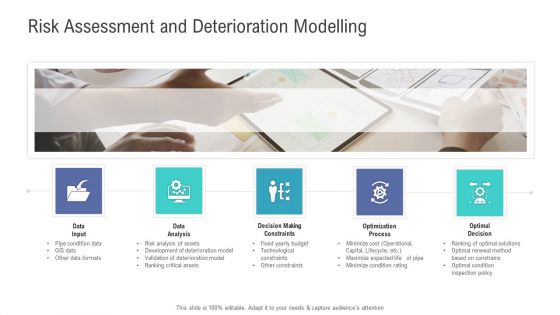
Financial Functional Assessment Risk Assessment And Deterioration Modelling Information PDF
This is a financial functional assessment risk assessment and deterioration modelling information pdf template with various stages. Focus and dispense information on five stages using this creative set, that comes with editable features. It contains large content boxes to add your information on topics like data input, data analysis, decision making constraints, optimization process, optimal decision. You can also showcase facts, figures, and other relevant content using this PPT layout. Grab it now.
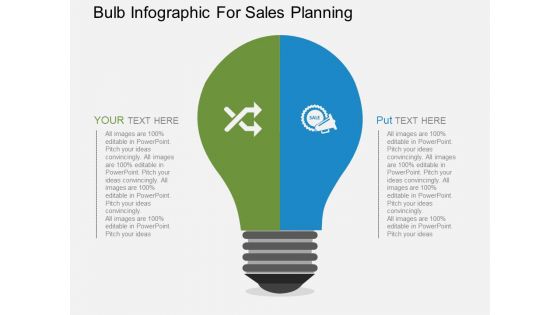
Bulb Infographic For Sales Planning Powerpoint Templates
This PowerPoint slide contains graphics of bulb diagram with icons. It helps to exhibit concepts of sales planning. Use this diagram to impart more clarity to data and to create more sound impact on viewers.
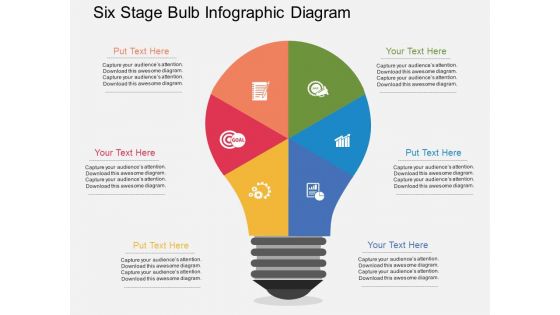
Six Stage Bulb Infographic Diagram Powerpoint Templates
This PowerPoint slide contains graphics of bulb diagram with icons. It helps to exhibit concepts of marketing strategy. Use this diagram to impart more clarity to data and to create more sound impact on viewers.
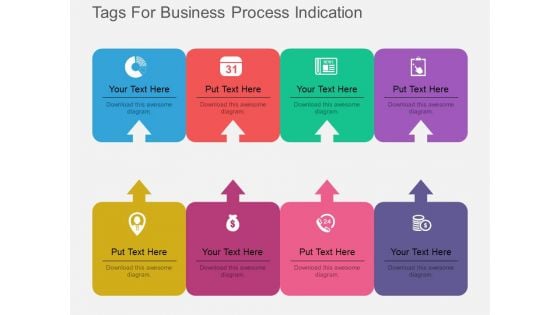
Eight Tags For Business Process Indication Powerpoint Template
Our above PPT slide contains graphics of eight text tags with icons. This PowerPoint template may be used to display business process steps. Use this diagram to impart more clarity to data and to create more sound impact on viewers.
Facility Management Risk Assessment And Deterioration Modelling Ppt Icon Images PDF
This is a facility management risk assessment and deterioration modelling ppt icon images pdf template with various stages. Focus and dispense information on five stages using this creative set, that comes with editable features. It contains large content boxes to add your information on topics like data input, data analysis, decision making constraints, optimization process, optimal decision. You can also showcase facts, figures, and other relevant content using this PPT layout. Grab it now.

Unified Security Management Ppt Template Example Of Ppt Presentation
This is a unified security management ppt template example of ppt presentation. This is a four stage process. The stages in this process are assess the network, find threats, data loss prevention, gateway anti virus.

Product Roadmap Template Ppt PowerPoint Presentation Summary Files
This is a product roadmap template ppt powerpoint presentation summary files. This is a six stage process. The stages in this process are product launch, tech support portal, bootstrap upgrade, data logging module, chrome support.
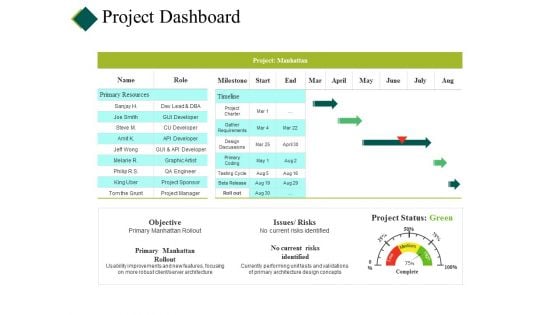
Project Dashboard Ppt PowerPoint Presentation Pictures Backgrounds
This is a project dashboard ppt powerpoint presentation pictures backgrounds. This is a four stage process. The stages in this process are cost, planning, table, project report, data management.
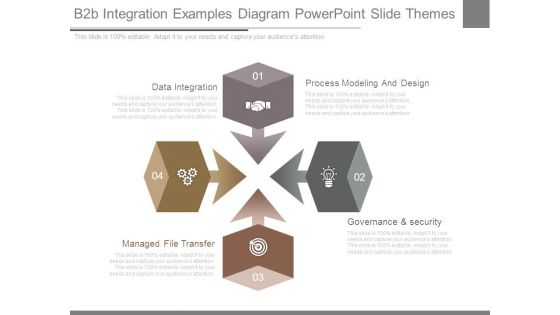
B2b Integration Examples Diagram Powerpoint Slide Themes
This is a b2b integration examples diagram powerpoint slide themes. This is a four stage process. The stages in this process are data integration, process modeling and design, governance and security, managed file transfer.
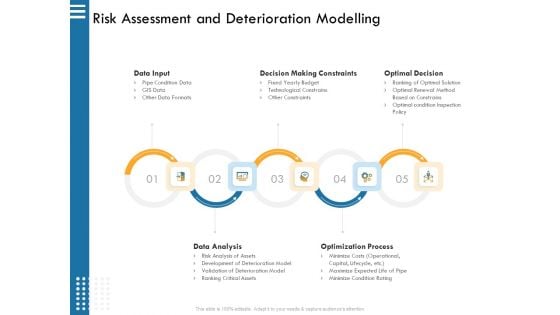
IT Infrastructure Governance Risk Assessment And Deterioration Modelling Ppt Pictures Show PDF
This is a it infrastructure governance risk assessment and deterioration modelling ppt pictures show pdf. template with various stages. Focus and dispense information on five stages using this creative set, that comes with editable features. It contains large content boxes to add your information on topics like data input, decision making constraints, optimal decision, optimization process, data analysis. You can also showcase facts, figures, and other relevant content using this PPT layout. Grab it now.
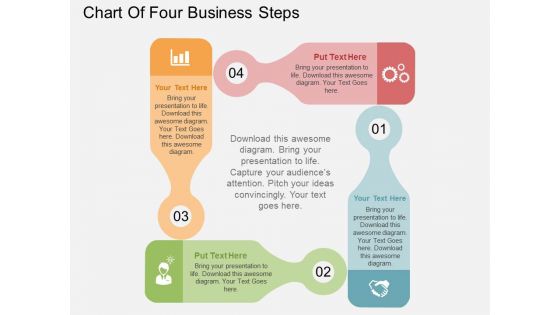
Chart Of Four Business Steps Powerpoint Templates
This business diagram displays flow of four business steps. This editable slide is suitable to present growth management. Use this diagram for business and finance related topics and display complete data analysis in your presentation.
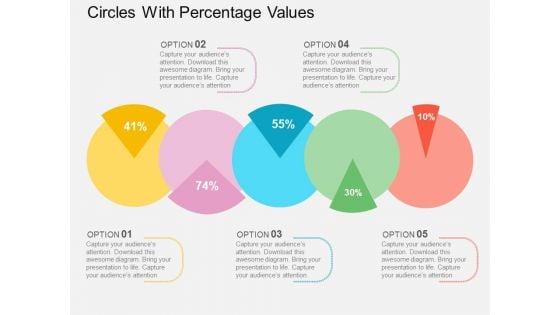
Circles With Percentage Values Powerpoint Templates
This PowerPoint template displays circles with percentage values. This business diagram is suitable for financial data analysis. Use this business diagram slide to highlight the key issues of your presentation.


 Continue with Email

 Home
Home


