Employee Onboarding Dashboard
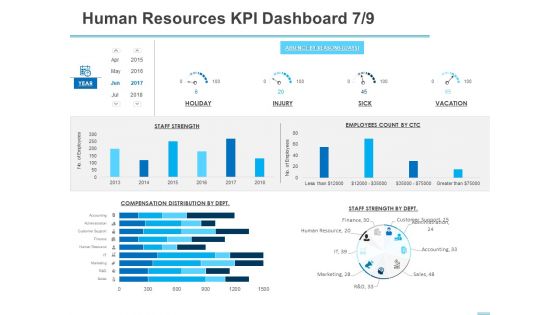
All About HRM Human Resources KPI Dashboard Marketing Ppt Portfolio Graphics Template PDF
Presenting this set of slides with name all about hrm human resources kpi dashboard marketing ppt portfolio graphics template pdf. The topics discussed in these slides are strength, finance, sales, marketing, accounting. This is a completely editable PowerPoint presentation and is available for immediate download. Download now and impress your audience.
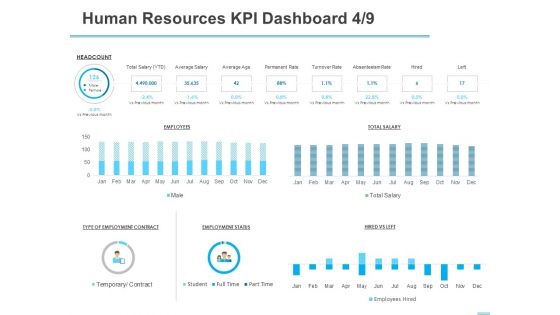
All About HRM Human Resources KPI Dashboard Permanent Ppt Information PDF
Presenting this set of slides with name all about hrm human resources kpi dashboard permanent ppt information pdf. The topics discussed in these slides are average salary, permanent rate. This is a completely editable PowerPoint presentation and is available for immediate download. Download now and impress your audience.
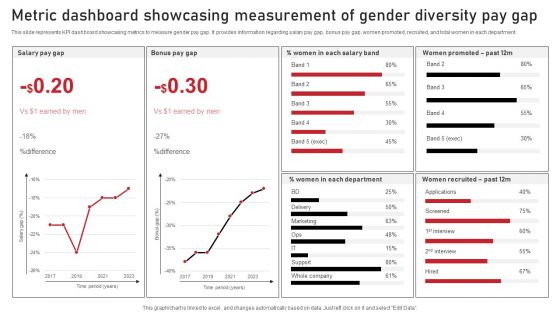
Metric Dashboard Showcasing Measurement Of Gender Diversity Pay Gap Sample PDF
This slide represents KPI dashboard showcasing metrics to measure gender pay gap. It provides information regarding salary pay gap, bonus pay gap, women promoted, recruited, and total women in each department. Pitch your topic with ease and precision using this Metric Dashboard Showcasing Measurement Of Gender Diversity Pay Gap Sample PDF. This layout presents information on Marketing, Screened, Delivery. It is also available for immediate download and adjustment. So, changes can be made in the color, design, graphics or any other component to create a unique layout.
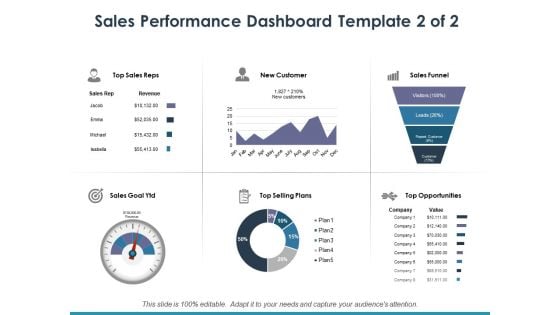
Sales Performance Dashboard Template 2 Ppt PowerPoint Presentation Infographic Template Clipart
This is a sales performance dashboard template 2 ppt powerpoint presentation infographic template clipart. This is a six stage process. The stages in this process are top sales reps, new customer, sales funnel, top selling plans, top opportunities.
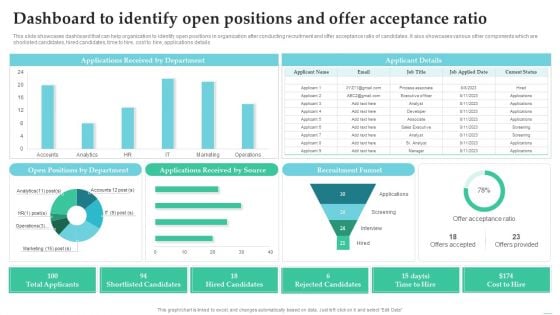
Employing Candidate Using Internal And External Mediums Of Recruitment Dashboard To Identify Open Positions Microsoft PDF
This slide showcases dashboard that can help organization to identify open positions in organization after conducting recruitment and offer acceptance ratio of candidates. It also showcases various other components which are shorlisted candidates, hired candidates, time to hire, cost to hire, applications details. Present like a pro with Employing Candidate Using Internal And External Mediums Of Recruitment Dashboard To Identify Open Positions Microsoft PDF Create beautiful presentations together with your team, using our easy to use presentation slides. Share your ideas in real time and make changes on the fly by downloading our templates. So whether you are in the office, on the go, or in a remote location, you can stay in sync with your team and present your ideas with confidence. With Slidegeeks presentation got a whole lot easier. Grab these presentations today.
Dashboard For Analyzing IT Hiring Status Ppt PowerPoint Presentation Icon Slides PDF
This slide defines the analysis dashboard for information technology IT recruitment status. It includes information related to technical and non- technical hiring, hiring pipeline, etc. Showcasing this set of slides titled Dashboard For Analyzing IT Hiring Status Ppt PowerPoint Presentation Icon Slides PDF. The topics addressed in these templates are Current Hiring Pipeline, Recruitment Costs YTD, Acceptance Rate. All the content presented in this PPT design is completely editable. Download it and make adjustments in color, background, font etc. as per your unique business setting.
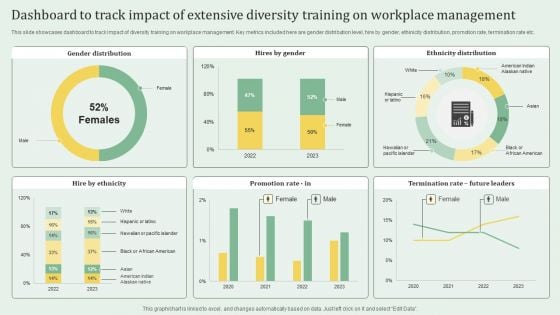
Dashboard To Track Impact Of Extensive Diversity Training On Workplace Management Portrait PDF
This slide showcases dashboard to track impact of diversity training on workplace management. Key metrics included here are gender distribution level, hire by gender, ethinicity distribution, promotion rate, termination rate etc. Pitch your topic with ease and precision using this Dashboard To Track Impact Of Extensive Diversity Training On Workplace Management Portrait PDF. This layout presents information on Dashboard To Track Impact, Extensive Diversity Training, Workplace Management. It is also available for immediate download and adjustment. So, changes can be made in the color, design, graphics or any other component to create a unique layout.

KPI Analytics Dashboard With Sourcing Raw Material Cycle Time Inspiration PDF
Following slide shows the key performance indicator KPI dashboard which will assist corporates to effectively monitor procurement process. The metrics are number of suppliers, contract compliance, average procurement cycle time, etc. Showcasing this set of slides titled KPI Analytics Dashboard With Sourcing Raw Material Cycle Time Inspiration PDF. The topics addressed in these templates are Kpi Analytics Dashboard, Sourcing Raw Material, Cycle Time. All the content presented in this PPT design is completely editable. Download it and make adjustments in color, background, font etc. as per your unique business setting.
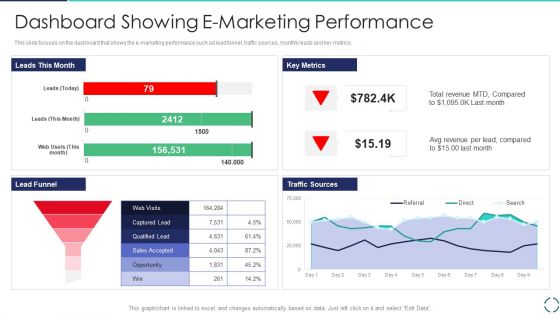
Optimizing E Business Promotion Plan Dashboard Showing E Marketing Performance Ideas PDF
This slide focuses on the dashboard that shows the e-marketing performance such ad lead funnel, traffic sources, monthly leads and key metrics. Deliver an awe inspiring pitch with this creative Optimizing E Business Promotion Plan Dashboard Showing E Marketing Performance Ideas PDF bundle. Topics like Lead Funnel, Key Metrics, Traffic Sources can be discussed with this completely editable template. It is available for immediate download depending on the needs and requirements of the user.

Organizational Diversity And Inclusion Preferences Diversity And Inclusion Dashboard Information PDF
This infographic provides the D and I dashboard which covers promotion rate, termination rate, staffing ratio, etc. Deliver an awe inspiring pitch with this creative organizational diversity and inclusion preferences diversity and inclusion dashboard information pdf bundle. Topics like promotion rate, termination rate, future leaders, high potential successor rate can be discussed with this completely editable template. It is available for immediate download depending on the needs and requirements of the user.
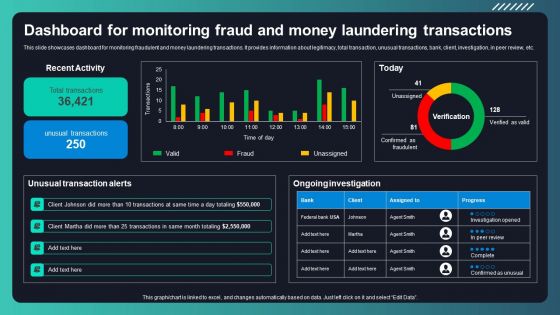
Deploying AML Transaction Monitoring Dashboard For Monitoring Fraud And Money Rules PDF
This slide showcases dashboard for monitoring fraudulent and money laundering transactions. It provides information about legitimacy, total transaction, unusual transactions, bank, client, investigation, in peer review, etc. Do you have an important presentation coming up Are you looking for something that will make your presentation stand out from the rest Look no further than Deploying AML Transaction Monitoring Dashboard For Monitoring Fraud And Money Rules PDF. With our professional designs, you can trust that your presentation will pop and make delivering it a smooth process. And with Slidegeeks, you can trust that your presentation will be unique and memorable. So why wait Grab Deploying AML Transaction Monitoring Dashboard For Monitoring Fraud And Money Rules PDF today and make your presentation stand out from the rest.

Creating Transaction Monitoring Dashboard To Monitor Bank Transactions And Activities Information PDF
This slide showcases dashboard to review bank transactions and activities. It provides information about credit, check, ATM, debit card, transaction volume, decline rate, visa, maestro, network end points, etc. Do you have an important presentation coming up Are you looking for something that will make your presentation stand out from the rest Look no further than Creating Transaction Monitoring Dashboard To Monitor Bank Transactions And Activities Information PDF. With our professional designs, you can trust that your presentation will pop and make delivering it a smooth process. And with Slidegeeks, you can trust that your presentation will be unique and memorable. So why wait Grab Creating Transaction Monitoring Dashboard To Monitor Bank Transactions And Activities Information PDF today and make your presentation stand out from the rest.
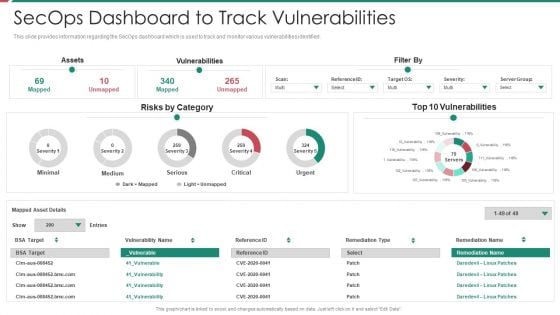
Security And Process Integration Secops Dashboard To Track Vulnerabilities Mockup PDF
This slide provides information regarding the SecOps dashboard which is used to track and monitor various vulnerabilities identified. Deliver and pitch your topic in the best possible manner with this security and process integration secops dashboard to track vulnerabilities mockup pdf. Use them to share invaluable insights on assets, vulnerabilities, severity and impress your audience. This template can be altered and modified as per your expectations. So, grab it now.
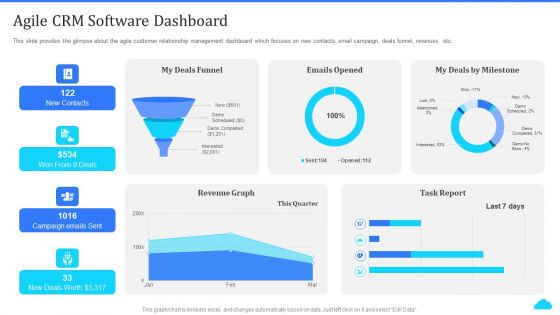
Cloud Based CRM Tools Agile CRM Software Dashboard Ppt Layouts Design Inspiration PDF
This slide provides the glimpse about the agile customer relationship management dashboard which focuses on new contacts, email campaign, deals funnel, revenues, etc. Deliver an awe inspiring pitch with this creative cloud based crm tools agile crm software dashboard ppt layouts design inspiration pdf bundle. Topics like revenue graph, funnel can be discussed with this completely editable template. It is available for immediate download depending on the needs and requirements of the user.
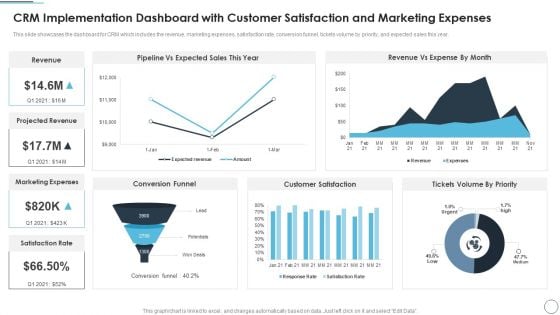
CRM Implementation Dashboard With Customer Satisfaction And Marketing Expenses Formats PDF
This slide showcases the dashboard for CRM which includes the revenue, marketing expenses, satisfaction rate, conversion funnel, tickets volume by priority, and expected sales this year.Deliver and pitch your topic in the best possible manner with this CRM Implementation Dashboard With Customer Satisfaction And Marketing Expenses Formats PDF Use them to share invaluable insights on Revenue Vs Expense, Customer Satisfaction, Conversion Funnel and impress your audience. This template can be altered and modified as per your expectations. So, grab it now.
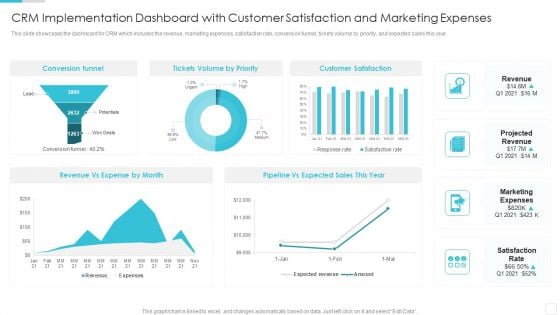
Sales CRM Cloud Solutions Deployment CRM Implementation Dashboard With Customer Diagrams PDF
This slide showcases the dashboard for CRM which includes the revenue, marketing expenses, satisfaction rate, conversion funnel, tickets volume by priority, and expected sales this year.Deliver an awe inspiring pitch with this creative Sales CRM Cloud Solutions Deployment CRM Implementation Dashboard With Customer Diagrams PDF bundle. Topics like Conversion Funnel, Customer Satisfaction, Expected Sales can be discussed with this completely editable template. It is available for immediate download depending on the needs and requirements of the user.
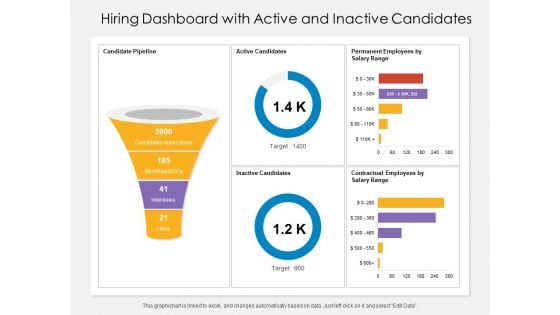
Hiring Dashboard With Active And Inactive Candidates Ppt PowerPoint Presentation Gallery Graphics Pictures PDF
Presenting this set of slides with name hiring dashboard with active and inactive candidates ppt powerpoint presentation gallery graphics pictures pdf. The topics discussed in these slides are inactive, permanent, contractual. This is a completely editable PowerPoint presentation and is available for immediate download. Download now and impress your audience.
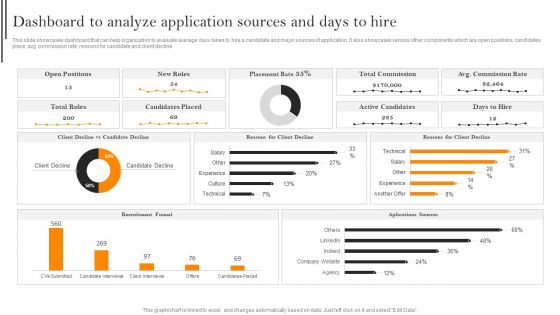
Dashboard To Analyze Application Sources And Days To Hire Template PDF
This slide showcases dashboard that can help organization to evaluate average days taken to hire a candidate and major sources of application. It also showcases various other components which are open positions, candidates place, avg commission rate, reasons for candidate and client decline. Find a pre designed and impeccable Dashboard To Analyze Application Sources And Days To Hire Template PDF. The templates can ace your presentation without additional effort. You can download these easy to edit presentation templates to make your presentation stand out from others. So, what are you waiting for Download the template from Slidegeeks today and give a unique touch to your presentation.
Food Processing Industry Latest Insights Trends And Analytics Performance Monitoring Dashboard For Consumer Goods Icons PDF
This slide showcase the performance monitoring dashboard for consumer goods providing information regarding the overview of food and beverages sales, top selling products and on shelf availability. Get a simple yet stunning designed Food Processing Industry Latest Insights Trends And Analytics Performance Monitoring Dashboard For Consumer Goods Icons PDF. It is the best one to establish the tone in your meetings. It is an excellent way to make your presentations highly effective. So, download this PPT today from Slidegeeks and see the positive impacts. Our easy to edit Food Processing Industry Latest Insights Trends And Analytics Performance Monitoring Dashboard For Consumer Goods Icons PDF can be your go to option for all upcoming conferences and meetings. So, what are you waiting for Grab this template today.
Process Enhancement Plan To Boost Sales Performance Social Media Performance Tracking And Monitoring Dashboard Elements PDF
The following slide showcases a dashboard to track and measure social media platforms performance. It includes key elements such as website traffic, social media referral rate, site revenue, social media site revenue, etc. Get a simple yet stunning designed Process Enhancement Plan To Boost Sales Performance Social Media Performance Tracking And Monitoring Dashboard Elements PDF. It is the best one to establish the tone in your meetings. It is an excellent way to make your presentations highly effective. So, download this PPT today from Slidegeeks and see the positive impacts. Our easy to edit Process Enhancement Plan To Boost Sales Performance Social Media Performance Tracking And Monitoring Dashboard Elements PDF can be your go-to option for all upcoming conferences and meetings. So, what are you waiting for Grab this template today.
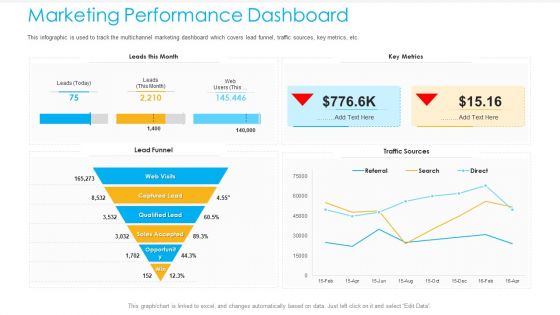
Unified Business To Consumer Marketing Strategy Marketing Performance Dashboard Introduction PDF
This infographic is used to track the multichannel marketing dashboard which covers lead funnel, traffic sources, key metrics, etc.Deliver an awe-inspiring pitch with this creative unified business to consumer marketing strategy marketing performance dashboard introduction pdf bundle. Topics like captured lead, qualified lead, sales accepted can be discussed with this completely editable template. It is available for immediate download depending on the needs and requirements of the user.
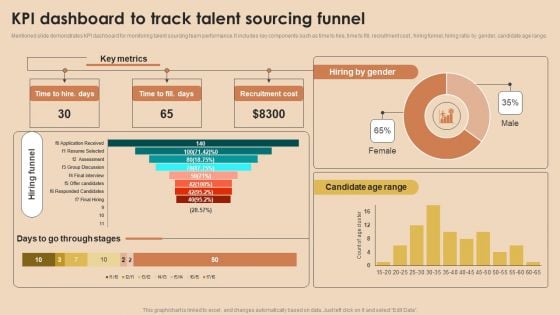
Detailed Guide For Talent Acquisition KPI Dashboard To Track Talent Sourcing Funnel Elements PDF
Mentioned slide demonstrates KPI dashboard for monitoring talent sourcing team performance. It includes key components such as time to hire, time to fill, recruitment cost , hiring funnel, hiring ratio by gender, candidate age range. Do you know about Slidesgeeks Detailed Guide For Talent Acquisition KPI Dashboard To Track Talent Sourcing Funnel Elements PDF These are perfect for delivering any kind od presentation. Using it, create PowerPoint presentations that communicate your ideas and engage audiences. Save time and effort by using our pre designed presentation templates that are perfect for a wide range of topic. Our vast selection of designs covers a range of styles, from creative to business, and are all highly customizable and easy to edit. Download as a PowerPoint template or use them as Google Slides themes.
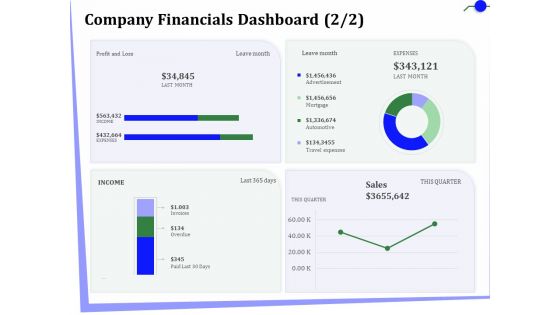
Outsourcing Of Finance And Accounting Processes Company Financials Dashboard Microsoft PDF
Presenting this set of slides with name outsourcing of finance and accounting processes company financials dashboard microsoft pdf. The topics discussed in these slides are performance, revenue, expense, profit. This is a completely editable PowerPoint presentation and is available for immediate download. Download now and impress your audience.
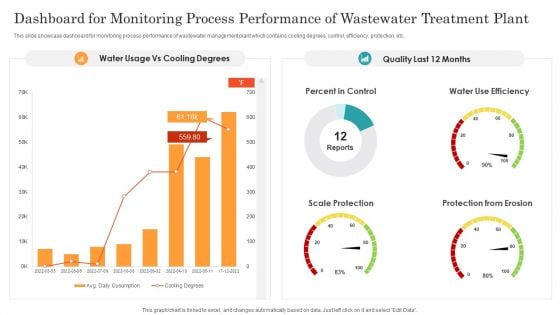
Dashboard For Monitoring Process Performance Of Wastewater Treatment Plant Ppt Infographic Template Demonstration PDF
This slide showcase dashboard for monitoring process performance of wastewater management plant which contains cooling degrees, control, efficiency, protection, etc. Showcasing this set of slides titled Dashboard For Monitoring Process Performance Of Wastewater Treatment Plant Ppt Infographic Template Demonstration PDF. The topics addressed in these templates are Percent Control, Water Use Efficiency, Scale Protection, Protection From Erosion. All the content presented in this PPT design is completely editable. Download it and make adjustments in color, background, font etc. as per your unique business setting.
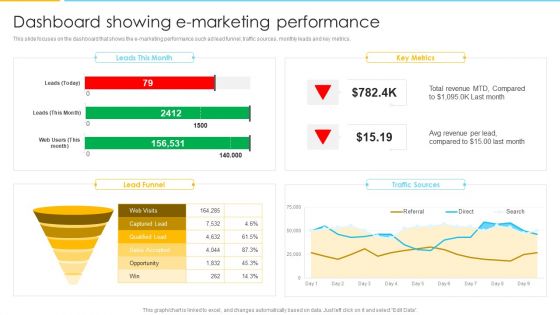
Optimizing Ecommerce Marketing Plan To Improve Sales Dashboard Showing E Marketing Performance Formats PDF
This slide focuses on the dashboard that shows the e marketing performance such ad lead funnel, traffic sources, monthly leads and key metrics. Deliver an awe inspiring pitch with this creative Optimizing Ecommerce Marketing Plan To Improve Sales Dashboard Showing E Marketing Performance Formats PDF bundle. Topics like Revenue, Key Metrics, Traffic Sources can be discussed with this completely editable template. It is available for immediate download depending on the needs and requirements of the user.
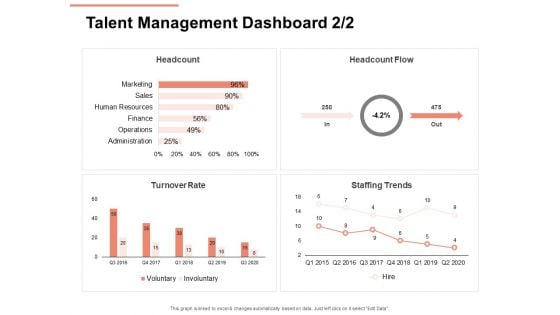
Workforce Planning System Talent Management Dashboard Ppt PowerPoint Presentation Layouts Example File PDF
Deliver an awe-inspiring pitch with this creative workforce planning system talent management dashboard ppt powerpoint presentation layouts example file pdf bundle. Topics like staffing trends, turnover rate, headcount flow, headcount can be discussed with this completely editable template. It is available for immediate download depending on the needs and requirements of the user.
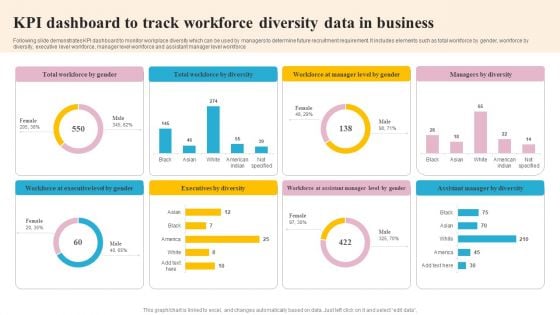
KPI Dashboard To Track Workforce Diversity Data In Business Mockup PDF
Following slide demonstrates KPI dashboard to monitor workplace diversity which can be used by managers to determine future recruitment requirement. It includes elements such as total workforce by gender, workforce by diversity, executive level workforce, manager level workforce and assistant manager level workforce. Pitch your topic with ease and precision using this KPI Dashboard To Track Workforce Diversity Data In Business Mockup PDF. This layout presents information on Executives By Diversity, Workforce By Diversity, Executive Level By Gender. It is also available for immediate download and adjustment. So, changes can be made in the color, design, graphics or any other component to create a unique layout.
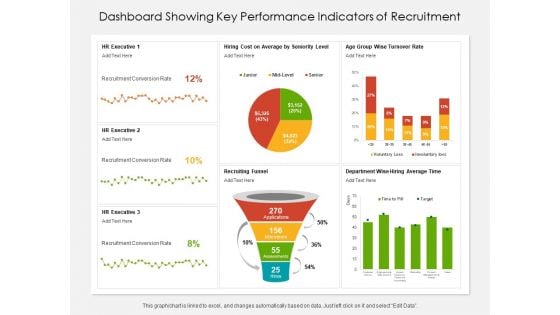
Dashboard Showing Key Performance Indicators Of Recruitment Ppt PowerPoint Presentation File Background Image PDF
Presenting this set of slides with name dashboard showing key performance indicators of recruitment ppt powerpoint presentation file background image pdf. The topics discussed in these slides are executive, funnel, department. This is a completely editable PowerPoint presentation and is available for immediate download. Download now and impress your audience.
Customer Relationship Management CRM Dashboard For Tracking Sales Pipeline Brochure PDF
This slide covers the CRM KPI dashboard for monitoring lead status in the sales funnel. It includes metrics such as open pipeline value, open pipeline by product package, pipeline value forecast, etc. Deliver an awe inspiring pitch with this creative Customer Relationship Management CRM Dashboard For Tracking Sales Pipeline Brochure PDF bundle. Topics like Pipeline Value, Pipeline Value, Product Package can be discussed with this completely editable template. It is available for immediate download depending on the needs and requirements of the user.
Electronic Commerce Systems Dashboard Depicting Metrics Of Digital Marketing Campaign Icons PDF
This slide shows the dashboard that depicts the metrics used for measuring digital marketing campaign that covers bounce rate, pageviews, conversions, social media followers, etc. Deliver an awe inspiring pitch with this creative Electronic Commerce Systems Dashboard Depicting Metrics Of Digital Marketing Campaign Icons PDF bundle. Topics like Website Performance, Conversion Funnel, Traffic Sources can be discussed with this completely editable template. It is available for immediate download depending on the needs and requirements of the user.
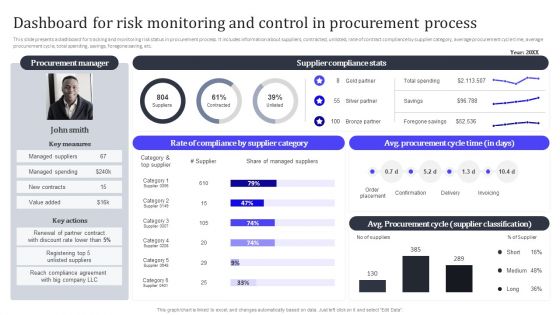
Dashboard For Risk Monitoring And Control In Procurement Process Structure PDF
This slide presents a dashboard for tracking and monitoring risk status in procurement process. It includes information about suppliers, contracted, unlisted, rate of contract compliance by supplier category, average procurement cycle time, average procurement cycle, total spending, savings, foregone saving, etc. Find a pre designed and impeccable Dashboard For Risk Monitoring And Control In Procurement Process Structure PDF. The templates can ace your presentation without additional effort. You can download these easy to edit presentation templates to make your presentation stand out from others. So, what are you waiting for Download the template from Slidegeeks today and give a unique touch to your presentation.
Process Enhancement Plan To Boost Sales Performance Website Performance Tracking And Monitoring Dashboard Diagrams PDF
The following slide showcases a dashboard to track and measure website performance. It includes key elements such as visits, average session duration, bounce rate, page views, goal conversion, visits by week, traffic sources, top channels by conversions, etc. From laying roadmaps to briefing everything in detail, our templates are perfect for you. You can set the stage with your presentation slides. All you have to do is download these easy to edit and customizable templates. Process Enhancement Plan To Boost Sales Performance Website Performance Tracking And Monitoring Dashboard Diagrams PDF will help you deliver an outstanding performance that everyone would remember and praise you for. Do download this presentation today.
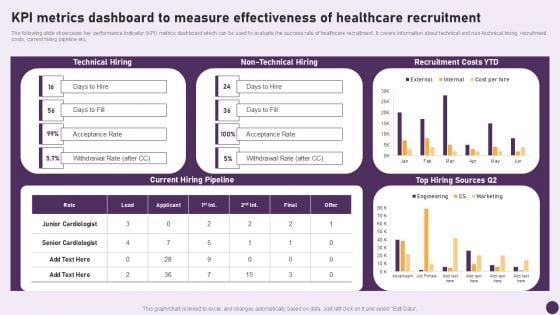
Guide To Healthcare Services Administration KPI Metrics Dashboard To Measure Effectiveness Healthcare Information PDF
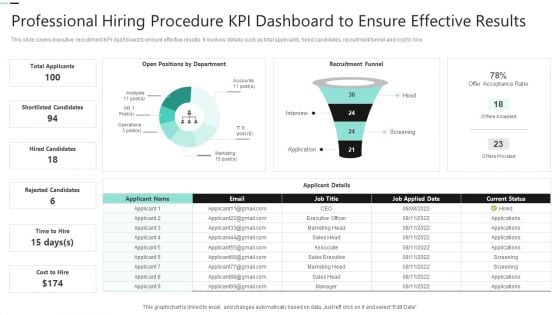
Professional Hiring Procedure KPI Dashboard To Ensure Effective Results Summary PDF
Showcasing this set of slides titled Professional Hiring Procedure KPI Dashboard To Ensure Effective Results Summary PDF. The topics addressed in these templates are Shortlisted Candidates, Hired Candidates, Rejected Candidates. All the content presented in this PPT design is completely editable. Download it and make adjustments in color, background, font etc. as per your unique business setting.
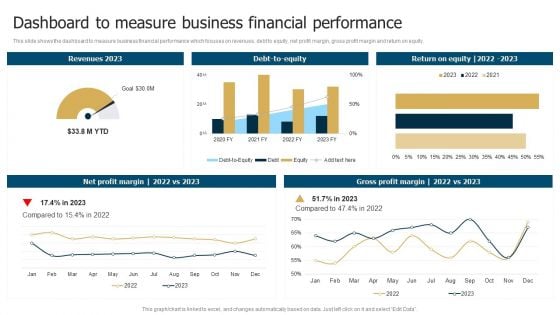
Business Restructuring Process Dashboard To Measure Business Financial Performance Rules PDF
This slide shows the dashboard to measure business financial performance which focuses on revenues, debt to equity, net profit margin, gross profit margin and return on equity. If you are looking for a format to display your unique thoughts, then the professionally designed Business Restructuring Process Dashboard To Measure Business Financial Performance Rules PDF is the one for you. You can use it as a Google Slides template or a PowerPoint template. Incorporate impressive visuals, symbols, images, and other charts. Modify or reorganize the text boxes as you desire. Experiment with shade schemes and font pairings. Alter, share or cooperate with other people on your work. Download Business Restructuring Process Dashboard To Measure Business Financial Performance Rules PDF and find out how to give a successful presentation. Present a perfect display to your team and make your presentation unforgettable.
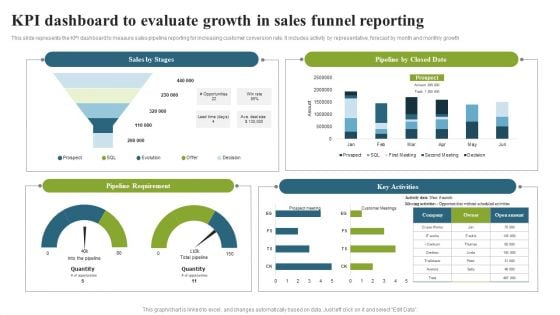
KPI Dashboard To Evaluate Growth In Sales Funnel Reporting Topics PDF
This slide represents the KPI dashboard to measure sales pipeline reporting for increasing customer conversion rate. It includes activity by representative, forecast by month and monthly growth. Pitch your topic with ease and precision using this KPI Dashboard To Evaluate Growth In Sales Funnel Reporting Topics PDF. This layout presents information on Pipeline Requirement, Key Activities, Pipeline Closed Date. It is also available for immediate download and adjustment. So, changes can be made in the color, design, graphics or any other component to create a unique layout.
CRM Software Deployment Journey CRM Dashboard For Tracking Sales Pipeline Demonstration PDF
This slide covers the CRM KPI dashboard for monitoring lead status in the sales funnel. It includes metrics such as open pipeline value, open pipeline by product package, pipeline value forecast, etc. Do you have to make sure that everyone on your team knows about any specific topic I yes, then you should give CRM Software Deployment Journey CRM Dashboard For Tracking Sales Pipeline Demonstration PDF a try. Our experts have put a lot of knowledge and effort into creating this impeccable CRM Software Deployment Journey CRM Dashboard For Tracking Sales Pipeline Demonstration PDF. You can use this template for your upcoming presentations, as the slides are perfect to represent even the tiniest detail. You can download these templates from the Slidegeeks website and these are easy to edit. So grab these today.
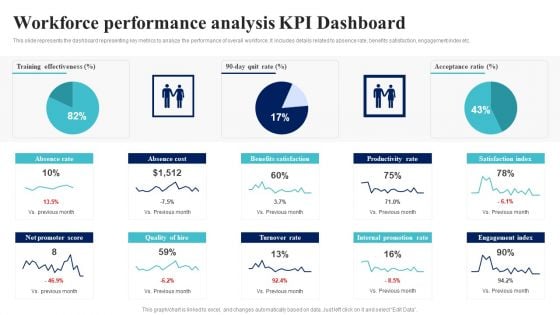
BI Implementation To Enhance Hiring Process Workforce Performance Analysis Kpi Dashboard Formats PDF
This slide represents the dashboard representing key metrics to analyze the performance of overall workforce. It includes details related to absence rate, benefits satisfaction, engagement index etc.Are you in need of a template that can accommodate all of your creative concepts This one is crafted professionally and can be altered to fit any style. Use it with Google Slides or PowerPoint. Include striking photographs, symbols, depictions, and other visuals. Fill, move around, or remove text boxes as desired. Test out color palettes and font mixtures. Edit and save your work, or work with colleagues. Download BI Implementation To Enhance Hiring Process Workforce Performance Analysis Kpi Dashboard Formats PDF and observe how to make your presentation outstanding. Give an impeccable presentation to your group and make your presentation unforgettable.
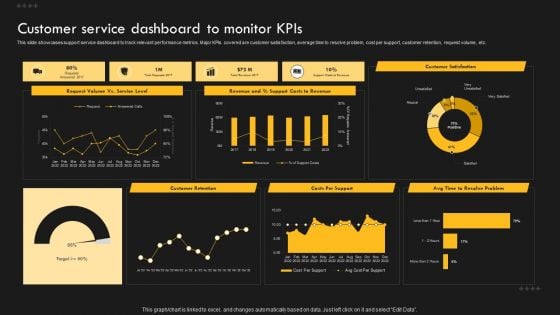
Service Improvement Techniques For Client Retention Customer Service Dashboard To Monitor Kpis Clipart PDF
This slide showcases support service dashboard to track relevant performance metrics. Major KPIs covered are customer satisfaction, average time to resolve problem, cost per support, customer retention, request volume, etc. Do you have an important presentation coming up. Are you looking for something that will make your presentation stand out from the rest. Look no further than Service Improvement Techniques For Client Retention Customer Service Dashboard To Monitor Kpis Clipart PDF. With our professional designs, you can trust that your presentation will pop and make delivering it a smooth process. And with Slidegeeks, you can trust that your presentation will be unique and memorable. So why wait. Grab Service Improvement Techniques For Client Retention Customer Service Dashboard To Monitor Kpis Clipart PDF today and make your presentation stand out from the rest.
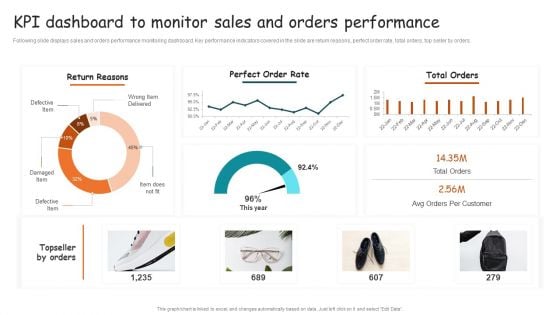
Guide For Brand Kpi Dashboard To Monitor Sales And Orders Performance Brochure PDF
Following slide displays sales and orders performance monitoring dashboard. Key performance indicators covered in the slide are return reasons, perfect order rate, total orders, top seller by orders. Do you have an important presentation coming up Are you looking for something that will make your presentation stand out from the rest Look no further than Guide For Brand Kpi Dashboard To Monitor Sales And Orders Performance Brochure PDF. With our professional designs, you can trust that your presentation will pop and make delivering it a smooth process. And with Slidegeeks, you can trust that your presentation will be unique and memorable. So why wait Grab Guide For Brand Kpi Dashboard To Monitor Sales And Orders Performance Brochure PDF today and make your presentation stand out from the rest.
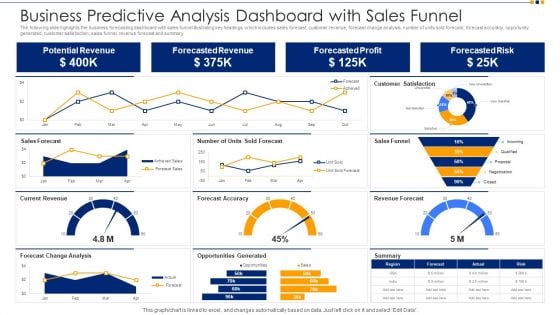
Business Predictive Analysis Dashboard With Sales Funnel Ppt Show Images PDF
The following slide highlights the business forecasting dashboard with sales funnel illustrating key headings which includes sales forecast, customer revenue, forecast change analysis, number of units sold forecast, forecast accuracy, opportunity generated, customer satisfaction, sales funnel, revenue forecast and summary. Pitch your topic with ease and precision using this business predictive analysis dashboard with sales funnel ppt show images pdf. This layout presents information on potential revenue, forecasted revenue, forecasted profit, forecasted risk. It is also available for immediate download and adjustment. So, changes can be made in the color, design, graphics or any other component to create a unique layout.
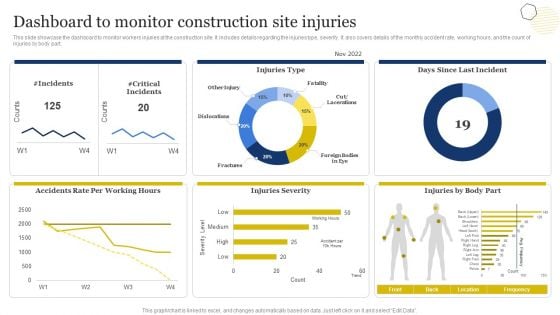
Improvement Of Safety Performance At Construction Site Dashboard To Monitor Construction Mockup PDF
This slide showcase the dashboard to monitor workers injuries at the construction site. It includes details regarding the injuries type, severity. It also covers details of the monthly accident rate, working hours, and the count of injuries by body part. Do you have an important presentation coming up Are you looking for something that will make your presentation stand out from the rest Look no further than Improvement Of Safety Performance At Construction Site Dashboard To Monitor Construction Mockup PDF. With our professional designs, you can trust that your presentation will pop and make delivering it a smooth process. And with Slidegeeks, you can trust that your presentation will be unique and memorable. So why wait Grab Improvement Of Safety Performance At Construction Site Dashboard To Monitor Construction Mockup PDF today and make your presentation stand out from the rest
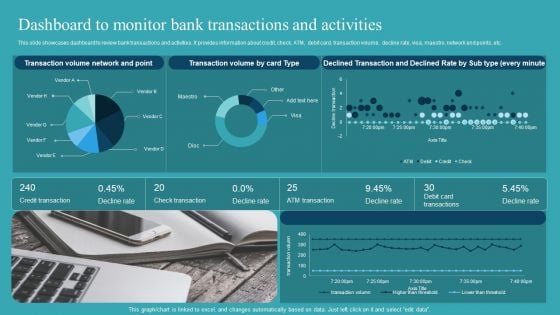
Integrating AML And Transaction Dashboard To Monitor Bank Transactions Demonstration PDF
This slide showcases dashboard to review bank transactions and activities. It provides information about credit, check, ATM, debit card, transaction volume, decline rate, visa, maestro, network end points, etc. Do you have an important presentation coming up Are you looking for something that will make your presentation stand out from the rest Look no further than Integrating AML And Transaction Dashboard To Monitor Bank Transactions Demonstration PDF. With our professional designs, you can trust that your presentation will pop and make delivering it a smooth process. And with Slidegeeks, you can trust that your presentation will be unique and memorable. So why wait Grab Integrating AML And Transaction Dashboard To Monitor Bank Transactions Demonstration PDF today and make your presentation stand out from the rest.
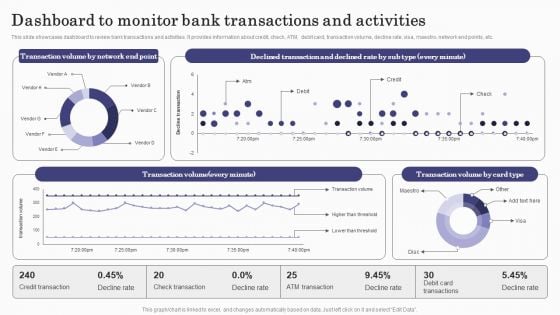
Deploying Banking Transaction Dashboard To Monitor Bank Transactions And Activities Summary PDF
This slide showcases dashboard to review bank transactions and activities. It provides information about credit, check, ATM, debit card, transaction volume, decline rate, visa, maestro, network end points, etc. Do you have an important presentation coming up Are you looking for something that will make your presentation stand out from the rest Look no further than Deploying Banking Transaction Dashboard To Monitor Bank Transactions And Activities Summary PDF. With our professional designs, you can trust that your presentation will pop and make delivering it a smooth process. And with Slidegeeks, you can trust that your presentation will be unique and memorable. So why wait Grab Deploying Banking Transaction Dashboard To Monitor Bank Transactions And Activities Summary PDF today and make your presentation stand out from the rest.
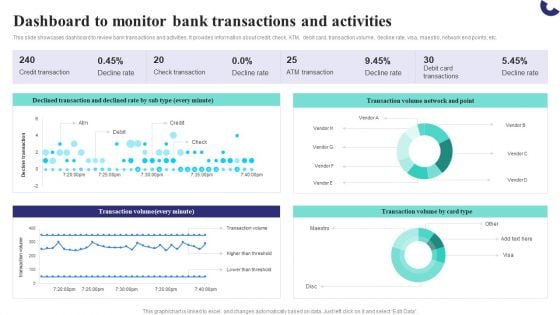
Formulating Money Laundering Dashboard To Monitor Bank Transactions And Activities Clipart PDF
This slide showcases dashboard to review bank transactions and activities. It provides information about credit, check, ATM, debit card, transaction volume, decline rate, visa, maestro, network end points, etc. Do you have an important presentation coming up Are you looking for something that will make your presentation stand out from the rest Look no further than Formulating Money Laundering Dashboard To Monitor Bank Transactions And Activities Clipart PDF. With our professional designs, you can trust that your presentation will pop and make delivering it a smooth process. And with Slidegeeks, you can trust that your presentation will be unique and memorable. So why wait Grab Formulating Money Laundering Dashboard To Monitor Bank Transactions And Activities Clipart PDF today and make your presentation stand out from the rest.
Effective NPO Promotional Strategies For Recruit Volunteers Event Analysis Dashboard Determine Total Funds Raised Icons PDF
This slide provides an overview of the dashboard depicting the events conducted to raise money. The dashboard includes participation by gender, type of events, fundraising event by state, year and occupation. This modern and well-arranged Effective NPO Promotional Strategies For Recruit Volunteers Event Analysis Dashboard Determine Total Funds Raised Icons PDF provides lots of creative possibilities. It is very simple to customize and edit with the Powerpoint Software. Just drag and drop your pictures into the shapes. All facets of this template can be edited with Powerpoint, no extra software is necessary. Add your own material, put your images in the places assigned for them, adjust the colors, and then you can show your slides to the world, with an animated slide included.
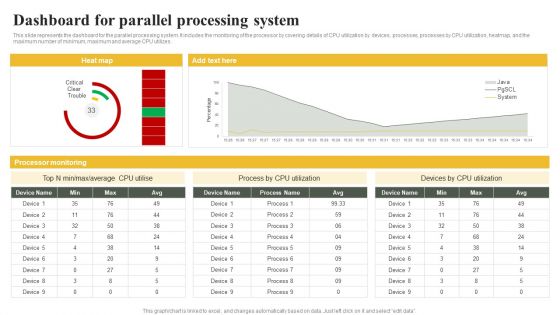
Parallel Computing System To Enhance Process Efficiency Dashboard For Parallel Processing System Graphics PDF
This slide represents the dashboard for the parallel processing system. It includes the monitoring of the processor by covering details of CPU utilization by devices, processes, processes by CPU utilization, heatmap, and the maximum number of minimum, maximum and average CPU utilizes.Create an editable Parallel Computing System To Enhance Process Efficiency Dashboard For Parallel Processing System Graphics PDF that communicates your idea and engages your audience. Whether you are presenting a business or an educational presentation, pre-designed presentation templates help save time. Parallel Computing System To Enhance Process Efficiency Dashboard For Parallel Processing System Graphics PDF is highly customizable and very easy to edit, covering many different styles from creative to business presentations. Slidegeeks has creative team members who have crafted amazing templates. So, go and get them without any delay.
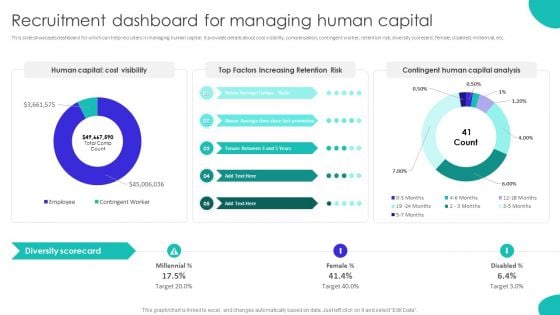
Improving Technology Based Recruitment Dashboard For Managing Human Capital Summary PDF
This slide showcases dashboard for which can help recruiters in managing human capital. It provides details about cost visibility, compensation, contingent worker, retention risk, diversity scorecard, female, disabled, millennial, etc. The Improving Technology Based Recruitment Dashboard For Managing Human Capital Summary PDF is a compilation of the most recent design trends as a series of slides. It is suitable for any subject or industry presentation, containing attractive visuals and photo spots for businesses to clearly express their messages. This template contains a variety of slides for the user to input data, such as structures to contrast two elements, bullet points, and slides for written information. Slidegeeks is prepared to create an impression.
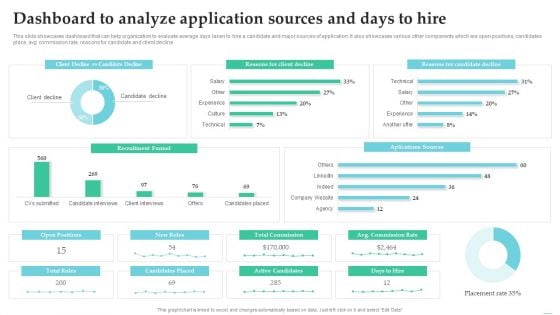
Employing Candidate Using Internal And External Mediums Of Recruitment Dashboard To Analyze Application Clipart PDF
This slide showcases dashboard that can help organization to evaluate average days taken to hire a candidate and major sources of application. It also showcases various other components which are open positions, candidates place, avg commission rate, reasons for candidate and client decline. From laying roadmaps to briefing everything in detail, our templates are perfect for you. You can set the stage with your presentation slides. All you have to do is download these easy to edit and customizable templates. Employing Candidate Using Internal And External Mediums Of Recruitment Dashboard To Analyze Application Clipart PDF will help you deliver an outstanding performance that everyone would remember and praise you for. Do download this presentation today.
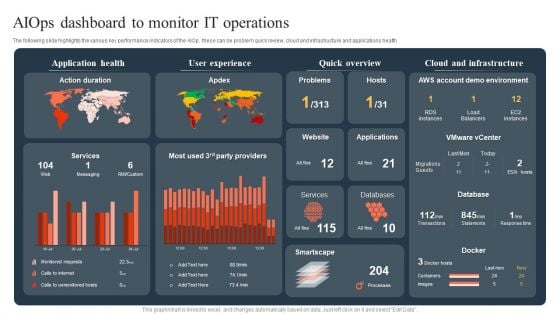
Ml And Big Data In Information Technology Processes Aiops Dashboard To Monitor IT Operations Sample PDF
The following slide highlights the various key performance indicators of the AIOp, these can be problem quick review, cloud and infrastructure and applications health If you are looking for a format to display your unique thoughts, then the professionally designed Ml And Big Data In Information Technology Processes Aiops Dashboard To Monitor IT Operations Sample PDF is the one for you. You can use it as a Google Slides template or a PowerPoint template. Incorporate impressive visuals, symbols, images, and other charts. Modify or reorganize the text boxes as you desire. Experiment with shade schemes and font pairings. Alter, share or cooperate with other people on your work. Download Ml And Big Data In Information Technology Processes Aiops Dashboard To Monitor IT Operations Sample PDF and find out how to give a successful presentation. Present a perfect display to your team and make your presentation unforgettable.
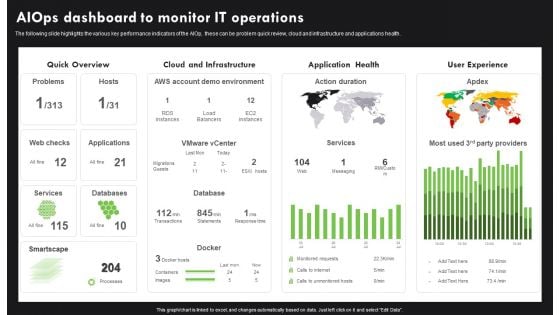
AI Deployment In IT Process Aiops Dashboard To Monitor IT Operations Infographics PDF
The following slide highlights the various key performance indicators of the AIOp, these can be problem quick review, cloud and infrastructure and applications health. If you are looking for a format to display your unique thoughts, then the professionally designed AI Deployment In IT Process Aiops Dashboard To Monitor IT Operations Infographics PDF is the one for you. You can use it as a Google Slides template or a PowerPoint template. Incorporate impressive visuals, symbols, images, and other charts. Modify or reorganize the text boxes as you desire. Experiment with shade schemes and font pairings. Alter, share or cooperate with other people on your work. Download AI Deployment In IT Process Aiops Dashboard To Monitor IT Operations Infographics PDF and find out how to give a successful presentation. Present a perfect display to your team and make your presentation unforgettable.
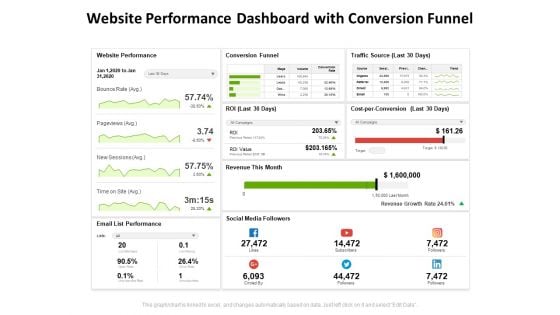
Website Performance Dashboard With Conversion Funnel Ppt PowerPoint Presentation Slides Pictures PDF
Presenting this set of slides with name website performance dashboard with conversion funnel ppt powerpoint presentation slides pictures pdf. The topics discussed in these slides are website performance, conversion funnel, traffic source, revenue this month, social media followers, email list performance. This is a completely editable PowerPoint presentation and is available for immediate download. Download now and impress your audience.
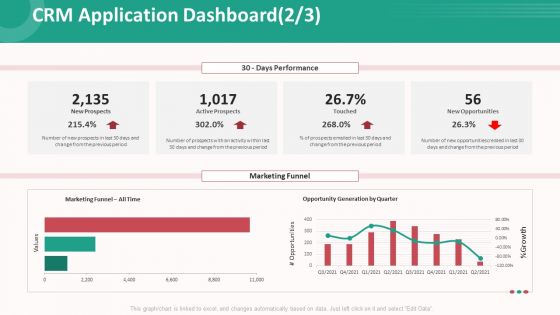
Customer Relationship Management Action Plan CRM Application Dashboard Funnel Sample PDF
Deliver an awe inspiring pitch with this creative customer relationship management action plan crm application dashboard funnel sample pdf bundle. Topics like marketing funnel, opportunity generation by quarter, opportunities can be discussed with this completely editable template. It is available for immediate download depending on the needs and requirements of the user.

Workspace Diversification And Inclusion Strategy Diversity And Inclusion Dashboard Leaders Brochure PDF
This infographic provides the DandI dashboard which covers promotion rate, termination rate, staffing ratio, etc. Deliver and pitch your topic in the best possible manner with this workspace diversification and inclusion strategy diversity and inclusion dashboard leaders brochure pdf. Use them to share invaluable insights on male to female staffing ratio, comp ratio by grade and gender, promotion rate in, termination rate future leaders, high potential successor rate and impress your audience. This template can be altered and modified as per your expectations. So, grab it now.
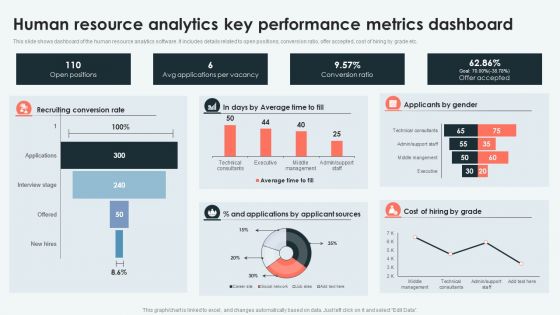
Analyzing And Deploying Human Resource Analytics Key Performance Metrics Dashboard Themes PDF
This slide shows dashboard of the human resource analytics software. It includes details related to open positions, conversion ratio, offer accepted, cost of hiring by grade etc. Do you have to make sure that everyone on your team knows about any specific topic I yes, then you should give Analyzing And Deploying Human Resource Analytics Key Performance Metrics Dashboard Themes PDF a try. Our experts have put a lot of knowledge and effort into creating this impeccable Analyzing And Deploying Human Resource Analytics Key Performance Metrics Dashboard Themes PDF. You can use this template for your upcoming presentations, as the slides are perfect to represent even the tiniest detail. You can download these templates from the Slidegeeks website and these are easy to edit. So grab these today.
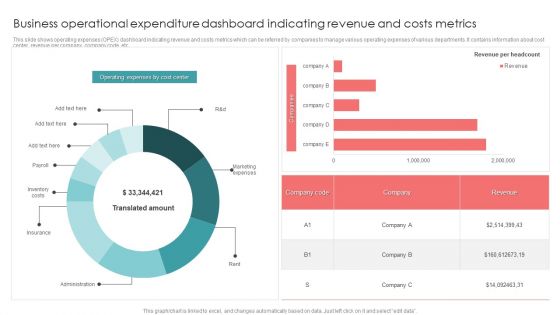
Business Operational Expenditure Dashboard Indicating Revenue And Costs Metrics Pictures PDF
This slide shows operating expenses OPEX dashboard indicating revenue and costs metrics which can be referred by companies to manage various operating expenses of various departments. It contains information about cost center, revenue per company, company code, etc. Pitch your topic with ease and precision using this Business Operational Expenditure Dashboard Indicating Revenue And Costs Metrics Pictures PDF. This layout presents information on Business Operational, Costs Metrics, Revenue. It is also available for immediate download and adjustment. So, changes can be made in the color, design, graphics or any other component to create a unique layout.
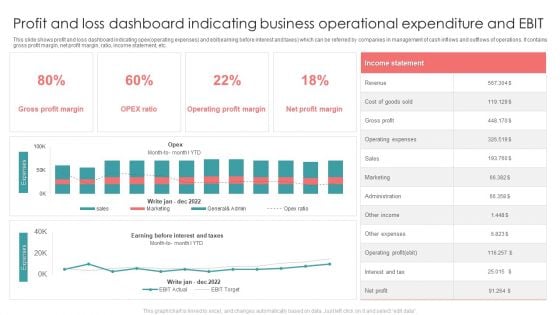
Profit And Loss Dashboard Indicating Business Operational Expenditure And EBIT Formats PDF
This slide shows profit and loss dashboard indicating opex operating expenses and ebit earning before interest and taxes which can be referred by companies in management of cash inflows and outflows of operations. It contains gross profit margin, net profit margin, ratio, income statement, etc. Showcasing this set of slides titled Profit And Loss Dashboard Indicating Business Operational Expenditure And EBIT Formats PDF. The topics addressed in these templates are Revenue, Gross Profit, Sales. All the content presented in this PPT design is completely editable. Download it and make adjustments in color, background, font etc. as per your unique business setting.
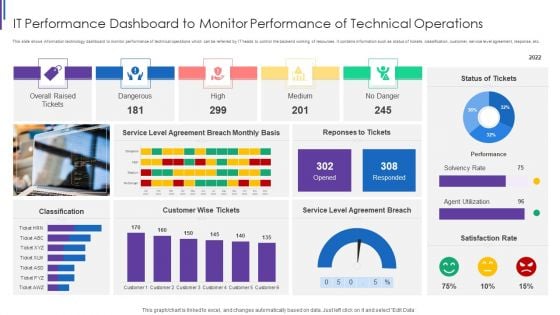
IT Performance Dashboard To Monitor Performance Of Technical Operations Download PDF
This slide shows information technology dashboard to monitor performance of technical operations which can be referred by IT heads to control the backend working of resources. It contains information such as status of tickets, classification, customer, service level agreement, response, etc. Showcasing this set of slides titled IT Performance Dashboard To Monitor Performance Of Technical Operations Download PDF. The topics addressed in these templates are Overall Raised Tickets, Dangerous High Medium, Service Level Agreement, Customer Wise Tickets. All the content presented in this PPT design is completely editable. Download it and make adjustments in color, background, font etc. as per your unique business setting.
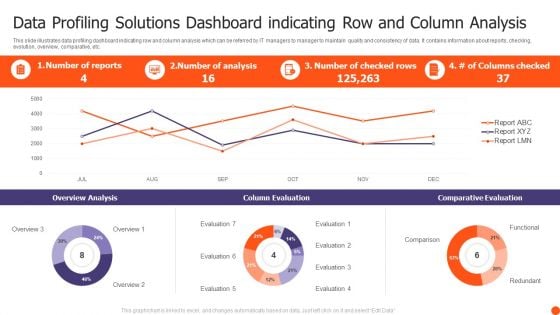
Data Profiling Solutions Dashboard Indicating Row And Column Analysis Summary PDF
This slide illustrates data profiling dashboard indicating row and column analysis which can be referred by IT managers to manager to maintain quality and consistency of data. It contains information about reports, checking, evolution, overview, comparative, etc. Showcasing this set of slides titled Data Profiling Solutions Dashboard Indicating Row And Column Analysis Summary PDF. The topics addressed in these templates are Overview Analysis, Column Evaluation, Comparative Evaluation. All the content presented in this PPT design is completely editable. Download it and make adjustments in color, background, font etc. as per your unique business setting.
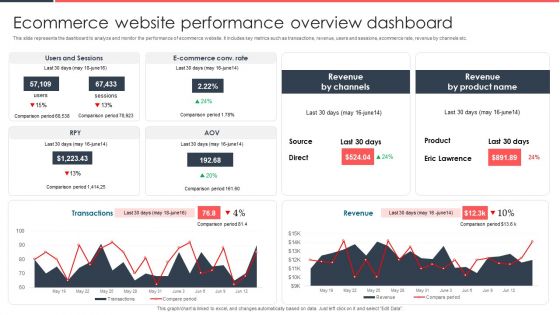
Implementing Management System To Enhance Ecommerce Processes Ecommerce Website Performance Overview Dashboard Slides PDF
This slide represents the dashboard to analyze and monitor the performance of ecommerce website. It includes key metrics such as transactions, revenue, users and sessions, ecommerce rate, revenue by channels etc. Here you can discover an assortment of the finest PowerPoint and Google Slides templates. With these templates, you can create presentations for a variety of purposes while simultaneously providing your audience with an eye catching visual experience. Download Implementing Management System To Enhance Ecommerce Processes Ecommerce Website Performance Overview Dashboard Slides PDF to deliver an impeccable presentation. These templates will make your job of preparing presentations much quicker, yet still, maintain a high level of quality. Slidegeeks has experienced researchers who prepare these templates and write high quality content for you. Later on, you can personalize the content by editing the Implementing Management System To Enhance Ecommerce Processes Ecommerce Website Performance Overview Dashboard Slides PDF.


 Continue with Email

 Home
Home


