Employee Turnover Dashboard
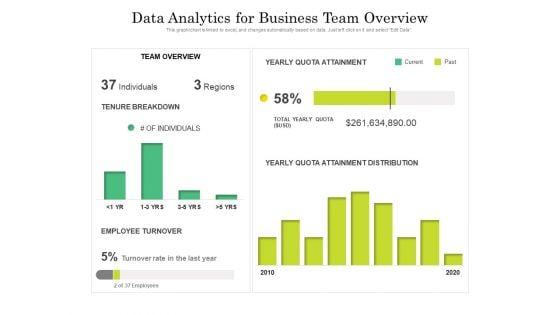
data analytics for business team overview ppt powerpoint presentation outline infographics pdf
Presenting this set of slides with name data analytics for business team overview ppt powerpoint presentation outline infographics pdf. The topics discussed in these slides are team overview, yearly quota attainment, individuals regions, tenure breakdown, employee turnover, yearly quota attainment distribution. This is a completely editable PowerPoint presentation and is available for immediate download. Download now and impress your audience.

Financial Projections Income Statement Ppt PowerPoint Presentation Inspiration Vector
This is a financial projections income statement ppt powerpoint presentation inspiration vector. This is a four stage process. The stages in this process are net sales, expenses, cost of goods sold, employee benefit expense, financing cost.
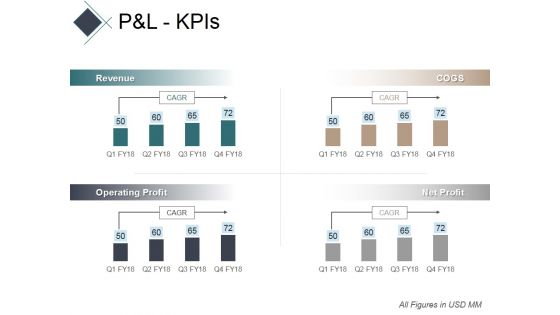
Pandl Kpis Ppt PowerPoint Presentation Professional Show
This is a pandl kpis ppt powerpoint presentation professional show. This is a four stage process. The stages in this process are other income, total income, expenses, total material consumed, employee benefit expense.

Tqm Elements Ppt PowerPoint Presentation Ideas Templates
This is a tqm elements ppt powerpoint presentation ideas templates. This is a one stage process. The stages in this process are continuous improvement, competitive benchmarking, employee empowerment, team approach.
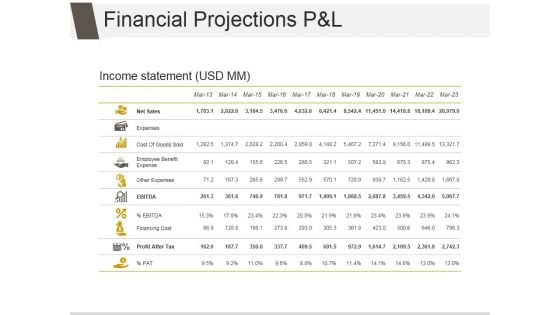
Financial Projections P And L Ppt PowerPoint Presentation Design Ideas
This is a financial projections p and l ppt powerpoint presentation design ideas. This is a eleven stage process. The stages in this process are net sales, expenses, cost of goods sold, employee benefit expense, other expenses, financing cost.
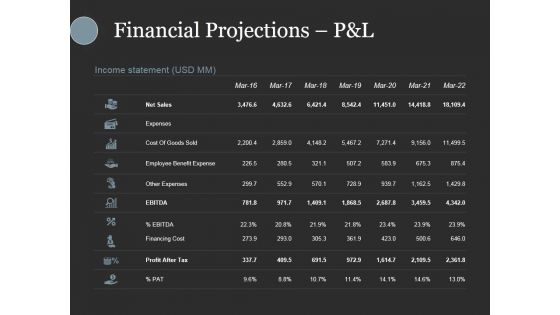
Financial Projections Pandl Ppt PowerPoint Presentation Slides Show
This is a financial projections pandl ppt powerpoint presentation slides show. This is a seven stage process. The stages in this process are net sales, expenses, cost of goods sold, employee benefit expense, other expenses.
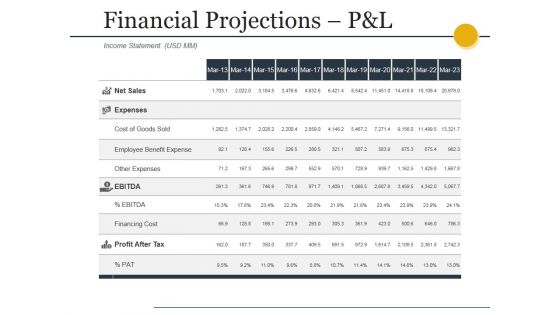
Financial Projections Pandl Ppt PowerPoint Presentation Styles Gallery
This is a financial projections pandl ppt powerpoint presentation styles gallery. This is a eleven stage process. The stages in this process are net sales, expenses, cost of goods sold, employee benefit expense, other expenses.
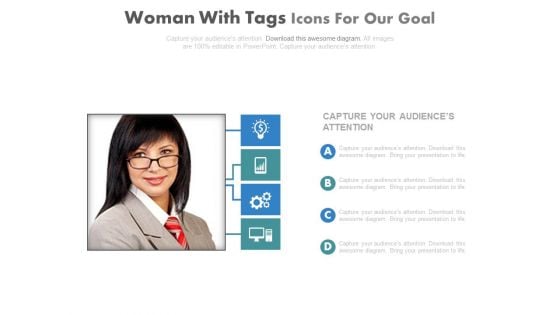
Woman Photo With Business Report Powerpoint Slides
This PowerPoint template is useful for setting goals and developing strategies. This PPT background has a design of female employee picture with icons. This PPT slide is suitable for topics like corporate strategic planning.
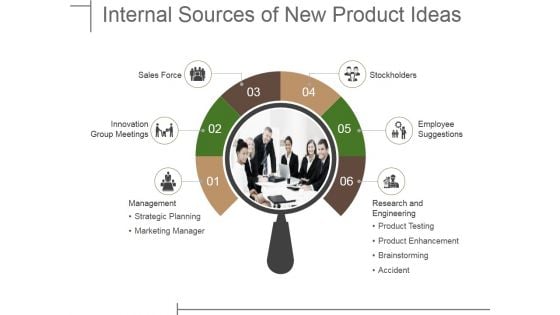
Internal Sources Of New Product Ideas Ppt PowerPoint Presentation Infographics Graphics Download
This is a internal sources of new product ideas ppt powerpoint presentation infographics graphics download. This is a six stage process. The stages in this process are sales force, innovation group meetings, management, stockholders, employee suggestions.
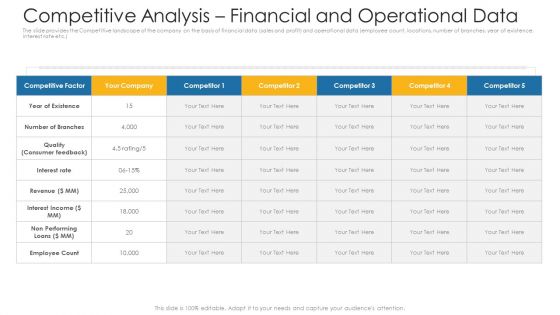
Competitive Analysis Financial And Operational Data Ppt Infographic Template Structure PDF
The slide provides the Competitive landscape of the company on the basis of financial data sales and profit and operational data employee count, locations, number of branches, year of existence, interest rate etc.Deliver an awe-inspiring pitch with this creative competitive analysis financial and operational data ppt infographic template structure pdf. bundle. Topics like revenue, interest income, employee count can be discussed with this completely editable template. It is available for immediate download depending on the needs and requirements of the user.
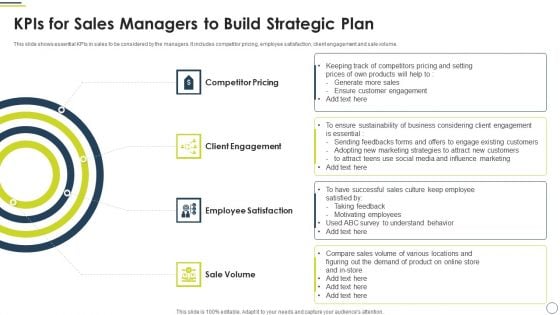
Kpis For Sales Managers To Build Strategic Plan Inspiration PDF
This slide shows essential KPIs in sales to be considered by the managers. It includes competitor pricing, employee satisfaction, client engagement and sale volume. Presenting Kpis For Sales Managers To Build Strategic Plan Inspiration PDF to dispense important information. This template comprises four stages. It also presents valuable insights into the topics including Competitor Pricing, Client Engagement, Employee Satisfaction. This is a completely customizable PowerPoint theme that can be put to use immediately. So, download it and address the topic impactfully.
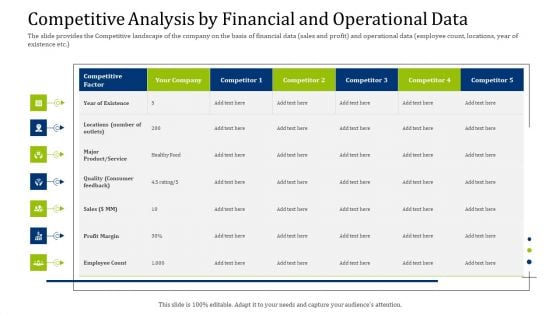
Convertible Debt Financing Pitch Deck Competitive Analysis By Financial And Operational Data Slides PDF
The slide provides the Competitive landscape of the company on the basis of financial data sales and profit and operational data employee count, locations, year of existence etc. Deliver an awe-inspiring pitch with this creative convertible debt financing pitch deck competitive analysis by financial and operational data slides pdf bundle. Topics like profit margin, employee count, sales, product, service can be discussed with this completely editable template. It is available for immediate download depending on the needs and requirements of the user.
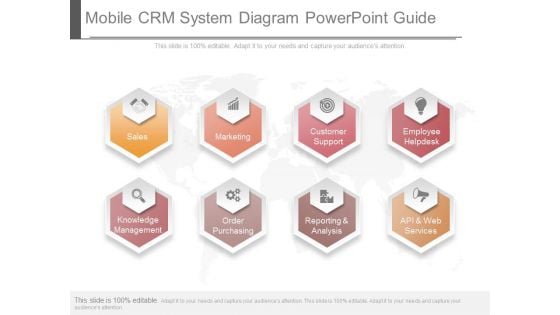
Mobile Crm System Diagram Powerpoint Guide
This is a mobile crm system diagram powerpoint guide. This is a eight stage process. The stages in this process are sales, marketing, customer support, employee helpdesk, knowledge management, order purchasing, reporting and analysis, api and web services.
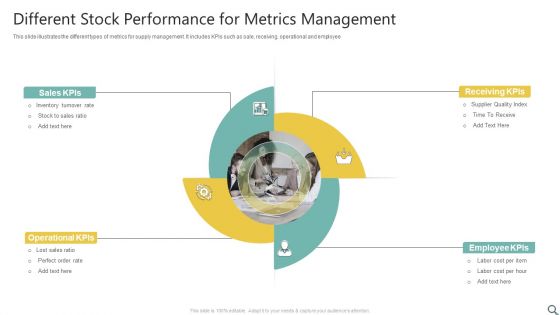
Different Stock Performance For Metrics Management Ppt File Graphics PDF
This slide illustrates the different types of metrics for supply management. It includes KPIs such as sale, receiving, operational and employee. Presenting Different Stock Performance For Metrics Management Ppt File Graphics PDF to dispense important information. This template comprises four stages. It also presents valuable insights into the topics including Sales KPIs, Receiving KPIs, Employee KPIs, Operational KPIs. This is a completely customizable PowerPoint theme that can be put to use immediately. So, download it and address the topic impactfully.
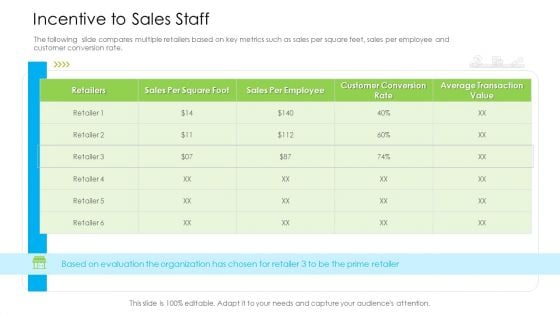
Marketing Techniques Online Offline Commercial Activities Incentive To Sales Staff Has Download PDF
The following slide compares multiple retailers based on key metrics such as sales per square feet, sales per employee and customer conversion rate. Deliver and pitch your topic in the best possible manner with this marketing techniques online offline commercial activities incentive to sales staff has download pdf. Use them to share invaluable insights on sales per employee, customer conversion rate, average transaction value and impress your audience. This template can be altered and modified as per your expectations. So, grab it now.
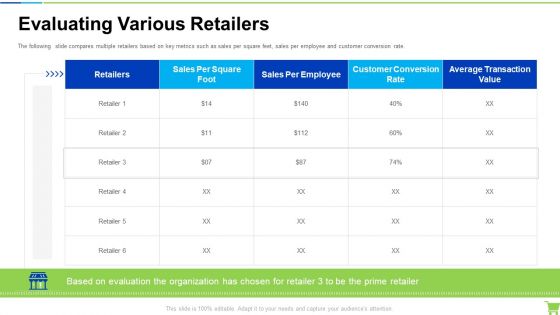
Developing And Controlling B2b Marketing Plan Evaluating Various Retailers Summary PDF
The following slide compares multiple retailers based on key metrics such as sales per square feet, sales per employee and customer conversion rate. Deliver an awe-inspiring pitch with this creative developing and controlling b2b marketing plan evaluating various retailers summary pdf. bundle. Topics like retailers, sales per square foot, sales per employee, customer conversion rate, average transaction value can be discussed with this completely editable template. It is available for immediate download depending on the needs and requirements of the user.
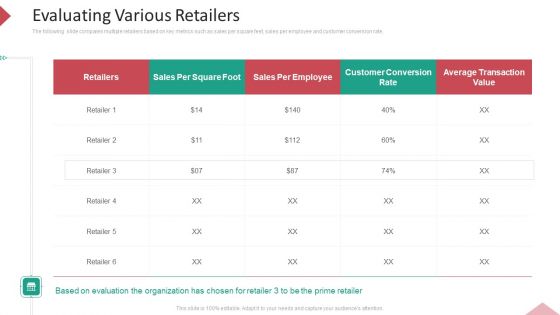
Inbound Interruption Commerce Promotion Practices Evaluating Various Retailers Ppt Portfolio Graphics Tutorials PDF
The following slide compares multiple retailers based on key metrics such as sales per square feet, sales per employee and customer conversion rate. Deliver an awe inspiring pitch with this creative inbound interruption commerce promotion practices evaluating various retailers ppt portfolio graphics tutorials pdf bundle. Topics like sales per employee, customer conversion rate, evaluating various retailers can be discussed with this completely editable template. It is available for immediate download depending on the needs and requirements of the user.
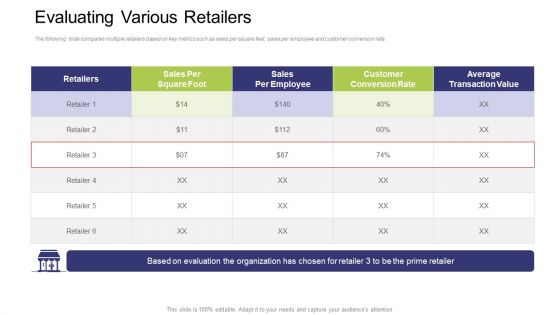
Evaluating Various Retailers Ppt Summary Skills PDF
The following slide compares multiple retailers based on key metrics such as sales per square feet, sales per employee and customer conversion rate. Deliver and pitch your topic in the best possible manner with this evaluating various retailers ppt summary skills pdf. Use them to share invaluable insights on sales per employee, customer conversion rate, average transaction value, retailers and impress your audience. This template can be altered and modified as per your expectations. So, grab it now.
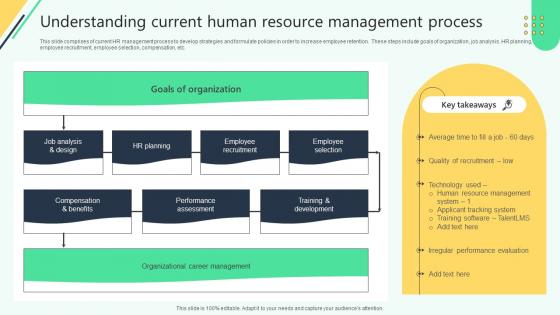
Understanding Current Human Resource Management Analysing Hr Data For Effective Decision Making
This slide comprises of current HR management process to develop strategies and formulate policies in order to increase employee retention. These steps include goals of organization, job analysis, HR planning, employee recruitment, employee selection, compensation, etc. Slidegeeks is here to make your presentations a breeze with Understanding Current Human Resource Management Analysing Hr Data For Effective Decision Making With our easy-to-use and customizable templates, you can focus on delivering your ideas rather than worrying about formatting. With a variety of designs to choose from, you are sure to find one that suits your needs. And with animations and unique photos, illustrations, and fonts, you can make your presentation pop. So whether you are giving a sales pitch or presenting to the board, make sure to check out Slidegeeks first This slide comprises of current HR management process to develop strategies and formulate policies in order to increase employee retention. These steps include goals of organization, job analysis, HR planning, employee recruitment, employee selection, compensation, etc.
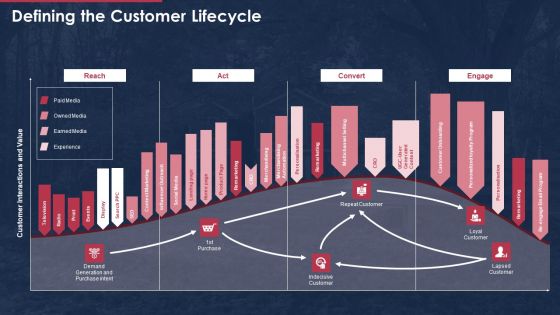
Building Promotional Campaign Real Estate Sales Defining The Customer Lifecycle Formats PDF
Mentioned provide illustrates real estate dashboard for monitoring salesperson performance. KPIs covered in the dashboard are deal count, deal totals, deal count leader boards and total active deal price. Deliver an awe inspiring pitch with this creative building promotional campaign real estate sales defining the customer lifecycle formats pdf bundle. Topics like real estate dashboard to monitor sales team performance can be discussed with this completely editable template. It is available for immediate download depending on the needs and requirements of the user.
Managing Technical And Non Various Kpis For Tracking Business Performance
Mentioned slide provide insights into various key performance indicators to determine business performance. It includes KPIs such as business financials, website traffic, customer case, customer engagement, conversion rate, customer retention, customer bounce rate, employee turnover, etc. Make sure to capture your audiences attention in your business displays with our gratis customizable Managing Technical And Non Various Kpis For Tracking Business Performance. These are great for business strategies, office conferences, capital raising or task suggestions. If you desire to acquire more customers for your tech business and ensure they stay satisfied, create your own sales presentation with these plain slides. Mentioned slide provide insights into various key performance indicators to determine business performance. It includes KPIs such as business financials, website traffic, customer case, customer engagement, conversion rate, customer retention, customer bounce rate, employee turnover, etc.
Comprehensive Guide For Website Various Kpis For Tracking Business Performance
Mentioned slide provide insights into various key performance indicators to determine business performance. It includes KPIs such as business financials, website traffic, customer case, customer engagement, conversion rate, customer retention, customer bounce rate, employee turnover, etc. Make sure to capture your audiences attention in your business displays with our gratis customizable Comprehensive Guide For Website Various Kpis For Tracking Business Performance. These are great for business strategies, office conferences, capital raising or task suggestions. If you desire to acquire more customers for your tech business and ensure they stay satisfied, create your own sales presentation with these plain slides. Mentioned slide provide insights into various key performance indicators to determine business performance. It includes KPIs such as business financials, website traffic, customer case, customer engagement, conversion rate, customer retention, customer bounce rate, employee turnover, etc.
Web Consulting Business Various Kpis For Tracking Business Performance
Mentioned slide provide insights into various key performance indicators to determine business performance. It includes KPIs such as business financials, website traffic, customer case, customer engagement, conversion rate, customer retention, customer bounce rate, employee turnover, etc. This modern and well-arranged Web Consulting Business Various Kpis For Tracking Business Performance provides lots of creative possibilities. It is very simple to customize and edit with the Powerpoint Software. Just drag and drop your pictures into the shapes. All facets of this template can be edited with Powerpoint, no extra software is necessary. Add your own material, put your images in the places assigned for them, adjust the colors, and then you can show your slides to the world, with an animated slide included. Mentioned slide provide insights into various key performance indicators to determine business performance. It includes KPIs such as business financials, website traffic, customer case, customer engagement, conversion rate, customer retention, customer bounce rate, employee turnover, etc.
Managing Technical And Non Business Progress Tracking Kpis Analysis
Mentioned slide displays key parameters used to determine business growth and decline over the years. It includes key parameters such as website traffic, customers, employee turnover, customer conversion rate, number of websites designed annually, etc. Present like a pro with Managing Technical And Non Business Progress Tracking Kpis Analysis. Create beautiful presentations together with your team, using our easy-to-use presentation slides. Share your ideas in real-time and make changes on the fly by downloading our templates. So whether you are in the office, on the go, or in a remote location, you can stay in sync with your team and present your ideas with confidence. With Slidegeeks presentation got a whole lot easier. Grab these presentations today. Mentioned slide displays key parameters used to determine business growth and decline over the years. It includes key parameters such as website traffic, customers, employee turnover, customer conversion rate, number of websites designed annually, etc.
Comprehensive Guide For Website Business Progress Tracking Kpis Analysis
Mentioned slide displays key parameters used to determine business growth and decline over the years. It includes key parameters such as website traffic, customers, employee turnover, customer conversion rate, number of websites designed annually, etc. Present like a pro with Comprehensive Guide For Website Business Progress Tracking Kpis Analysis. Create beautiful presentations together with your team, using our easy-to-use presentation slides. Share your ideas in real-time and make changes on the fly by downloading our templates. So whether you are in the office, on the go, or in a remote location, you can stay in sync with your team and present your ideas with confidence. With Slidegeeks presentation got a whole lot easier. Grab these presentations today. Mentioned slide displays key parameters used to determine business growth and decline over the years. It includes key parameters such as website traffic, customers, employee turnover, customer conversion rate, number of websites designed annually, etc.
Web Consulting Business Business Progress Tracking Kpis Analysis
Mentioned slide displays key parameters used to determine business growth and decline over the years. It includes key parameters such as website traffic, customers, employee turnover, customer conversion rate, number of websites designed annually, etc. Do you have an important presentation coming up Are you looking for something that will make your presentation stand out from the rest Look no further than Web Consulting Business Business Progress Tracking Kpis Analysis. With our professional designs, you can trust that your presentation will pop and make delivering it a smooth process. And with Slidegeeks, you can trust that your presentation will be unique and memorable. So why wait Grab Web Consulting Business Business Progress Tracking Kpis Analysis today and make your presentation stand out from the rest Mentioned slide displays key parameters used to determine business growth and decline over the years. It includes key parameters such as website traffic, customers, employee turnover, customer conversion rate, number of websites designed annually, etc.
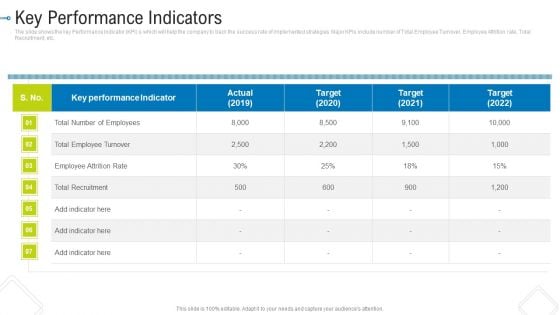
Key Performance Indicators Mockup PDF
Deliver and pitch your topic in the best possible manner with this key performance indicators mockup pdf. Use them to share invaluable insights on total number of employees, employee attrition rate, key performance indicator and impress your audience. This template can be altered and modified as per your expectations. So, grab it now.
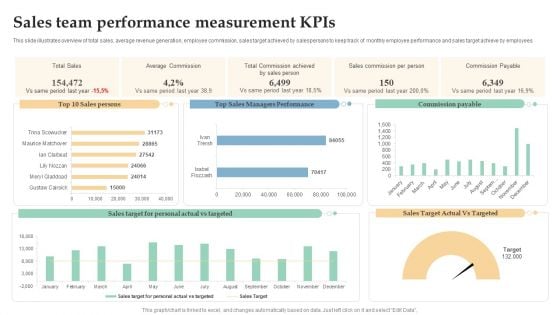
Sales Team Performance Measurement Kpis Ppt Professional Templates PDF
This slide illustrates overview of total sales, average revenue generation, employee commission, sales target achieved by salespersons to keep track of monthly employee performance and sales target achieve by employees. Showcasing this set of slides titled Sales Team Performance Measurement Kpis Ppt Professional Templates PDF. The topics addressed in these templates are Total Sales, Average Commission, Sales Commission, Per Person. All the content presented in this PPT design is completely editable. Download it and make adjustments in color, background, font etc. as per your unique business setting.

Transforming Recruitment Process Impact Of Effective Recruitment On Business CRP DK SS
This slide showcases impact of successful hiring on business performance using KPIs such as team productivity, employee turnover, project delays etc. Explore a selection of the finest Transforming Recruitment Process Impact Of Effective Recruitment On Business CRP DK SS here. With a plethora of professionally designed and pre-made slide templates, you can quickly and easily find the right one for your upcoming presentation. You can use our Transforming Recruitment Process Impact Of Effective Recruitment On Business CRP DK SS to effectively convey your message to a wider audience. Slidegeeks has done a lot of research before preparing these presentation templates. The content can be personalized and the slides are highly editable. Grab templates today from Slidegeeks. This slide showcases impact of successful hiring on business performance using KPIs such as team productivity, employee turnover, project delays etc.
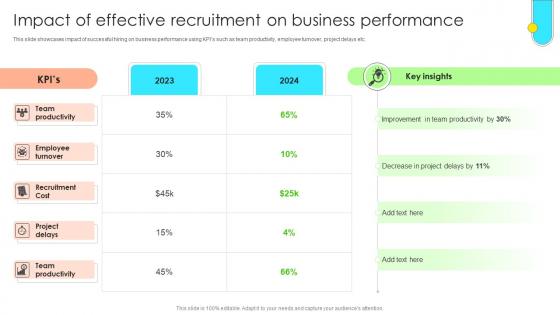
Data Driven Approach To Optimise Impact Of Effective Recruitment On Business CRP SS V
This slide showcases impact of successful hiring on business performance using KPIs such as team productivity, employee turnover, project delays etc. Explore a selection of the finest Data Driven Approach To Optimise Impact Of Effective Recruitment On Business CRP SS V here. With a plethora of professionally designed and pre-made slide templates, you can quickly and easily find the right one for your upcoming presentation. You can use our Data Driven Approach To Optimise Impact Of Effective Recruitment On Business CRP SS V to effectively convey your message to a wider audience. Slidegeeks has done a lot of research before preparing these presentation templates. The content can be personalized and the slides are highly editable. Grab templates today from Slidegeeks. This slide showcases impact of successful hiring on business performance using KPIs such as team productivity, employee turnover, project delays etc.
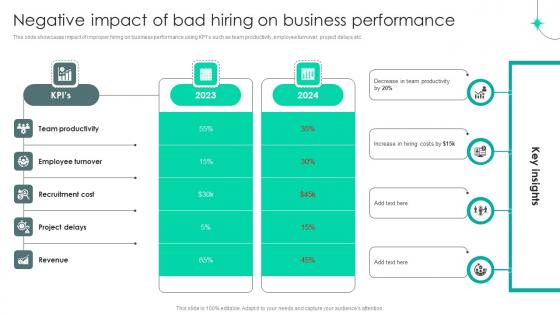
Strategic Staffing Using Data Negative Impact Of Bad Hiring On Business Performance CRP DK SS V
This slide showcases impact of improper hiring on business performance using KPIs such as team productivity, employee turnover, project delays etc. Take your projects to the next level with our ultimate collection of Strategic Staffing Using Data Negative Impact Of Bad Hiring On Business Performance CRP DK SS V. Slidegeeks has designed a range of layouts that are perfect for representing task or activity duration, keeping track of all your deadlines at a glance. Tailor these designs to your exact needs and give them a truly corporate look with your own brand colors they will make your projects stand out from the rest This slide showcases impact of improper hiring on business performance using KPIs such as team productivity, employee turnover, project delays etc.
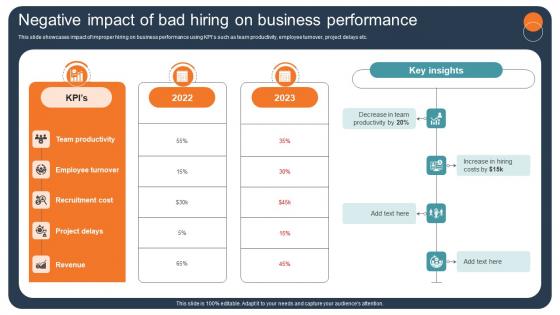
Transforming Recruitment Process Negative Impact Of Bad Hiring On Business CRP DK SS
This slide showcases impact of improper hiring on business performance using KPIs such as team productivity, employee turnover, project delays etc. This Transforming Recruitment Process Negative Impact Of Bad Hiring On Business CRP DK SS from Slidegeeks makes it easy to present information on your topic with precision. It provides customization options, so you can make changes to the colors, design, graphics, or any other component to create a unique layout. It is also available for immediate download, so you can begin using it right away. Slidegeeks has done good research to ensure that you have everything you need to make your presentation stand out. Make a name out there for a brilliant performance. This slide showcases impact of improper hiring on business performance using KPIs such as team productivity, employee turnover, project delays etc.
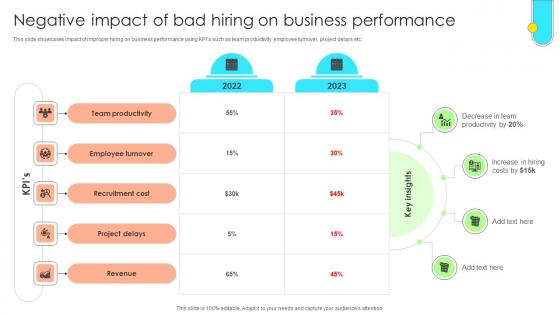
Data Driven Approach To Optimise Negative Impact Of Bad Hiring On Business CRP SS V
This slide showcases impact of improper hiring on business performance using KPIs such as team productivity, employee turnover, project delays etc. This Data Driven Approach To Optimise Negative Impact Of Bad Hiring On Business CRP SS V from Slidegeeks makes it easy to present information on your topic with precision. It provides customization options, so you can make changes to the colors, design, graphics, or any other component to create a unique layout. It is also available for immediate download, so you can begin using it right away. Slidegeeks has done good research to ensure that you have everything you need to make your presentation stand out. Make a name out there for a brilliant performance. This slide showcases impact of improper hiring on business performance using KPIs such as team productivity, employee turnover, project delays etc.
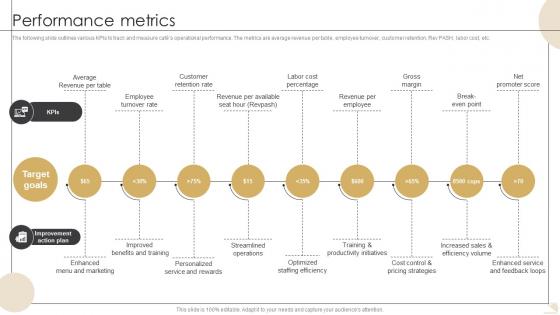
Performance Metrics Bistro Startup GTM Strategy GTM SS V
The following slide outlines various KPIs to track and measure cafes operational performance. The metrics are average revenue per table, employee turnover, customer retention, RevPASH, labor cost, etc.Formulating a presentation can take up a lot of effort and time, so the content and message should always be the primary focus. The visuals of the PowerPoint can enhance the presenters message, so our Performance Metrics Bistro Startup GTM Strategy GTM SS V was created to help save time. Instead of worrying about the design, the presenter can concentrate on the message while our designers work on creating the ideal templates for whatever situation is needed. Slidegeeks has experts for everything from amazing designs to valuable content, we have put everything into Performance Metrics Bistro Startup GTM Strategy GTM SS V. The following slide outlines various KPIs to track and measure cafes operational performance. The metrics are average revenue per table, employee turnover, customer retention, RevPASH, labor cost, etc.
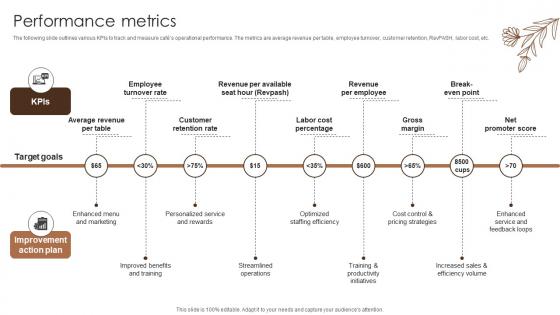
Performance Metrics Coffee Bar Go To Market Strategy GTM SS V
The following slide outlines various KPIs to track and measure cafes operational performance. The metrics are average revenue per table, employee turnover, customer retention, RevPASH, labor cost, etc.Coming up with a presentation necessitates that the majority of the effort goes into the content and the message you intend to convey. The visuals of a PowerPoint presentation can only be effective if it supplements and supports the story that is being told. Keeping this in mind our experts created Performance Metrics Coffee Bar Go To Market Strategy GTM SS V to reduce the time that goes into designing the presentation. This way, you can concentrate on the message while our designers take care of providing you with the right template for the situation. The following slide outlines various KPIs to track and measure cafes operational performance. The metrics are average revenue per table, employee turnover, customer retention, RevPASH, labor cost, etc.
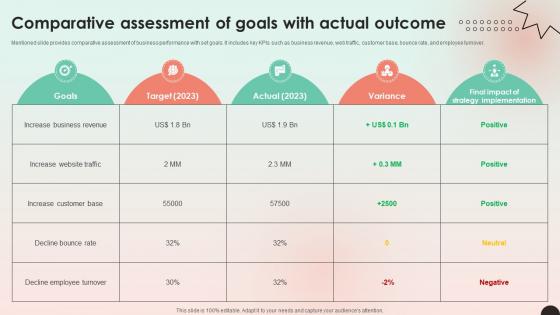
Web Consulting Business Performance Comparative Assessment Of Goals
Mentioned slide provides comparative assessment of business performance with set goals. It includes key KPIs such as business revenue, web traffic, customer base, bounce rate, and employee turnover. From laying roadmaps to briefing everything in detail, our templates are perfect for you. You can set the stage with your presentation slides. All you have to do is download these easy-to-edit and customizable templates. Web Consulting Business Performance Comparative Assessment Of Goals will help you deliver an outstanding performance that everyone would remember and praise you for. Do download this presentation today. Mentioned slide provides comparative assessment of business performance with set goals. It includes key KPIs such as business revenue, web traffic, customer base, bounce rate, and employee turnover.

Managing Technical And Non Technical Comparative Assessment Of Goals With Actual
Mentioned slide provides comparative assessment of business performance with set goals. It includes key KPIs such as business revenue, web traffic, customer base, bounce rate, and employee turnover. Do you have an important presentation coming up Are you looking for something that will make your presentation stand out from the rest Look no further than Managing Technical And Non Technical Comparative Assessment Of Goals With Actual. With our professional designs, you can trust that your presentation will pop and make delivering it a smooth process. And with Slidegeeks, you can trust that your presentation will be unique and memorable. So why wait Grab Managing Technical And Non Technical Comparative Assessment Of Goals With Actual today and make your presentation stand out from the rest Mentioned slide provides comparative assessment of business performance with set goals. It includes key KPIs such as business revenue, web traffic, customer base, bounce rate, and employee turnover.
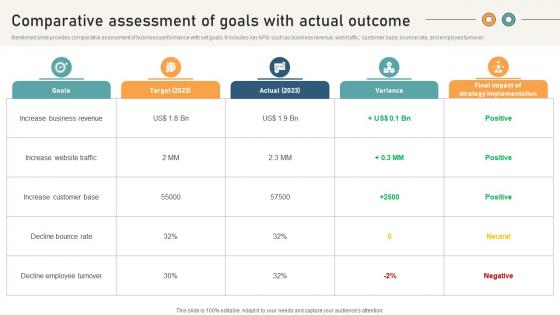
Comprehensive Guide For Website Development Comparative Assessment Of Goals With Actual
Mentioned slide provides comparative assessment of business performance with set goals. It includes key KPIs such as business revenue, web traffic, customer base, bounce rate, and employee turnover. This Comprehensive Guide For Website Development Comparative Assessment Of Goals With Actual is perfect for any presentation, be it in front of clients or colleagues. It is a versatile and stylish solution for organizing your meetings. The Comprehensive Guide For Website Development Comparative Assessment Of Goals With Actual features a modern design for your presentation meetings. The adjustable and customizable slides provide unlimited possibilities for acing up your presentation. Slidegeeks has done all the homework before launching the product for you. So, do not wait, grab the presentation templates today Mentioned slide provides comparative assessment of business performance with set goals. It includes key KPIs such as business revenue, web traffic, customer base, bounce rate, and employee turnover.
Competitive Analysis Financial And Operational Data Ppt Infographic Template Icons PDF
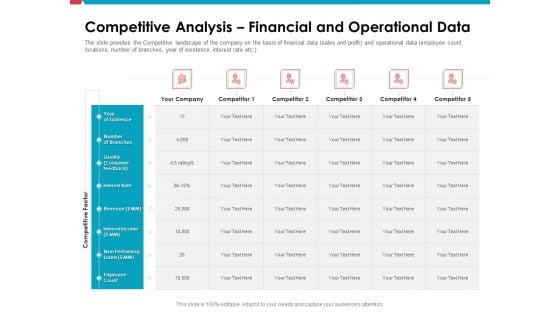
The slide provides the Competitive landscape of the company on the basis of financial data sales and profit and operational data employee count, locations, number of branches, year of existence, interest rate etc.Deliver and pitch your topic in the best possible manner with this competitive analysis financial and operational data ppt infographic template icons pdf. Use them to share invaluable insights on interest rate, interest income, revenue, employee count and impress your audience. This template can be altered and modified as per your expectations. So, grab it now.

Investor Pitch Deck Collect Funding Spot Market Competitive Analysis Financial And Operational Data Professional PDF
The slide provides the Competitive landscape of the company on the basis of financial data sales and profit and operational data employee count, locations, number of branches, year of existence, interest rate etc. Deliver an awe-inspiring pitch with this creative investor pitch deck collect funding spot market competitive analysis financial and operational data professional pdf bundle. Topics like interest rate, revenue, interest income, employee count, number of branches, quality can be discussed with this completely editable template. It is available for immediate download depending on the needs and requirements of the user.
Investor Pitch Deck Public Offering Market Competitive Analysis Financial And Operational Data Infographics PDF
The slide provides the Competitive landscape of the company on the basis of financial data sales and profit and operational data employee count, locations, number of branches, year of existence, interest rate etc. Deliver an awe-inspiring pitch with this creative investor pitch deck public offering market competitive analysis financial and operational data infographics pdf bundle. Topics like employee count, revenue, interest rate, quality, interest income can be discussed with this completely editable template. It is available for immediate download depending on the needs and requirements of the user.

Pitch Deck To Attract Funding After IPO Market Competitive Analysis Financial And Operational Data Inspiration PDF
The slide provides the Competitive landscape of the company on the basis of financial data sales and profit and operational data employee count, locations, number of branches, year of existence, interest rate etc.Deliver and pitch your topic in the best possible manner with this pitch deck to attract funding after ipo market competitive analysis financial and operational data inspiration pdf . Use them to share invaluable insights on quality consumer feedback, interest income, employee count and impress your audience. This template can be altered and modified as per your expectations. So, grab it now.
Competitive Analysis Financial And Operational Data Ppt File Examples PDF
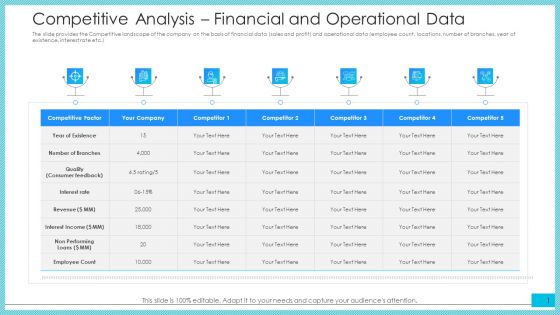
The slide provides the Competitive landscape of the company on the basis of financial data sales and profit and operational data employee count, locations, number of branches, year of existence, interest rate etc.Deliver and pitch your topic in the best possible manner with this competitive analysis financial and operational data ppt file examples pdf. Use them to share invaluable insights on interest rate, interest income, revenue, employee count and impress your audience. This template can be altered and modified as per your expectations. So, grab it now.
Pitch Deck For Fundraising From Post Market Financing Competitive Analysis Financial And Operational Data Themes PDF
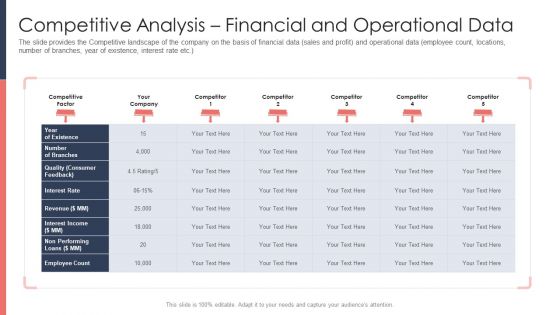
The slide provides the Competitive landscape of the company on the basis of financial data sales and profit and operational data employee count, locations, number of branches, year of existence, interest rate etc.Deliver and pitch your topic in the best possible manner with this pitch deck for fundraising from post market financing competitive analysis financial and operational data themes pdf. Use them to share invaluable insights on quality consumer feedback, interest rate, employee count and impress your audience. This template can be altered and modified as per your expectations. So, grab it now.
Investment Fundraising Pitch Deck From Stock Market Competitive Analysis Financial And Operational Data Template PDF
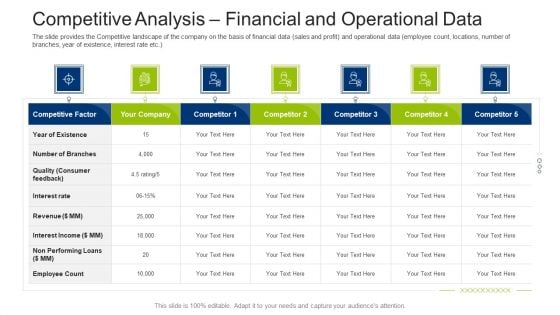
The slide provides the Competitive landscape of the company on the basis of financial data sales and profit and operational data employee count, locations, number of branches, year of existence, interest rate etc. Deliver and pitch your topic in the best possible manner with this investment fundraising pitch deck from stock market competitive analysis financial and operational data template pdf. Use them to share invaluable insights on competitive factor, performing, revenue, interest rate, employee count and impress your audience. This template can be altered and modified as per your expectations. So, grab it now.
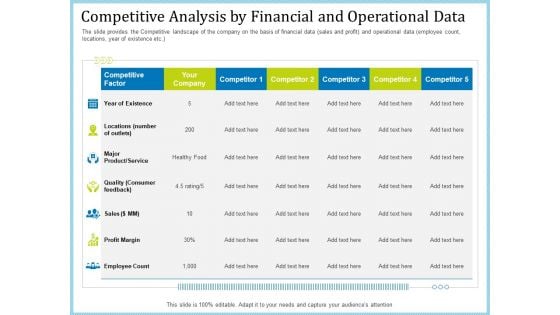
Pitch Deck For Short Term Debt Financing Competitive Analysis By Financial And Operational Data Inspiration PDF
The slide provides the Competitive landscape of the company on the basis of financial data sales and profit and operational data employee count, locations, year of existence etc.Deliver and pitch your topic in the best possible manner with this pitch deck for short term debt financing competitive analysis by financial and operational data inspiration pdf. Use them to share invaluable insights on competitive factor, product service profit margin, employee count, sales and impress your audience. This template can be altered and modified as per your expectations. So, grab it now.
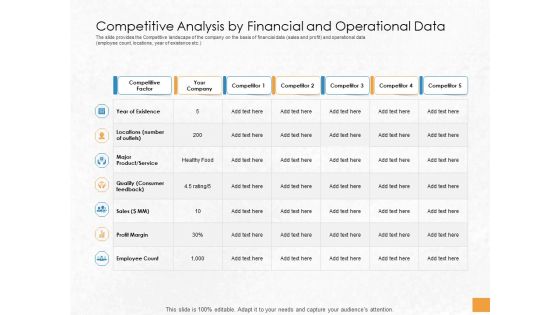
Convertible Debenture Funding Competitive Analysis By Financial And Operational Data Ppt Professional Vector PDF
The slide provides the Competitive landscape of the company on the basis of financial data sales and profit and operational data employee count, locations, year of existence etc. Deliver an awe-inspiring pitch with this creative convertible debenture funding competitive analysis by financial and operational data ppt professional vector pdf bundle. Topics like locations number outlets, major product, service, quality consumer feedback, sales, profit margin, employee count, year existence can be discussed with this completely editable template. It is available for immediate download depending on the needs and requirements of the user.
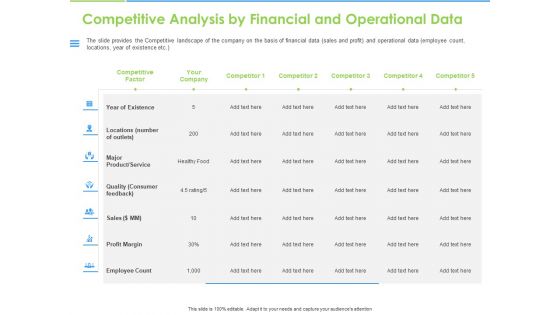
Convertible Bonds Pitch Deck For Increasing Capitals Competitive Analysis By Financial And Operational Data Microsoft PDF
The slide provides the Competitive landscape of the company on the basis of financial data sales and profit and operational data employee count, locations, year of existence etc. Deliver an awe-inspiring pitch with this creative convertible bonds pitch deck for increasing capitals competitive analysis by financial and operational data microsoft pdf bundle. Topics like locations number outlets, major product, service, quality consumer feedback, sales, profit margin, employee count, year existence can be discussed with this completely editable template. It is available for immediate download depending on the needs and requirements of the user.
Competitive Analysis By Financial And Operational Data Ppt Show Icon PDF
The slide provides the Competitive landscape of the company on the basis of financial data sales and profit and operational data employee count, locations, year of existence etc. Deliver and pitch your topic in the best possible manner with this competitive analysis by financial and operational data ppt show icon pdf. Use them to share invaluable insights on profit margin, employee count, sales, locations, consumer feedback and impress your audience. This template can be altered and modified as per your expectations. So, grab it now.
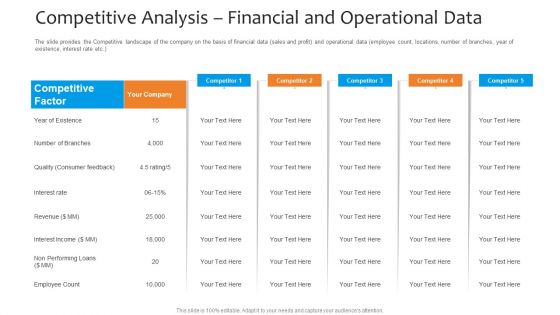
Funding Pitch To Raise Funds From PE Competitive Analysis Financial And Operational Data Background PDF
The slide provides the Competitive landscape of the company on the basis of financial data sales and profit and operational data employee count, locations, number of branches, year of existence, interest rate etc. Deliver and pitch your topic in the best possible manner with this funding pitch to raise funds from pe competitive analysis financial and operational data background pdf. Use them to share invaluable insights on competitive factor, performing, revenue, interest rate, employee count and impress your audience. This template can be altered and modified as per your expectations. So, grab it now.
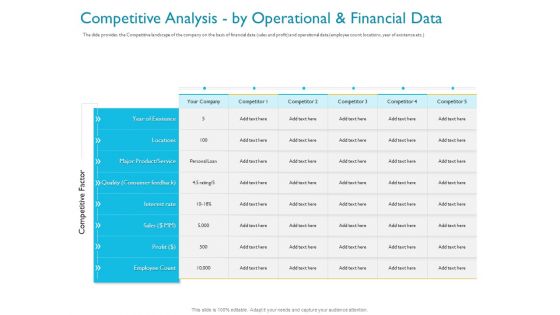
Investor Funding Deck For Hybrid Financing Competitive Analysis By Operational And Financial Data Ppt Pictures Rules PDF
The slide provides the Competitive landscape of the company on the basis of financial data sales and profit and operational data employee count, locations, year of existence etc. Deliver and pitch your topic in the best possible manner with this investor funding deck for hybrid financing competitive analysis by operational and financial data ppt pictures rules pdf. Use them to share invaluable insights on locations, sales, interest rate, major product, service, employee count, quality, consumer feedback and impress your audience. This template can be altered and modified as per your expectations. So, grab it now.

Investor Pitch Deck To Collect Capital From Subordinated Loan Competitive Analysis By Operational And Financial Data Diagrams PDF
The slide provides the Competitive landscape of the company on the basis of financial data sales and profit and operational data employee count, locations, year of existence etc. Deliver an awe-inspiring pitch with this creative investor pitch deck to collect capital from subordinated loan competitive analysis by operational and financial data diagrams pdf bundle. Topics like year existence, locations, major product service, interest rate, sales, employee count, profit can be discussed with this completely editable template. It is available for immediate download depending on the needs and requirements of the user.
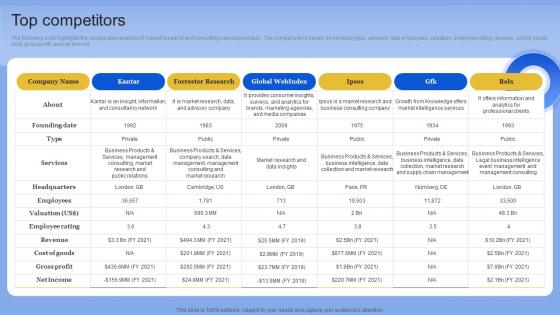
Top Competitors Data Analytics Company Outline Designs PDF
The following slide highlights the comparative analysis of market research and consulting service providers. The comparison is based on company type, services, total employees, valuation, employee rating, revenue, cost of goods sold, gross profit, and net income. Boost your pitch with our creative Top Competitors Data Analytics Company Outline Designs PDF Deliver an awe-inspiring pitch that will mesmerize everyone. Using these presentation templates you will surely catch everyones attention. You can browse the ppts collection on our website. We have researchers who are experts at creating the right content for the templates. So you do not have to invest time in any additional work. Just grab the template now and use them. The following slide highlights the comparative analysis of market research and consulting service providers. The comparison is based on company type, services, total employees, valuation, employee rating, revenue, cost of goods sold, gross profit, and net income
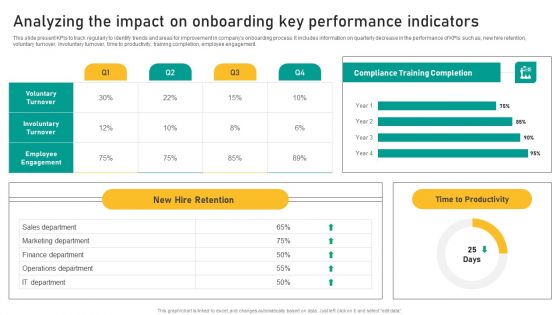
Talent Retention Initiatives For New Hire Onboarding Analyzing The Impact On Onboarding Background PDF
This slide present KPIs to track regularly to identify trends and areas for improvement in companys onboarding process. It includes information on quarterly decrease in the performance of KPIs such as, new hire retention, voluntary turnover, involuntary turnover, time to productivity, training completion, employee engagement. Find a pre designed and impeccable Talent Retention Initiatives For New Hire Onboarding Analyzing The Impact On Onboarding Background PDF. The templates can ace your presentation without additional effort. You can download these easy to edit presentation templates to make your presentation stand out from others. So, what are you waiting for Download the template from Slidegeeks today and give a unique touch to your presentation.
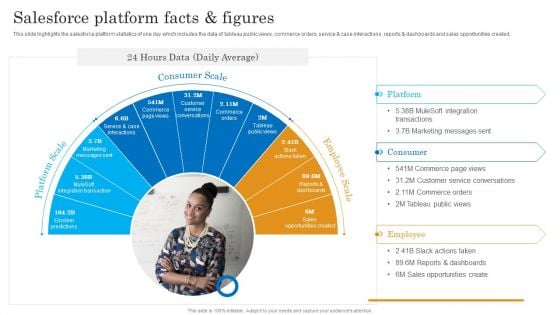
Salesforce Platform Facts AND Figures Salesforce Business Profile Graphics PDF
This slide highlights the salesforce platform statistics of one day which includes the data of tableau public views, commerce orders, service and case interactions, reports and dashboards and sales opportunities created. Presenting Salesforce Platform Facts AND Figures Salesforce Business Profile Graphics PDF to provide visual cues and insights. Share and navigate important information on three stages that need your due attention. This template can be used to pitch topics like Platform Scale, Consumer Scale, Employee Scale. In addtion, this PPT design contains high resolution images, graphics, etc, that are easily editable and available for immediate download.

Remote Sales Plan For Timeline To Track Training Of Inside Sales Executives Strategy SS V
This slide showcases timeline that can help organization to conduct training of inside sales employees. Key areas for employee training are sales follow up, cold calling, lead nurturing, CRM training and tracking sales KPIs. Present like a pro with Remote Sales Plan For Timeline To Track Training Of Inside Sales Executives Strategy SS V. Create beautiful presentations together with your team, using our easy-to-use presentation slides. Share your ideas in real-time and make changes on the fly by downloading our templates. So whether you are in the office, on the go, or in a remote location, you can stay in sync with your team and present your ideas with confidence. With Slidegeeks presentation got a whole lot easier. Grab these presentations today. This slide showcases timeline that can help organization to conduct training of inside sales employees. Key areas for employee training are sales follow up, cold calling, lead nurturing, CRM training and tracking sales KPIs

Virtual Sales Strategies Timeline To Track Training Of Inside Sales Executives Strategy SS V
This slide showcases timeline that can help organization to conduct training of inside sales employees. Key areas for employee training are sales follow up, cold calling, lead nurturing, CRM training and tracking sales kpis. Get a simple yet stunning designed Virtual Sales Strategies Timeline To Track Training Of Inside Sales Executives Strategy SS V. It is the best one to establish the tone in your meetings. It is an excellent way to make your presentations highly effective. So, download this PPT today from Slidegeeks and see the positive impacts. Our easy-to-edit Virtual Sales Strategies Timeline To Track Training Of Inside Sales Executives Strategy SS V can be your go-to option for all upcoming conferences and meetings. So, what are you waiting for Grab this template today. This slide showcases timeline that can help organization to conduct training of inside sales employees. Key areas for employee training are sales follow up, cold calling, lead nurturing, CRM training and tracking sales kpis.

Phone Sales Strategy To Drive Timeline To Track Training Of Inside Sales Strategy SS V
This slide showcases timeline that can help organization to conduct training of inside sales employees. Key areas for employee training are sales follow up, cold calling, lead nurturing, CRM training and tracking sales KPIs. From laying roadmaps to briefing everything in detail, our templates are perfect for you. You can set the stage with your presentation slides. All you have to do is download these easy-to-edit and customizable templates. Phone Sales Strategy To Drive Timeline To Track Training Of Inside Sales Strategy SS V will help you deliver an outstanding performance that everyone would remember and praise you for. Do download this presentation today. This slide showcases timeline that can help organization to conduct training of inside sales employees. Key areas for employee training are sales follow up, cold calling, lead nurturing, CRM training and tracking sales KPIs.

Timeline To Track Training Of Inside Vs Outside Sales PPT PowerPoint Strategy SS V
This slide showcases timeline that can help organization to conduct training of inside sales employees. Key areas for employee training are sales follow up, cold calling, lead nurturing, CRM training and tracking sales KPIs. Present like a pro with Timeline To Track Training Of Inside Vs Outside Sales PPT PowerPoint Strategy SS V. Create beautiful presentations together with your team, using our easy-to-use presentation slides. Share your ideas in real-time and make changes on the fly by downloading our templates. So whether you are in the office, on the go, or in a remote location, you can stay in sync with your team and present your ideas with confidence. With Slidegeeks presentation got a whole lot easier. Grab these presentations today. This slide showcases timeline that can help organization to conduct training of inside sales employees. Key areas for employee training are sales follow up, cold calling, lead nurturing, CRM training and tracking sales KPIs
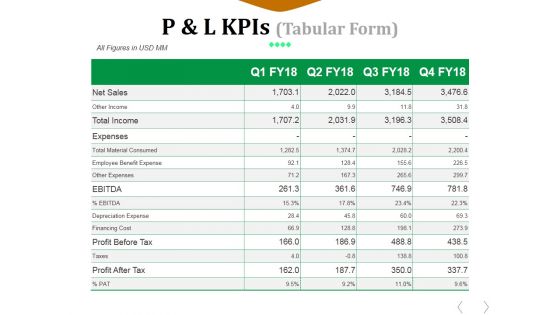
P And L Kpis Template 2 Ppt PowerPoint Presentation File Graphics Example
This is a p and l kpis template 2 ppt powerpoint presentation file graphics example. This is a four stage process. The stages in this process are net sales, expenses, cost of goods sold, employee benefit expense, other expenses, financing cost.


 Continue with Email

 Home
Home


