Event Management Dashboard
Hour Glass For Financial Management PowerPoint Templates
Create dynamic presentations with this professional slide containing a graphic of hour glass with dollar currency notes and coins. This template is designed to portray the concepts of financial management. Add this slide in your presentations to visually support your content
Tailored Product Approach Dashboard To Track Website And Application Traffic Structure Pdf
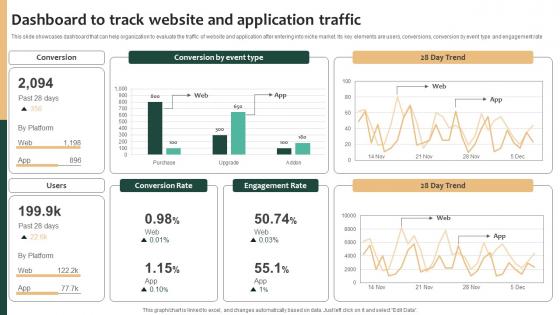
This slide showcases dashboard that can help organization to evaluate the traffic of website and application after entering into niche market. Its key elements are users, conversions, conversion by event type and engagement rate. Do you have to make sure that everyone on your team knows about any specific topic I yes, then you should give Tailored Product Approach Dashboard To Track Website And Application Traffic Structure Pdf a try. Our experts have put a lot of knowledge and effort into creating this impeccable Tailored Product Approach Dashboard To Track Website And Application Traffic Structure Pdf You can use this template for your upcoming presentations, as the slides are perfect to represent even the tiniest detail. You can download these templates from the Slidegeeks website and these are easy to edit. So grab these today This slide showcases dashboard that can help organization to evaluate the traffic of website and application after entering into niche market. Its key elements are users, conversions, conversion by event type and engagement rate

Dashboard To Track Website And Application Traffic Gaining Competitive Advantage And Capturing Guidelines PDF
This slide showcases dashboard that can help organization to evaluate the traffic of website and application after entering into niche market. Its key elements are users, conversions, conversion by event type and engagement rate.Make sure to capture your audiences attention in your business displays with our gratis customizable Dashboard To Track Website And Application Traffic Gaining Competitive Advantage And Capturing Guidelines PDF. These are great for business strategies, office conferences, capital raising or task suggestions. If you desire to acquire more customers for your tech business and ensure they stay satisfied, create your own sales presentation with these plain slides.
IoT Device Management Fundamentals Comparative Analysis Of IoT Device Management Platforms IoT Ss V
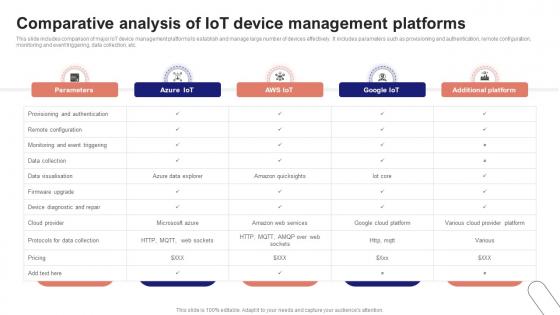
This slide includes comparison of major IoT device management platforms to establish and manage large number of devices effectively. It includes parameters such as provisioning and authentication, remote configuration, monitoring and event triggering, data collection, etc. If your project calls for a presentation, then Slidegeeks is your go-to partner because we have professionally designed, easy-to-edit templates that are perfect for any presentation. After downloading, you can easily edit IoT Device Management Fundamentals Comparative Analysis Of IoT Device Management Platforms IoT SS V and make the changes accordingly. You can rearrange slides or fill them with different images. Check out all the handy templates This slide includes comparison of major IoT device management platforms to establish and manage large number of devices effectively. It includes parameters such as provisioning and authentication, remote configuration, monitoring and event triggering, data collection, etc.

Dashboard To Track Website And Application Traffic Market Focused Product Launch Strategy Elements PDF
This slide showcases dashboard that can help organization to evaluate the traffic of website and application after entering into niche market. Its key elements are users, conversions, conversion by event type and engagement rate. Get a simple yet stunning designed Dashboard To Track Website And Application Traffic Market Focused Product Launch Strategy Elements PDF. It is the best one to establish the tone in your meetings. It is an excellent way to make your presentations highly effective. So, download this PPT today from Slidegeeks and see the positive impacts. Our easy-to-edit Dashboard To Track Website And Application Traffic Market Focused Product Launch Strategy Elements PDF can be your go-to option for all upcoming conferences and meetings. So, what are you waiting for Grab this template today.
Porters Strategies For Targeted Client Segment Dashboard To Track Website And Application Traffic Brochure PDF
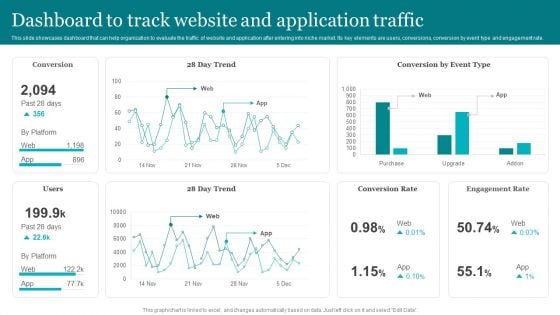
This slide showcases dashboard that can help organization to evaluate the traffic of website and application after entering into niche market. Its key elements are users, conversions, conversion by event type and engagement rate. Here you can discover an assortment of the finest PowerPoint and Google Slides templates. With these templates, you can create presentations for a variety of purposes while simultaneously providing your audience with an eye catching visual experience. Download Porters Strategies For Targeted Client Segment Dashboard To Track Website And Application Traffic Brochure PDF to deliver an impeccable presentation. These templates will make your job of preparing presentations much quicker, yet still, maintain a high level of quality. Slidegeeks has experienced researchers who prepare these templates and write high quality content for you. Later on, you can personalize the content by editing the Porters Strategies For Targeted Client Segment Dashboard To Track Website And Application Traffic Brochure PDF.
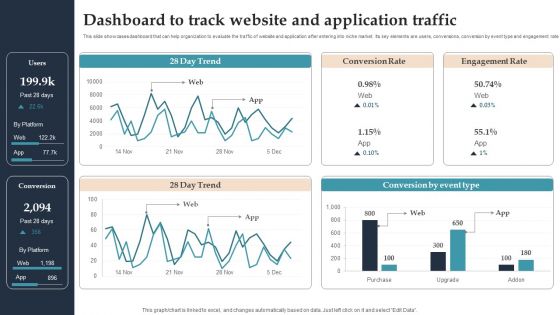
Product Rollout Techniques Dashboard To Track Website And Application Traffic Mockup PDF
This slide showcases dashboard that can help organization to evaluate the traffic of website and application after entering into niche market. Its key elements are users, conversions, conversion by event type and engagement rate. Crafting an eye-catching presentation has never been more straightforward. Let your presentation shine with this tasteful yet straightforward Product Rollout Techniques Dashboard To Track Website And Application Traffic Mockup PDF template. It offers a minimalistic and classy look that is great for making a statement. The colors have been employed intelligently to add a bit of playfulness while still remaining professional. Construct the ideal Product Rollout Techniques Dashboard To Track Website And Application Traffic Mockup PDF that effortlessly grabs the attention of your audience Begin now and be certain to wow your customers.
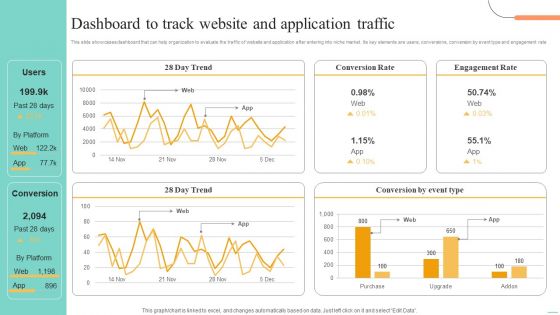
Price Leadership Technique Dashboard To Track Website And Application Traffic Themes PDF
This slide showcases dashboard that can help organization to evaluate the traffic of website and application after entering into niche market. Its key elements are users, conversions, conversion by event type and engagement rate. Here you can discover an assortment of the finest PowerPoint and Google Slides templates. With these templates, you can create presentations for a variety of purposes while simultaneously providing your audience with an eye catching visual experience. Download Price Leadership Technique Dashboard To Track Website And Application Traffic Themes PDF to deliver an impeccable presentation. These templates will make your job of preparing presentations much quicker, yet still, maintain a high level of quality. Slidegeeks has experienced researchers who prepare these templates and write high quality content for you. Later on, you can personalize the content by editing the Price Leadership Technique Dashboard To Track Website And Application Traffic Themes PDF.
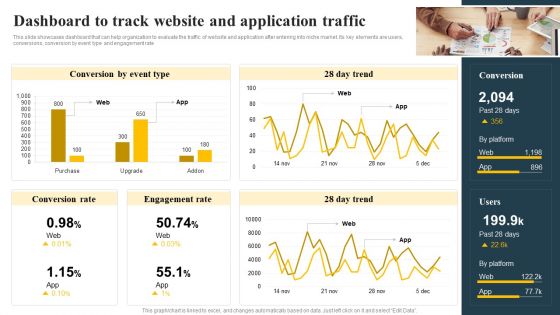
Dashboard To Track Website And Application Traffic Implementing Focus Strategy To Improve Formats PDF
This slide showcases dashboard that can help organization to evaluate the traffic of website and application after entering into niche market. Its key elements are users, conversions, conversion by event type and engagement rate.Do you know about Slidesgeeks Dashboard To Track Website And Application Traffic Implementing Focus Strategy To Improve Formats PDF These are perfect for delivering any kind od presentation. Using it, create PowerPoint presentations that communicate your ideas and engage audiences. Save time and effort by using our pre-designed presentation templates that are perfect for a wide range of topic. Our vast selection of designs covers a range of styles, from creative to business, and are all highly customizable and easy to edit. Download as a PowerPoint template or use them as Google Slides themes.
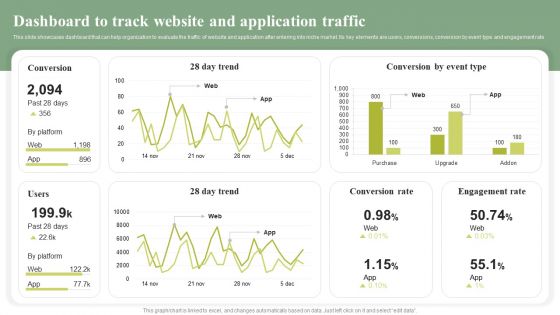
Dashboard To Track Website And Application Traffic Cost Leadership Differentiation Strategy Brochure PDF
This slide showcases dashboard that can help organization to evaluate the traffic of website and application after entering into niche market. Its key elements are users, conversions, conversion by event type and engagement rate. Slidegeeks is one of the best resources for PowerPoint templates. You can download easily and regulate Dashboard To Track Website And Application Traffic Cost Leadership Differentiation Strategy Brochure PDF for your personal presentations from our wonderful collection. A few clicks is all it takes to discover and get the most relevant and appropriate templates. Use our Templates to add a unique zing and appeal to your presentation and meetings. All the slides are easy to edit and you can use them even for advertisement purposes.
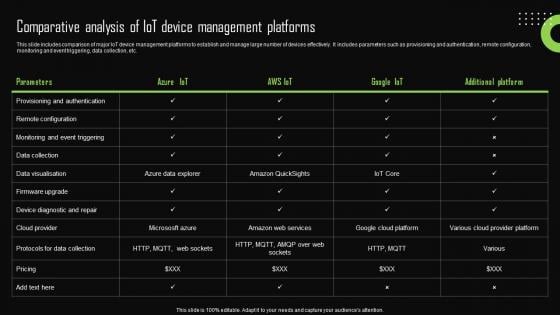
Comparative Analysis Of Iot Device Management Iot Device Management Portrait Pdf
This slide includes comparison of major IoT device management platforms to establish and manage large number of devices effectively. It includes parameters such as provisioning and authentication, remote configuration, monitoring and event triggering, data collection, etc. Find highly impressive Comparative Analysis Of Iot Device Management Iot Device Management Portrait Pdf on Slidegeeks to deliver a meaningful presentation. You can save an ample amount of time using these presentation templates. No need to worry to prepare everything from scratch because Slidegeeks experts have already done a huge research and work for you. You need to download Comparative Analysis Of Iot Device Management Iot Device Management Portrait Pdf for your upcoming presentation. All the presentation templates are 100 percent editable and you can change the color and personalize the content accordingly. Download now This slide includes comparison of major IoT device management platforms to establish and manage large number of devices effectively. It includes parameters such as provisioning and authentication, remote configuration, monitoring and event triggering, data collection, etc.
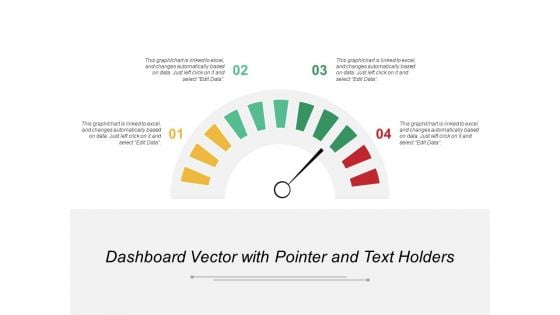
Dashboard Vector With Pointer And Text Holders Ppt PowerPoint Presentation Portfolio Format Ideas
This is a dashboard vector with pointer and text holders ppt powerpoint presentation portfolio format ideas. This is a four stage process. The stages in this process are performance dashboard, performance meter, performance kpi.
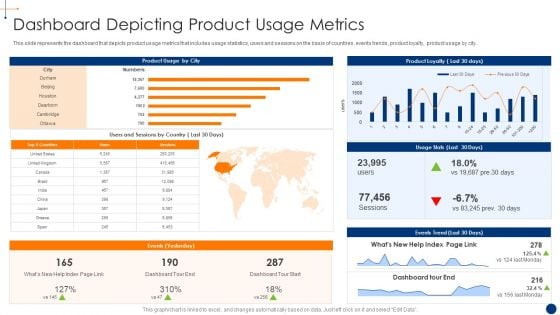
New Product Development Process Optimization Dashboard Depicting Product Usage Structure PDF
This slide represents the dashboard that depicts product usage metrics that includes usage statistics, users and sessions on the basis of countries, events trends, product loyalty, product usage by city.Deliver an awe inspiring pitch with this creative new product development process optimization dashboard depicting product usage structure pdf bundle. Topics like dashboard depicting product usage metrics can be discussed with this completely editable template. It is available for immediate download depending on the needs and requirements of the user.
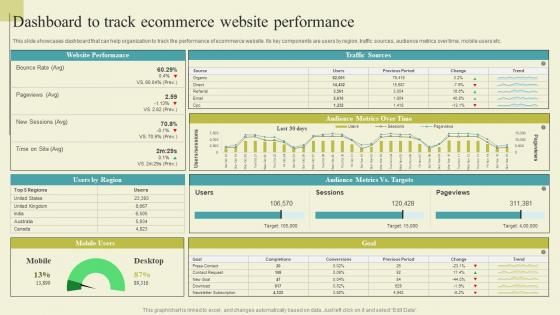
Successful Guide For Ecommerce Promotion Dashboard To Track Ecommerce Website Download Pdf
This slide showcases dashboard that can help organization to track the performance of ecommerce website. Its key components are users by region, traffic sources, audience metrics over time, mobile users etc. If you are looking for a format to display your unique thoughts, then the professionally designed Successful Guide For Ecommerce Promotion Dashboard To Track Ecommerce Website Download Pdf is the one for you. You can use it as a Google Slides template or a PowerPoint template. Incorporate impressive visuals, symbols, images, and other charts. Modify or reorganize the text boxes as you desire. Experiment with shade schemes and font pairings. Alter, share or cooperate with other people on your work. Download Successful Guide For Ecommerce Promotion Dashboard To Track Ecommerce Website Download Pdf and find out how to give a successful presentation. Present a perfect display to your team and make your presentation unforgettable. This slide showcases dashboard that can help organization to track the performance of ecommerce website. Its key components are users by region, traffic sources, audience metrics over time, mobile users etc.
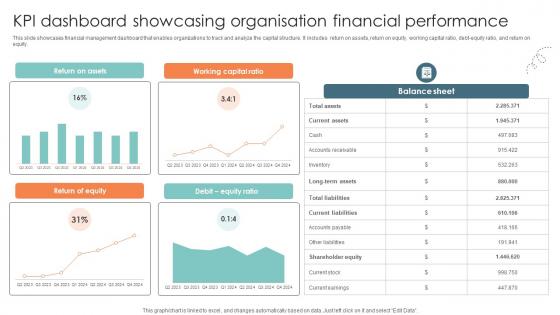
Kpi Dashboard Showcasing Organisation Financial Performance Strategic Approaches To Corporate Financial
This slide showcases financial management dashboard that enables organizations to track and analyze the capital structure. It includes return on assets, return on equity, working capital ratio, debt-equity ratio, and return on equity. This modern and well-arranged Kpi Dashboard Showcasing Organisation Financial Performance Strategic Approaches To Corporate Financial provides lots of creative possibilities. It is very simple to customize and edit with the Powerpoint Software. Just drag and drop your pictures into the shapes. All facets of this template can be edited with Powerpoint, no extra software is necessary. Add your own material, put your images in the places assigned for them, adjust the colors, and then you can show your slides to the world, with an animated slide included. This slide showcases financial management dashboard that enables organizations to track and analyze the capital structure. It includes return on assets, return on equity, working capital ratio, debt-equity ratio, and return on equity.
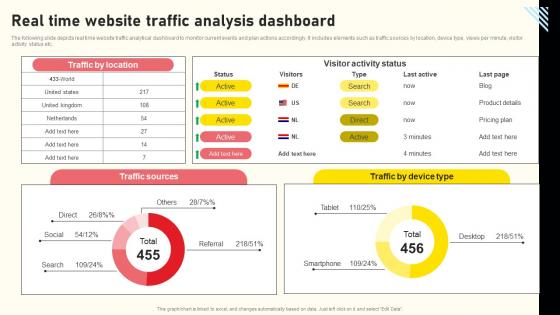
Effective Real Time Marketing Principles Real Time Website Traffic Analysis Dashboard Graphics Pdf
The following slide depicts real time website traffic analytical dashboard to monitor current events and plan actions accordingly. It includes elements such as traffic sources by location, device type, views per minute, visitor activity status etc. Present like a pro with Effective Real Time Marketing Principles Real Time Website Traffic Analysis Dashboard Graphics Pdf Create beautiful presentations together with your team, using our easy-to-use presentation slides. Share your ideas in real-time and make changes on the fly by downloading our templates. So whether you are in the office, on the go, or in a remote location, you can stay in sync with your team and present your ideas with confidence. With Slidegeeks presentation got a whole lot easier. Grab these presentations today. The following slide depicts real time website traffic analytical dashboard to monitor current events and plan actions accordingly. It includes elements such as traffic sources by location, device type, views per minute, visitor activity status etc.
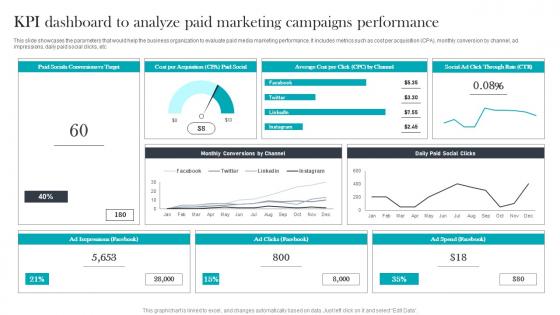
KPI Dashboard To Analyze Paid Media Advertising For Optimizing Customer Brochure Pdf
This slide showcases the parameters that would help the business organization to evaluate paid media marketing performance. It includes metrics such as cost per acquisition CPA, monthly conversion by channel, ad impressions, daily paid social clicks, etc Make sure to capture your audiences attention in your business displays with our gratis customizable KPI Dashboard To Analyze Paid Media Advertising For Optimizing Customer Brochure Pdf. These are great for business strategies, office conferences, capital raising or task suggestions. If you desire to acquire more customers for your tech business and ensure they stay satisfied, create your own sales presentation with these plain slides. This slide showcases the parameters that would help the business organization to evaluate paid media marketing performance. It includes metrics such as cost per acquisition CPA, monthly conversion by channel, ad impressions, daily paid social clicks, etc
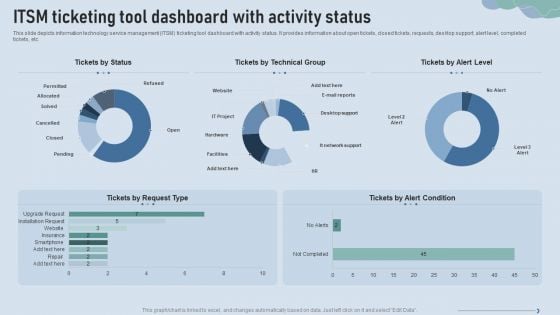
Improve IT Service Desk ITSM Ticketing Tool Dashboard With Activity Status Brochure PDF
This slide depicts information technology service management ITSM ticketing tool dashboard with activity status. It provides information about open tickets, closed tickets, requests, desktop support, alert level, completed tickets, etc. Deliver an awe inspiring pitch with this creative Improve IT Service Desk ITSM Ticketing Tool Dashboard With Activity Status Brochure PDF bundle. Topics like Alert Condition, Installation Request, Upgrade Request can be discussed with this completely editable template. It is available for immediate download depending on the needs and requirements of the user.
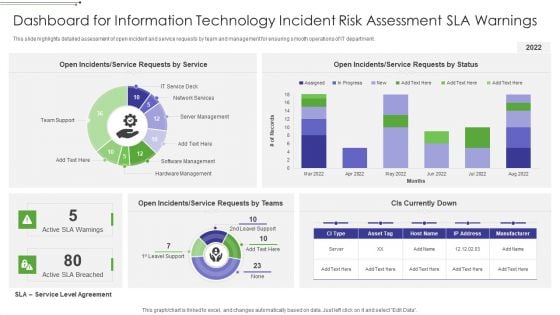
Dashboard For Information Technology Incident Risk Assessment SLA Warnings Sample PDF
This slide highlights detailed assessment of open incident and service requests by team and management for ensuring smooth operations of IT department.Showcasing this set of slides titled Dashboard For Information Technology Incident Risk Assessment SLA Warnings Sample PDF The topics addressed in these templates are Open Incidents, Requests By Service, Open Incidents All the content presented in this PPT design is completely editable. Download it and make adjustments in color, background, font etc. as per your unique business setting.
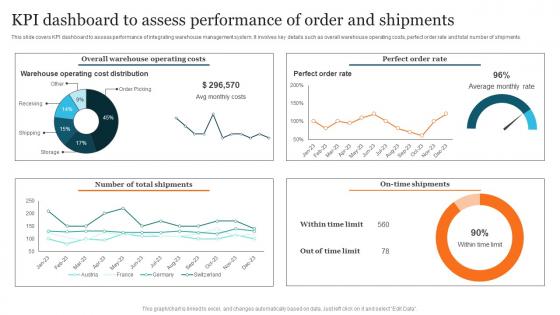
KPI Dashboard Assess Performance Advanced Supply Chain Improvement Strategies Brochure Pdf
This slide covers KPI dashboard to assess performance of integrating warehouse management system. It involves key details such as overall warehouse operating costs, perfect order rate and total number of shipments. If you are looking for a format to display your unique thoughts, then the professionally designed KPI Dashboard Assess Performance Advanced Supply Chain Improvement Strategies Brochure Pdf is the one for you. You can use it as a Google Slides template or a PowerPoint template. Incorporate impressive visuals, symbols, images, and other charts. Modify or reorganize the text boxes as you desire. Experiment with shade schemes and font pairings. Alter, share or cooperate with other people on your work. Download KPI Dashboard Assess Performance Advanced Supply Chain Improvement Strategies Brochure Pdf and find out how to give a successful presentation. Present a perfect display to your team and make your presentation unforgettable. This slide covers KPI dashboard to assess performance of integrating warehouse management system. It involves key details such as overall warehouse operating costs, perfect order rate and total number of shipments.

Dashboard Analytics Measuring Supply Chain Efficiency Optimizing Retail Operations With Digital DT SS V
This slide represents a supply chain management dashboard measuring the efficiency of supply chain operations after effective digital transformation of retail operations. It includes inventory to sales, inventory turnover, carrying cost of inventory, inventory accuracy, and percentage out of stock items.If you are looking for a format to display your unique thoughts, then the professionally designed Dashboard Analytics Measuring Supply Chain Efficiency Optimizing Retail Operations With Digital DT SS V is the one for you. You can use it as a Google Slides template or a PowerPoint template. Incorporate impressive visuals, symbols, images, and other charts. Modify or reorganize the text boxes as you desire. Experiment with shade schemes and font pairings. Alter, share or cooperate with other people on your work. Download Dashboard Analytics Measuring Supply Chain Efficiency Optimizing Retail Operations With Digital DT SS V and find out how to give a successful presentation. Present a perfect display to your team and make your presentation unforgettable. This slide represents a supply chain management dashboard measuring the efficiency of supply chain operations after effective digital transformation of retail operations. It includes inventory to sales, inventory turnover, carrying cost of inventory, inventory accuracy, and percentage out of stock items.
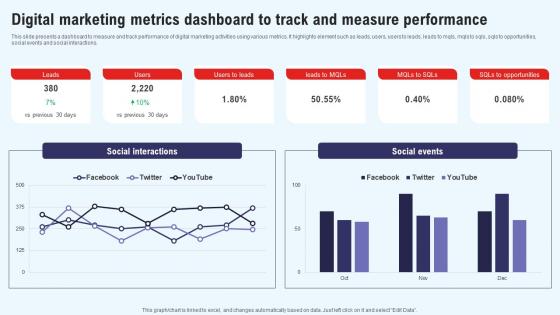
Efficient Marketing Process For Business Digital Marketing Metrics Dashboard To Track Professional Pdf
This slide presents a dashboard to measure and track performance of digital marketing activities using various metrics. It highlights element such as leads, users, users to leads, leads to mqls, mqls to sqls, sqls to opportunities, social events and social interactions. Whether you have daily or monthly meetings, a brilliant presentation is necessary. Efficient Marketing Process For Business Digital Marketing Metrics Dashboard To Track Professional Pdf can be your best option for delivering a presentation. Represent everything in detail using Efficient Marketing Process For Business Digital Marketing Metrics Dashboard To Track Professional Pdf and make yourself stand out in meetings. The template is versatile and follows a structure that will cater to your requirements. All the templates prepared by Slidegeeks are easy to download and edit. Our research experts have taken care of the corporate themes as well. So, give it a try and see the results. This slide presents a dashboard to measure and track performance of digital marketing activities using various metrics. It highlights element such as leads, users, users to leads, leads to mqls, mqls to sqls, sqls to opportunities, social events and social interactions.
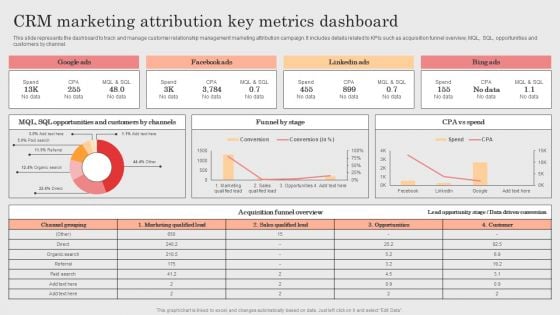
Integrating CRM Solution To Acquire Potential Customers CRM Marketing Attribution Key Metrics Dashboard Template PDF
This slide represents the dashboard to track and manage customer relationship management marketing attribution campaign. It includes details related to KPIs such as acquisition funnel overview, MQL, SQL, opportunities and customers by channel. Are you in need of a template that can accommodate all of your creative concepts This one is crafted professionally and can be altered to fit any style. Use it with Google Slides or PowerPoint. Include striking photographs, symbols, depictions, and other visuals. Fill, move around, or remove text boxes as desired. Test out color palettes and font mixtures. Edit and save your work, or work with colleagues. Download Integrating CRM Solution To Acquire Potential Customers CRM Marketing Attribution Key Metrics Dashboard Template PDF and observe how to make your presentation outstanding. Give an impeccable presentation to your group and make your presentation unforgettable.
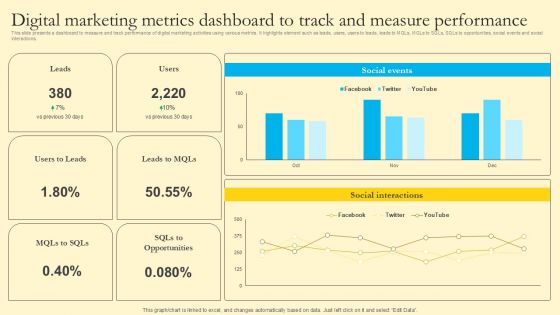
Comprehensive Guide For Sales And Advertising Processes Digital Marketing Metrics Dashboard To Track Measure Clipart PDF
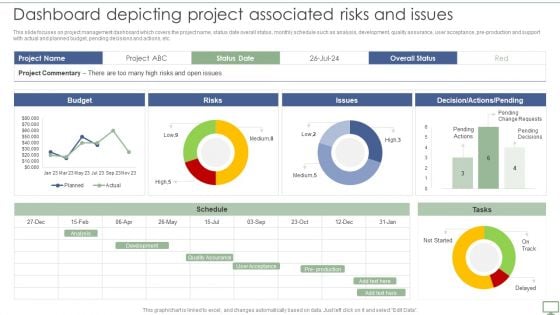
Procedure To Establish Project Administration Program Dashboard Depicting Project Associated Risks And Issues Mockup PDF
This slide focuses on project management dashboard which covers the project name, status date overall status, monthly schedule such as analysis, development, quality assurance, user acceptance, pre production and support with actual and planned budget, pending decisions and actions, etc. Get a simple yet stunning designed Procedure To Establish Project Administration Program Dashboard Depicting Project Associated Risks And Issues Mockup PDF. It is the best one to establish the tone in your meetings. It is an excellent way to make your presentations highly effective. So, download this PPT today from Slidegeeks and see the positive impacts. Our easy to edit Procedure To Establish Project Administration Program Dashboard Depicting Project Associated Risks And Issues Mockup PDF can be your go to option for all upcoming conferences and meetings. So, what are you waiting for. Grab this template today.
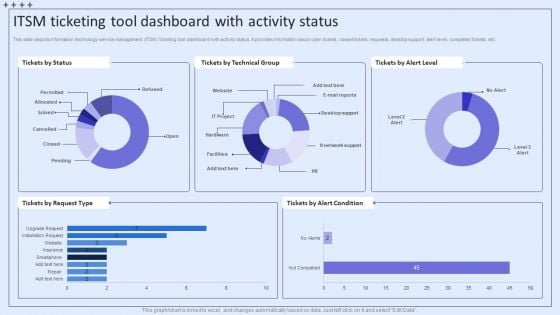
Integrating ITSM To Enhance Service Itsm Ticketing Tool Dashboard With Activity Status Microsoft PDF
This slide depicts information technology service management ITSM ticketing tool dashboard with activity status. It provides information about open tickets, closed tickets, requests, desktop support, alert level, completed tickets, etc. Crafting an eye-catching presentation has never been more straightforward. Let your presentation shine with this tasteful yet straightforward Integrating ITSM To Enhance Service Itsm Ticketing Tool Dashboard With Activity Status Microsoft PDF template. It offers a minimalistic and classy look that is great for making a statement. The colors have been employed intelligently to add a bit of playfulness while still remaining professional. Construct the ideal Integrating ITSM To Enhance Service Itsm Ticketing Tool Dashboard With Activity Status Microsoft PDF that effortlessly grabs the attention of your audience Begin now and be certain to wow your customers.
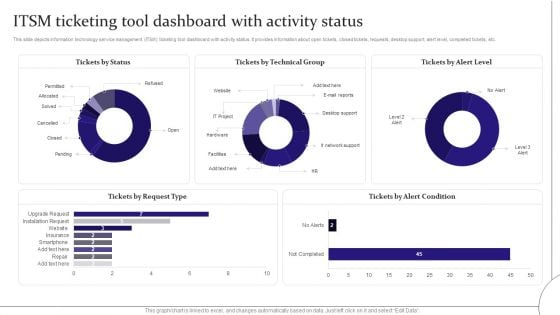
Digitalization Of Service Desk ITSM Ticketing Tool Dashboard With Activity Status Ppt Inspiration Model PDF
This slide depicts information technology service management ITSM ticketing tool dashboard with activity status. It provides information about open tickets, closed tickets, requests, desktop support, alert level, completed tickets, etc. Crafting an eye-catching presentation has never been more straightforward. Let your presentation shine with this tasteful yet straightforward Digitalization Of Service Desk ITSM Ticketing Tool Dashboard With Activity Status Ppt Inspiration Model PDF template. It offers a minimalistic and classy look that is great for making a statement. The colors have been employed intelligently to add a bit of playfulness while still remaining professional. Construct the ideal Digitalization Of Service Desk ITSM Ticketing Tool Dashboard With Activity Status Ppt Inspiration Model PDF that effortlessly grabs the attention of your audience Begin now and be certain to wow your customers.
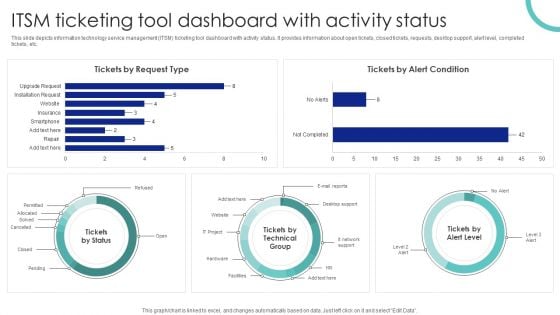
ITSM Ticketing Tool Dashboard With Activity Status Ppt PowerPoint Presentation File Diagrams PDF
This slide depicts information technology service management ITSM ticketing tool dashboard with activity status. It provides information about open tickets, closed tickets, requests, desktop support, alert level, completed tickets, etc. Crafting an eye catching presentation has never been more straightforward. Let your presentation shine with this tasteful yet straightforward ITSM Ticketing Tool Dashboard With Activity Status Ppt PowerPoint Presentation File Diagrams PDF template. It offers a minimalistic and classy look that is great for making a statement. The colors have been employed intelligently to add a bit of playfulness while still remaining professional. Construct the ideal ITSM Ticketing Tool Dashboard With Activity Status Ppt PowerPoint Presentation File Diagrams PDF that effortlessly grabs the attention of your audience Begin now and be certain to wow your customers.
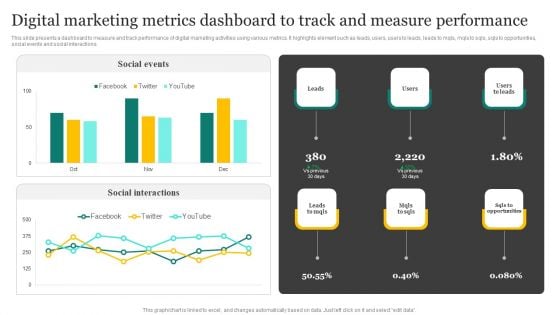
Strategic Promotion Plan Development Stages Digital Marketing Metrics Dashboard To Track Structure PDF
This slide presents a dashboard to measure and track performance of digital marketing activities using various metrics. It highlights element such as leads, users, users to leads, leads to mqls, mqls to sqls, sqls to opportunities, social events and social interactions. Are you in need of a template that can accommodate all of your creative concepts This one is crafted professionally and can be altered to fit any style. Use it with Google Slides or PowerPoint. Include striking photographs, symbols, depictions, and other visuals. Fill, move around, or remove text boxes as desired. Test out color palettes and font mixtures. Edit and save your work, or work with colleagues. Download Strategic Promotion Plan Development Stages Digital Marketing Metrics Dashboard To Track Structure PDF and observe how to make your presentation outstanding. Give an impeccable presentation to your group and make your presentation unforgettable.
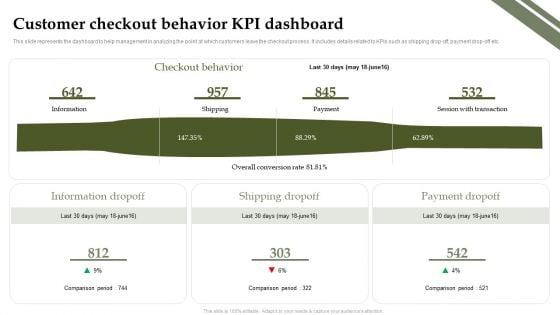
Analyzing And Deploying Effective CMS Customer Checkout Behavior KPI Dashboard Elements PDF
This slide represents the dashboard to help management in analyzing the point at which customers leave the checkout process. It includes details related to KPIs such as shipping drop off, payment drop off etc. If you are looking for a format to display your unique thoughts, then the professionally designed Analyzing And Deploying Effective CMS Customer Checkout Behavior KPI Dashboard Elements PDF is the one for you. You can use it as a Google Slides template or a PowerPoint template. Incorporate impressive visuals, symbols, images, and other charts. Modify or reorganize the text boxes as you desire. Experiment with shade schemes and font pairings. Alter, share or cooperate with other people on your work. Download Analyzing And Deploying Effective CMS Customer Checkout Behavior KPI Dashboard Elements PDF and find out how to give a successful presentation. Present a perfect display to your team and make your presentation unforgettable.
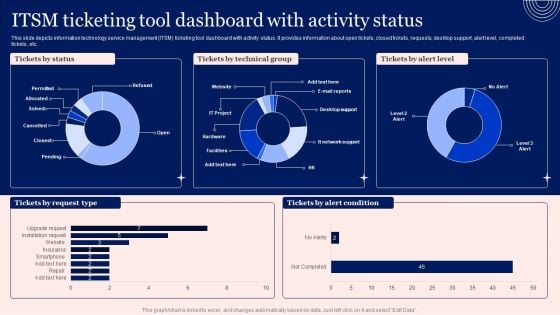
Implementing Advanced Service Help Desk Administration Program ITSM Ticketing Tool Dashboard With Activity Status Portrait PDF
This slide depicts information technology service management ITSM ticketing tool dashboard with activity status. It provides information about open tickets, closed tickets, requests, desktop support, alert level, completed tickets, etc. Are you in need of a template that can accommodate all of your creative concepts This one is crafted professionally and can be altered to fit any style. Use it with Google Slides or PowerPoint. Include striking photographs, symbols, depictions, and other visuals. Fill, move around, or remove text boxes as desired. Test out color palettes and font mixtures. Edit and save your work, or work with colleagues. Download Implementing Advanced Service Help Desk Administration Program ITSM Ticketing Tool Dashboard With Activity Status Portrait PDF and observe how to make your presentation outstanding. Give an impeccable presentation to your group and make your presentation unforgettable.

Three Dashboard Speed Indicators With Text Holders Ppt PowerPoint Presentation Summary Layout
This is a three dashboard speed indicators with text holders ppt powerpoint presentation summary layout. This is a three stage process. The stages in this process are fuel gauge, gas gauge, fuel containers.
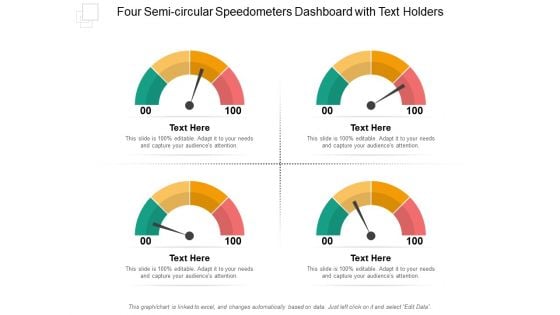
Four Semi Circular Speedometers Dashboard With Text Holders Ppt PowerPoint Presentation File Layouts
This is a four semi circular speedometers dashboard with text holders ppt powerpoint presentation file layouts. This is a four stage process. The stages in this process are fuel gauge, gas gauge, fuel containers.

Dashboard To Track Binary Multi Level Marketing Progress Multi Level Marketing Infographics Pdf
This slide represents metric dashboard that helps marketers in tracking and managing binary network marketing. It covers KPIs such as network bonus, expenditure, profit etc. Are you in need of a template that can accommodate all of your creative concepts This one is crafted professionally and can be altered to fit any style. Use it with Google Slides or PowerPoint. Include striking photographs, symbols, depictions, and other visuals. Fill, move around, or remove text boxes as desired. Test out color palettes and font mixtures. Edit and save your work, or work with colleagues. Download Dashboard To Track Binary Multi Level Marketing Progress Multi Level Marketing Infographics Pdf and observe how to make your presentation outstanding. Give an impeccable presentation to your group and make your presentation unforgettable. This slide represents metric dashboard that helps marketers in tracking and managing binary network marketing. It covers KPIs such as network bonus, expenditure, profit etc.
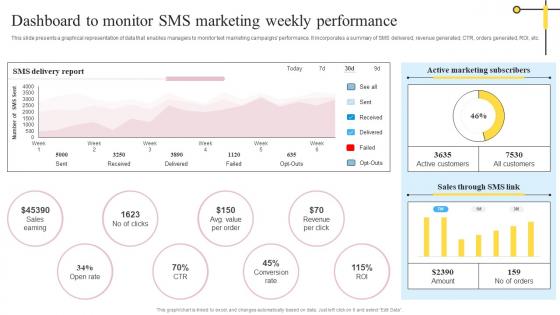
Dashboard To Monitor SMS Marketing Weekly Definitive Guide On Mass Advertising Inspiration Pdf
This slide presents a graphical representation of data that enables managers to monitor text marketing campaigns performance. It incorporates a summary of SMS delivered, revenue generated, CTR, orders generated, ROI, etc. Get a simple yet stunning designed Dashboard To Monitor SMS Marketing Weekly Definitive Guide On Mass Advertising Inspiration Pdf. It is the best one to establish the tone in your meetings. It is an excellent way to make your presentations highly effective. So, download this PPT today from Slidegeeks and see the positive impacts. Our easy-to-edit Dashboard To Monitor SMS Marketing Weekly Definitive Guide On Mass Advertising Inspiration Pdf can be your go-to option for all upcoming conferences and meetings. So, what are you waiting for Grab this template today. This slide presents a graphical representation of data that enables managers to monitor text marketing campaigns performance. It incorporates a summary of SMS delivered, revenue generated, CTR, orders generated, ROI, etc.
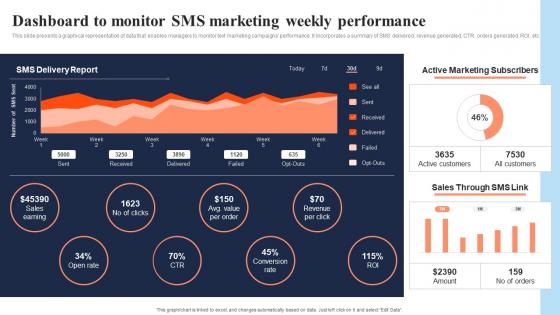
Dashboard To Monitor SMS Marketing Weekly Performance In Depth Overview Of Mass Rules Pdf
This slide presents a graphical representation of data that enables managers to monitor text marketing campaigns performance. It incorporates a summary of SMS delivered, revenue generated, CTR, orders generated, ROI, etc. Get a simple yet stunning designed Dashboard To Monitor SMS Marketing Weekly Performance In Depth Overview Of Mass Rules Pdf It is the best one to establish the tone in your meetings. It is an excellent way to make your presentations highly effective. So, download this PPT today from Slidegeeks and see the positive impacts. Our easy-to-edit Dashboard To Monitor SMS Marketing Weekly Performance In Depth Overview Of Mass Rules Pdf can be your go-to option for all upcoming conferences and meetings. So, what are you waiting for Grab this template today. This slide presents a graphical representation of data that enables managers to monitor text marketing campaigns performance. It incorporates a summary of SMS delivered, revenue generated, CTR, orders generated, ROI, etc.

Brand Extension Techniques KPI Dashboard To Track Product Performance Strategy SS V
This slide represents KPI dashboard for measuring product performance. It covers total activities, new customers, events, net promoter score. Formulating a presentation can take up a lot of effort and time, so the content and message should always be the primary focus. The visuals of the PowerPoint can enhance the presenters message, so our Brand Extension Techniques KPI Dashboard To Track Product Performance Strategy SS V was created to help save time. Instead of worrying about the design, the presenter can concentrate on the message while our designers work on creating the ideal templates for whatever situation is needed. Slidegeeks has experts for everything from amazing designs to valuable content, we have put everything into Brand Extension Techniques KPI Dashboard To Track Product Performance Strategy SS V This slide represents KPI dashboard for measuring product performance. It covers total activities, new customers, events, net promoter score.
Facebook Marketing Plan Dashboard For Tracking Facebook Post Performance Strategy SS V
Facebook Marketing Techniques Dashboard For Tracking Facebook Post Strategy SS V
The following slide outlines dashboard through which advertisers can manage Facebook post performance and optimize their marketing strategy. Information covered in this slide is related to key metrics such as impressions per post, engagement rate, click-through rate CTR , likes, etc. If you are looking for a format to display your unique thoughts, then the professionally designed Facebook Marketing Techniques Dashboard For Tracking Facebook Post Strategy SS V is the one for you. You can use it as a Google Slides template or a PowerPoint template. Incorporate impressive visuals, symbols, images, and other charts. Modify or reorganize the text boxes as you desire. Experiment with shade schemes and font pairings. Alter, share or cooperate with other people on your work. Download Facebook Marketing Techniques Dashboard For Tracking Facebook Post Strategy SS V and find out how to give a successful presentation. Present a perfect display to your team and make your presentation unforgettable. The following slide outlines dashboard through which advertisers can manage Facebook post performance and optimize their marketing strategy. Information covered in this slide is related to key metrics such as impressions per post, engagement rate, click-through rate CTR , likes, etc.
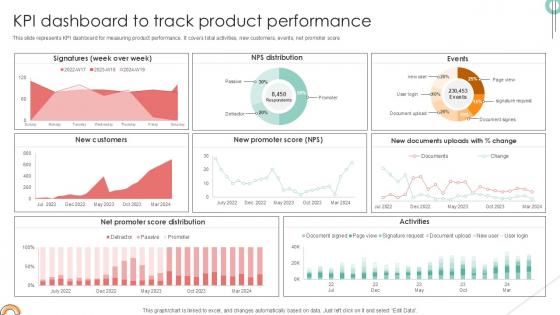
KPI Dashboard To Track Implementing Product Diversification PPT Presentation Strategy SS V
This slide represents KPI dashboard for measuring product performance. It covers total activities, new customers, events, net promoter score. This modern and well-arranged KPI Dashboard To Track Implementing Product Diversification PPT Presentation Strategy SS V provides lots of creative possibilities. It is very simple to customize and edit with the Powerpoint Software. Just drag and drop your pictures into the shapes. All facets of this template can be edited with Powerpoint, no extra software is necessary. Add your own material, put your images in the places assigned for them, adjust the colors, and then you can show your slides to the world, with an animated slide included. This slide represents KPI dashboard for measuring product performance. It covers total activities, new customers, events, net promoter score
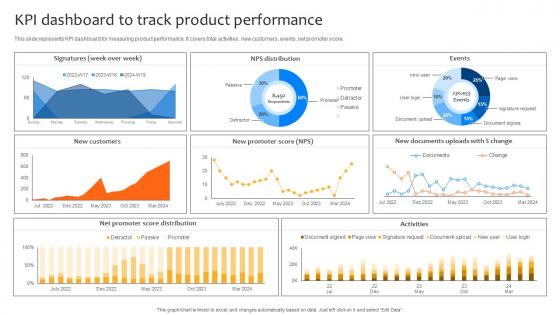
Deploying Strategies For Business KPI Dashboard To Track Product Performance Strategy SS V
This slide represents KPI dashboard for measuring product performance. It covers total activities, new customers, events, net promoter score. Coming up with a presentation necessitates that the majority of the effort goes into the content and the message you intend to convey. The visuals of a PowerPoint presentation can only be effective if it supplements and supports the story that is being told. Keeping this in mind our experts created Deploying Strategies For Business KPI Dashboard To Track Product Performance Strategy SS V to reduce the time that goes into designing the presentation. This way, you can concentrate on the message while our designers take care of providing you with the right template for the situation. This slide represents KPI dashboard for measuring product performance. It covers total activities, new customers, events, net promoter score.
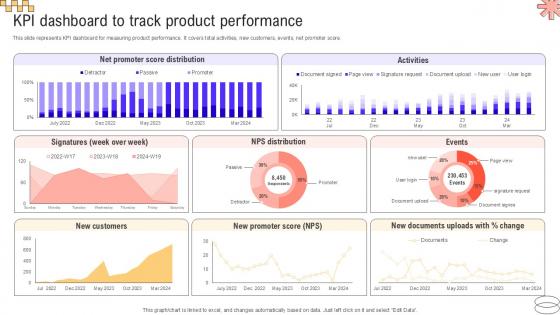
KPI Dashboard To Track Product Implementing Geographic Extension PPT Example Strategy SS V
This slide represents KPI dashboard for measuring product performance. It covers total activities, new customers, events, net promoter score. Coming up with a presentation necessitates that the majority of the effort goes into the content and the message you intend to convey. The visuals of a PowerPoint presentation can only be effective if it supplements and supports the story that is being told. Keeping this in mind our experts created KPI Dashboard To Track Product Implementing Geographic Extension PPT Example Strategy SS V to reduce the time that goes into designing the presentation. This way, you can concentrate on the message while our designers take care of providing you with the right template for the situation. This slide represents KPI dashboard for measuring product performance. It covers total activities, new customers, events, net promoter score.
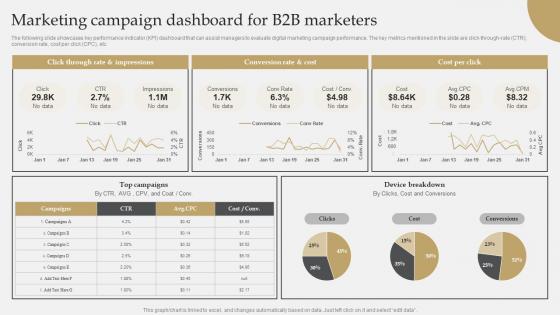
IT Industry Market Research Marketing Campaign Dashboard For B2b Marketers Demonstration Pdf
The following slide showcases key performance indicator KPI dashboard that can assist managers to evaluate digital marketing campaign performance. The key metrics mentioned in the slide are click-through-rate CTR, conversion rate, cost per click CPC, etc. Are you in need of a template that can accommodate all of your creative concepts This one is crafted professionally and can be altered to fit any style. Use it with Google Slides or PowerPoint. Include striking photographs, symbols, depictions, and other visuals. Fill, move around, or remove text boxes as desired. Test out color palettes and font mixtures. Edit and save your work, or work with colleagues. Download IT Industry Market Research Marketing Campaign Dashboard For B2b Marketers Demonstration Pdf and observe how to make your presentation outstanding. Give an impeccable presentation to your group and make your presentation unforgettable. The following slide showcases key performance indicator KPI dashboard that can assist managers to evaluate digital marketing campaign performance. The key metrics mentioned in the slide are click-through-rate CTR, conversion rate, cost per click CPC, etc.
Analytics Dashboard Tracking Effective Digital Transformation Journey PPT Presentation DT SS V
This slide represents an analytics dashboard for effective energy monitoring and management. It tracks KPIs such as energy production, solar energy production, savings, energy produced, carbon savings, and financial savings. Get a simple yet stunning designed Analytics Dashboard Tracking Effective Digital Transformation Journey PPT Presentation DT SS V. It is the best one to establish the tone in your meetings. It is an excellent way to make your presentations highly effective. So, download this PPT today from Slidegeeks and see the positive impacts. Our easy-to-edit Analytics Dashboard Tracking Effective Digital Transformation Journey PPT Presentation DT SS V can be your go-to option for all upcoming conferences and meetings. So, what are you waiting for Grab this template today. This slide represents an analytics dashboard for effective energy monitoring and management. It tracks KPIs such as energy production, solar energy production, savings, energy produced, carbon savings, and financial savings.
Developing Firm Security Strategy Plan Security Incidents Tracking Dashboard Alerts Graphics PDF
This slide portrays information regarding the dashboard that firm will track various incidents detected. These incidents will be managed in order to avoid security risks. Presenting developing firm security strategy plan security incidents tracking dashboard alerts graphics pdf to provide visual cues and insights. Share and navigate important information on eight stages that need your due attention. This template can be used to pitch topics like application whitelisting, patch applications, patch operating systems, restrict admin privileges. In addtion, this PPT design contains high resolution images, graphics, etc, that are easily editable and available for immediate download.
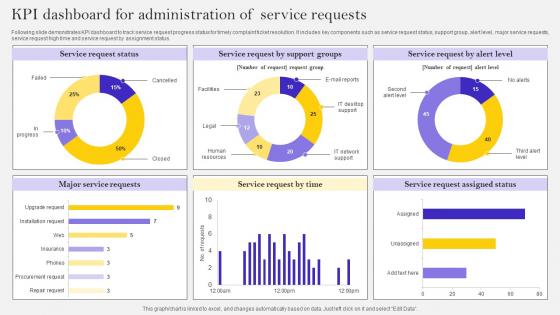
KPI Dashboard For Administration Of Service Requests Ppt Show Inspiration Pdf
Following slide demonstrates KPI dashboard to track service request progress status for timely complaint ticket resolution. It includes key components such as service request status, support group, alert level, major service requests, service request high time and service request by assignment status. Showcasing this set of slides titled KPI Dashboard For Administration Of Service Requests Ppt Show Inspiration Pdf. The topics addressed in these templates are Major Service Requests, Service Request, High Time. All the content presented in this PPT design is completely editable. Download it and make adjustments in color, background, font etc. as per your unique business setting. Following slide demonstrates KPI dashboard to track service request progress status for timely complaint ticket resolution. It includes key components such as service request status, support group, alert level, major service requests, service request high time and service request by assignment status.
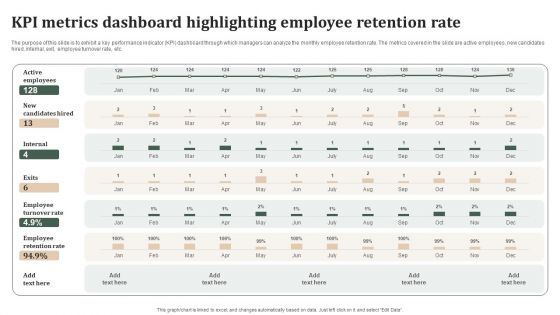
Successful Staff Retention Techniques KPI Metrics Dashboard Highlighting Employee Retention Rate Pictures PDF
The purpose of this slide is to exhibit a key performance indicator KPI dashboard through which managers can analyze the monthly employee retention rate. The metrics covered in the slide are active employees, new candidates hired, internal, exit, employee turnover rate, etc. Make sure to capture your audiences attention in your business displays with our gratis customizable Successful Staff Retention Techniques KPI Metrics Dashboard Highlighting Employee Retention Rate Pictures PDF. These are great for business strategies, office conferences, capital raising or task suggestions. If you desire to acquire more customers for your tech business and ensure they stay satisfied, create your own sales presentation with these plain slides.
Market Evaluation Of IT Industry Marketing Campaign Dashboard For B2b Marketers Icons PDF
The following slide showcases key performance indicator KPI dashboard that can assist managers to evaluate digital marketing campaign performance. The key metrics mentioned in the slide are click through rate CTR, conversion rate, cost per click CPC, etc. Make sure to capture your audiences attention in your business displays with our gratis customizable Market Evaluation Of IT Industry Marketing Campaign Dashboard For B2b Marketers Icons PDF. These are great for business strategies, office conferences, capital raising or task suggestions. If you desire to acquire more customers for your tech business and ensure they stay satisfied, create your own sales presentation with these plain slides.
Monthly Sales KPI Dashboard For Tracking Brand Recommendation Progress Background PDF
Following slide demonstrates key performance indicator dashboard for tracking monthly sales to monitor business performance. It includes components such as monthly execution cost, sales, state wise events, Brand market, and programs. Showcasing this set of slides titled Monthly Sales KPI Dashboard For Tracking Brand Recommendation Progress Background PDF. The topics addressed in these templates are Products Sold, Engagements, Events, Active Markets, Sampled, Attendance. All the content presented in this PPT design is completely editable. Download it and make adjustments in color, background, font etc. as per your unique business setting.
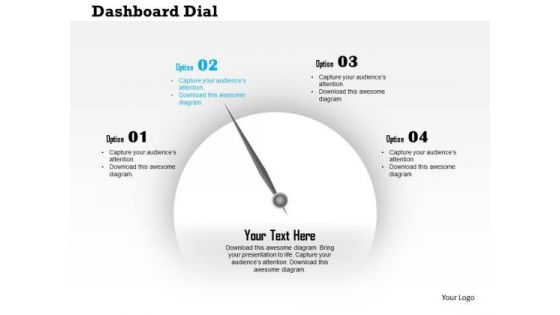
Business Diagram Dashboard With Pointer And Text Boxes For Process Control Presentation Template
This business diagram displays graphic of dashboard with pointer and text boxes. This slide helps to depict concept of business process and management. Present your views using this innovative slide and be assured of leaving a lasting impression.
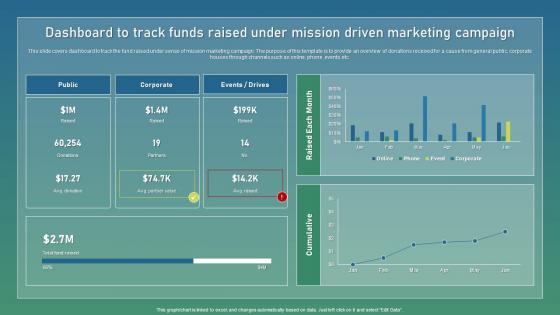
Dashboard To Track Funds Raised Strategic Guide For Sustainable Inspiration Pdf
This slide covers dashboard to track the fund raised under sense of mission marketing campaign. The purpose of this template is to provide an overview of donations received for a cause from general public, corporate houses through channels such as online, phone, events,etc. Find highly impressive Dashboard To Track Funds Raised Strategic Guide For Sustainable Inspiration Pdf on Slidegeeks to deliver a meaningful presentation. You can save an ample amount of time using these presentation templates. No need to worry to prepare everything from scratch because Slidegeeks experts have already done a huge research and work for you. You need to download Dashboard To Track Funds Raised Strategic Guide For Sustainable Inspiration Pdf for your upcoming presentation. All the presentation templates are 100 percent editable and you can change the color and personalize the content accordingly. Download now. This slide covers dashboard to track the fund raised under sense of mission marketing campaign. The purpose of this template is to provide an overview of donations received for a cause from general public, corporate houses through channels such as online, phone, events,etc.
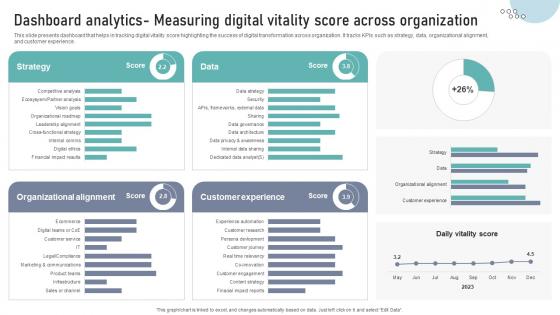
Dashboard Analytics Measuring Digital Vitality Score Across Organization DT SS V
This slide presents dashboard that helps in tracking digital vitality score highlighting the success of digital transformation across organization. It tracks KPIs such as strategy, data, organizational alignment,and customer experience.Make sure to capture your audiences attention in your business displays with our gratis customizable Dashboard Analytics Measuring Digital Vitality Score Across Organization DT SS V. These are great for business strategies, office conferences, capital raising or task suggestions. If you desire to acquire more customers for your tech business and ensure they stay satisfied, create your own sales presentation with these plain slides. This slide presents dashboard that helps in tracking digital vitality score highlighting the success of digital transformation across organization. It tracks KPIs such as strategy, data, organizational alignment,and customer experience.
Professional Scrum Master Training IT Risk Monitoring Dashboard For Software Development Projects Icons PDF
Following slide displays risk monitoring KPI dashboard that can be used by a firm to track multiple risk events. Metrics covered in the dashboard are residual risk by period and category by total risk rating. Deliver an awe inspiring pitch with this creative professional scrum master training it risk monitoring dashboard for software development projects icons pdf bundle. Topics like financial risk, people risk, governance risk, competitive risk, system or technology can be discussed with this completely editable template. It is available for immediate download depending on the needs and requirements of the user.
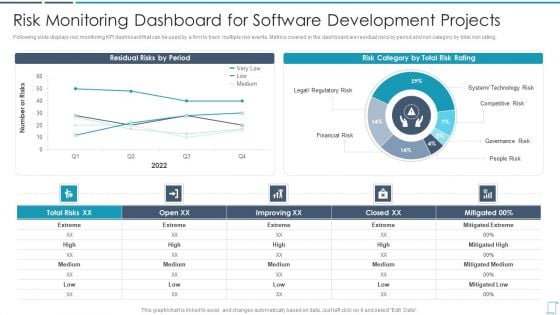
Professional Scrum Master Certification Training Program IT Risk Monitoring Dashboard Background PDF
Following slide displays risk monitoring KPI dashboard that can be used by a firm to track multiple risk events. Metrics covered in the dashboard are residual risks by period and risk category by total risk rating.Deliver an awe inspiring pitch with this creative professional scrum master certification training program it risk monitoring dashboard background pdf bundle. Topics like competitive risk, governance risk, people risk can be discussed with this completely editable template. It is available for immediate download depending on the needs and requirements of the user.
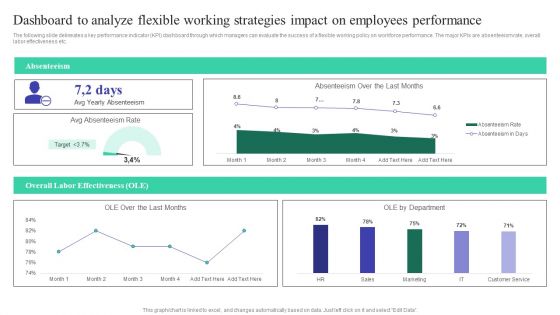
Dashboard To Analyze Flexible Working Strategies Impact On Employees Performance Professional PDF
The following slide delineates a key performance indicator KPI dashboard through which managers can evaluate the success of a flexible working policy on workforce performance. The major KPIs are absenteeism rate, overall labor effectiveness etc. If you are looking for a format to display your unique thoughts, then the professionally designed Dashboard To Analyze Flexible Working Strategies Impact On Employees Performance Professional PDF is the one for you. You can use it as a Google Slides template or a PowerPoint template. Incorporate impressive visuals, symbols, images, and other charts. Modify or reorganize the text boxes as you desire. Experiment with shade schemes and font pairings. Alter, share or cooperate with other people on your work. Download Dashboard To Analyze Flexible Working Strategies Impact On Employees Performance Professional PDF and find out how to give a successful presentation. Present a perfect display to your team and make your presentation unforgettable.
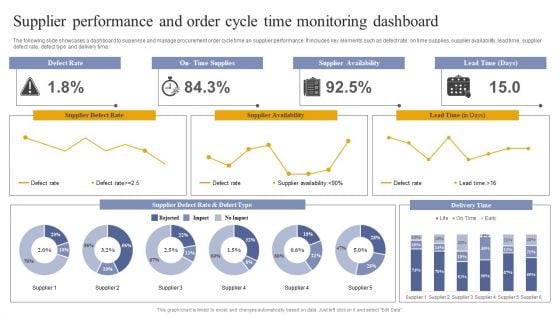
Vendor Performance Analysis And Administration Supplier Performance And Order Cycle Time Monitoring Dashboard Themes PDF
The following slide showcases a dashboard to supervise and manage procurement order cycle time an supplier performance. It includes key elements such as defect rate, on time supplies, supplier availability, lead time, supplier defect rate, defect type and delivery time. If you are looking for a format to display your unique thoughts, then the professionally designed Vendor Performance Analysis And Administration Supplier Performance And Order Cycle Time Monitoring Dashboard Themes PDF is the one for you. You can use it as a Google Slides template or a PowerPoint template. Incorporate impressive visuals, symbols, images, and other charts. Modify or reorganize the text boxes as you desire. Experiment with shade schemes and font pairings. Alter, share or cooperate with other people on your work. Download Vendor Performance Analysis And Administration Supplier Performance And Order Cycle Time Monitoring Dashboard Themes PDF and find out how to give a successful presentation. Present a perfect display to your team and make your presentation unforgettable.
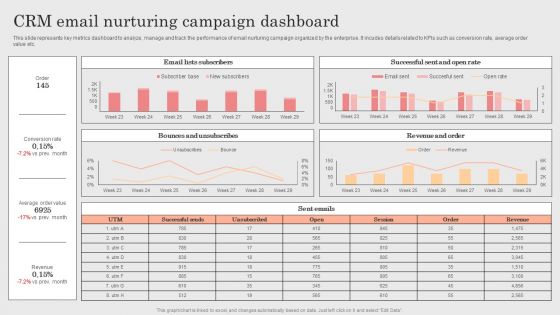
Integrating CRM Solution To Acquire Potential Customers CRM Email Nurturing Campaign Dashboard Template PDF
This slide represents key metrics dashboard to analyze, manage and track the performance of email nurturing campaign organized by the enterprise. It incudes details related to KPIs such as conversion rate, average order value etc. If you are looking for a format to display your unique thoughts, then the professionally designed Integrating CRM Solution To Acquire Potential Customers CRM Email Nurturing Campaign Dashboard Template PDF is the one for you. You can use it as a Google Slides template or a PowerPoint template. Incorporate impressive visuals, symbols, images, and other charts. Modify or reorganize the text boxes as you desire. Experiment with shade schemes and font pairings. Alter, share or cooperate with other people on your work. Download Integrating CRM Solution To Acquire Potential Customers CRM Email Nurturing Campaign Dashboard Template PDF and find out how to give a successful presentation. Present a perfect display to your team and make your presentation unforgettable.
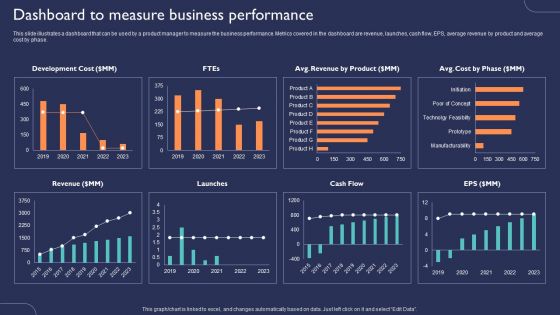
Introduction To New Product Portfolio Dashboard To Measure Business Performance Ppt Ideas Clipart Images PDF
This slide illustrates a dashboard that can be used by a product manager to measure the business performance. Metrics covered in the dashboard are revenue, launches, cash flow, EPS, average revenue by product and average cost by phase. Are you in need of a template that can accommodate all of your creative concepts. This one is crafted professionally and can be altered to fit any style. Use it with Google Slides or PowerPoint. Include striking photographs, symbols, depictions, and other visuals. Fill, move around, or remove text boxes as desired. Test out color palettes and font mixtures. Edit and save your work, or work with colleagues. Download Introduction To New Product Portfolio Dashboard To Measure Business Performance Ppt Ideas Clipart Images PDF and observe how to make your presentation outstanding. Give an impeccable presentation to your group and make your presentation unforgettable.
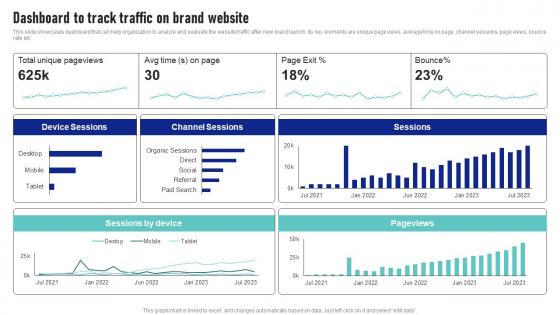
Dashboard To Track Traffic On Brand Website Launching New Product Brand Sample Pdf
This slide showcases dashboard that can help organization to analyze and evaluate the website traffic after new brand launch. Its key elements are unique page views, average time on page, channel sessions, page views, bounce rate etc Are you in need of a template that can accommodate all of your creative concepts This one is crafted professionally and can be altered to fit any style. Use it with Google Slides or PowerPoint. Include striking photographs, symbols, depictions, and other visuals. Fill, move around, or remove text boxes as desired. Test out color palettes and font mixtures. Edit and save your work, or work with colleagues. Download Dashboard To Track Traffic On Brand Website Launching New Product Brand Sample Pdf and observe how to make your presentation outstanding. Give an impeccable presentation to your group and make your presentation unforgettable. This slide showcases dashboard that can help organization to analyze and evaluate the website traffic after new brand launch. Its key elements are unique page views, average time on page, channel sessions, page views, bounce rate etc
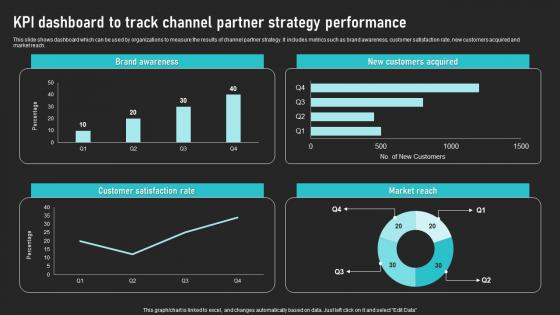
KPI Dashboard To Track Channel Partner Strategy Performance Cooperative Sales Tactics Structure Pdf
This slide shows dashboard which can be used by organizations to measure the results of channel partner strategy. It includes metrics such as brand awareness, customer satisfaction rate, new customers acquired and market reach. Get a simple yet stunning designed KPI Dashboard To Track Channel Partner Strategy Performance Cooperative Sales Tactics Structure Pdf It is the best one to establish the tone in your meetings. It is an excellent way to make your presentations highly effective. So, download this PPT today from Slidegeeks and see the positive impacts. Our easy-to-edit KPI Dashboard To Track Channel Partner Strategy Performance Cooperative Sales Tactics Structure Pdf can be your go-to option for all upcoming conferences and meetings. So, what are you waiting for Grab this template today. This slide shows dashboard which can be used by organizations to measure the results of channel partner strategy. It includes metrics such as brand awareness, customer satisfaction rate, new customers acquired and market reach.


 Continue with Email

 Home
Home


