Event Management Dashboard
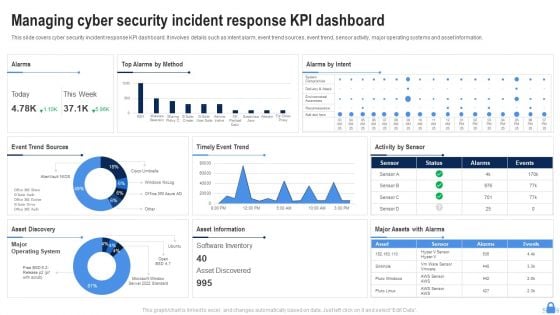
Managing Cyber Security Incident Response KPI Dashboard Ppt Layouts Shapes PDF
This slide covers cyber security incident response KPI dashboard. It involves details such as intent alarm, event trend sources, event trend, sensor activity, major operating systems and asset information. Pitch your topic with ease and precision using this Managing Cyber Security Incident Response KPI Dashboard Ppt Layouts Shapes PDF. This layout presents information on Top Alarms Method, Alarms Intent, Timely Event Trend. It is also available for immediate download and adjustment. So, changes can be made in the color, design, graphics or any other component to create a unique layout.
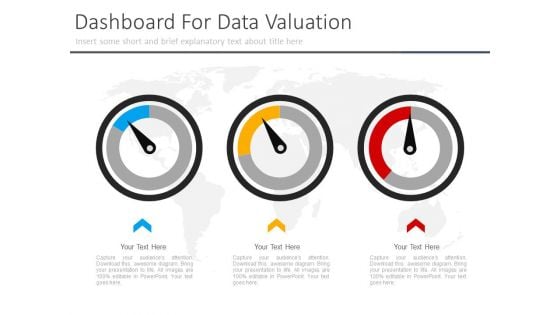
Three Dashboard For Corporate Level Strategy Powerpoint Slides
This PowerPoint template has been designed with three dashboards. You may use this slide to display corporate level strategy. This diagram provides an effective way of displaying information you can edit text, color, shade and style as per you need.
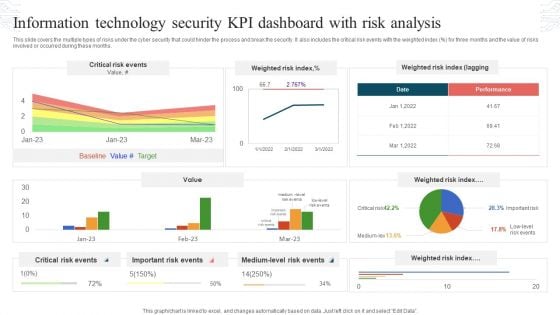
Information Technology Security KPI Dashboard With Risk Analysis Topics PDF
This slide covers the multiple types of risks under the cyber security that could hinder the process and break the security. It also includes the critical risk events with the weighted index percent for three months and the value of risks involved or occurred during these months. Showcasing this set of slides titled Information Technology Security KPI Dashboard With Risk Analysis Topics PDF. The topics addressed in these templates are Critical Risk Events, Weighted Risk Index, Important Risk Events. All the content presented in this PPT design is completely editable. Download it and make adjustments in color, background, font etc. as per your unique business setting.
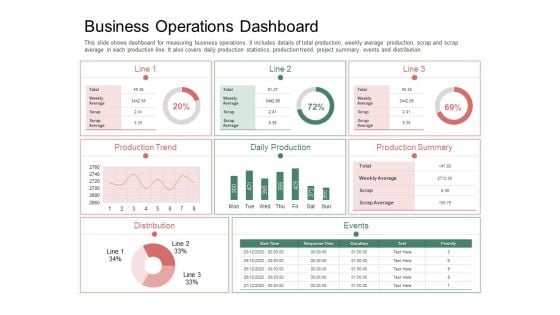
Organization Performance Evaluation Business Operations Dashboard Structure PDF
Deliver an awe inspiring pitch with this creative organization performance evaluation business operations dashboard structure pdf bundle. Topics like production trend, daily production, production summary, distribution, events can be discussed with this completely editable template. It is available for immediate download depending on the needs and requirements of the user.
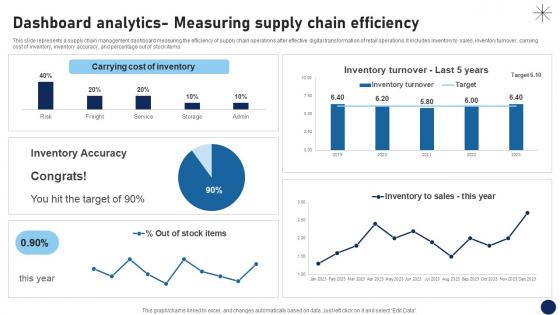
Dashboard Analytics Measuring Supply Chain Efficiency DT SS V
This slide represents a supply chain management dashboard measuring the efficiency of supply chain operations after effective digital transformation of retail operations. It includes inventory to sales, inventory turnover, carrying cost of inventory, inventory accuracy, and percentage out of stock items.If you are looking for a format to display your unique thoughts, then the professionally designed Dashboard Analytics Measuring Supply Chain Efficiency DT SS V is the one for you. You can use it as a Google Slides template or a PowerPoint template. Incorporate impressive visuals, symbols, images, and other charts. Modify or reorganize the text boxes as you desire. Experiment with shade schemes and font pairings. Alter, share or cooperate with other people on your work. Download Dashboard Analytics Measuring Supply Chain Efficiency DT SS V and find out how to give a successful presentation. Present a perfect display to your team and make your presentation unforgettable. This slide represents a supply chain management dashboard measuring the efficiency of supply chain operations after effective digital transformation of retail operations. It includes inventory to sales, inventory turnover, carrying cost of inventory, inventory accuracy, and percentage out of stock items.
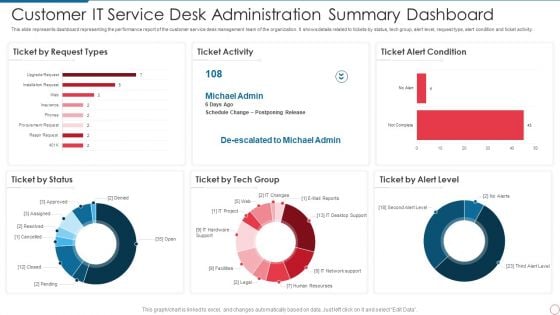
Customer IT Service Desk Administration Summary Dashboard Information PDF
This slide represents dashboard representing the performance report of the customer service desk management team of the organization. It shows details related to tickets by status, tech group, alert level, request type, alert condition and ticket activity. Showcasing this set of slides titled Customer IT Service Desk Administration Summary Dashboard Information PDF. The topics addressed in these templates are Customer It Service Desk Administration Summary Dashboard. All the content presented in this PPT design is completely editable. Download it and make adjustments in color, background, font etc. as per your unique business setting.
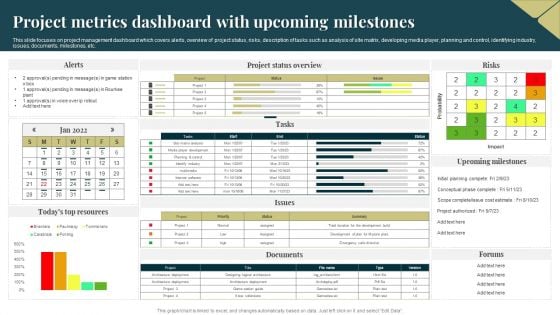
Project Metrics Dashboard With Upcoming Milestones Demonstration PDF
This slide focuses on project management dashboard which covers alerts, overview of project status, risks, description of tasks such as analysis of site matrix, developing media player, planning and control, identifying industry, issues, documents, milestones, etc. Pitch your topic with ease and precision using this Project Metrics Dashboard With Upcoming Milestones Demonstration PDF. This layout presents information on Probability, Project, Risks. It is also available for immediate download and adjustment. So, changes can be made in the color, design, graphics or any other component to create a unique layout.

Transform Management Instruction Schedule Change Management Training Feedback Summary PDF
This slide shows dashboard representing the analysis of the training feedback received from the organizational staff. It includes KPIs such as net promoter score, training satisfaction rate, trainee engagement score etc. This modern and well arranged Transform Management Instruction Schedule Change Management Training Feedback Summary PDF provides lots of creative possibilities. It is very simple to customize and edit with the Powerpoint Software. Just drag and drop your pictures into the shapes. All facets of this template can be edited with Powerpoint no extra software is necessary. Add your own material, put your images in the places assigned for them, adjust the colors, and then you can show your slides to the world, with an animated slide included.
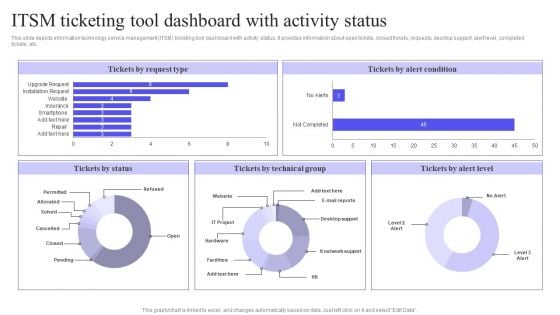
ITSM Ticketing Tool Dashboard With Activity Status Guidelines PDF
This slide depicts information technology service management ITSM ticketing tool dashboard with activity status. It provides information about open tickets, closed tickets, requests, desktop support, alert level, completed tickets, etc. Crafting an eye catching presentation has never been more straightforward. Let your presentation shine with this tasteful yet straightforward ITSM Ticketing Tool Dashboard With Activity Status Guidelines PDF template. It offers a minimalistic and classy look that is great for making a statement. The colors have been employed intelligently to add a bit of playfulness while still remaining professional. Construct the ideal ITSM Ticketing Tool Dashboard With Activity Status Guidelines PDF that effortlessly grabs the attention of your audience Begin now and be certain to wow your customers.
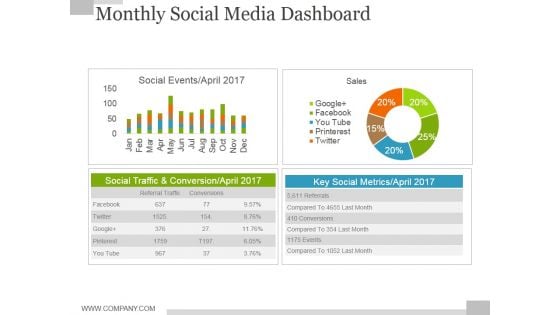
Monthly Social Media Dashboard Ppt PowerPoint Presentation Model Slide
This is a monthly social media dashboard ppt powerpoint presentation model slide. This is a four stage process. The stages in this process are sales, social events, business, finance, key social metrics.
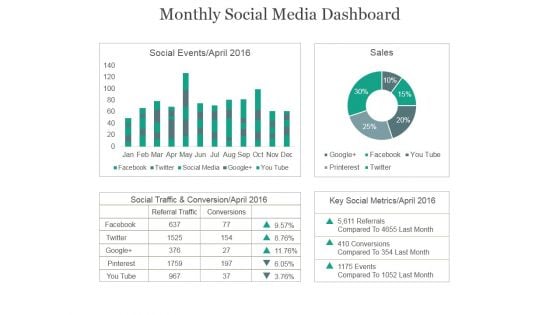
Monthly Social Media Dashboard Ppt PowerPoint Presentation Example 2015
This is a monthly social media dashboard ppt powerpoint presentation example 2015. This is a four stage process. The stages in this process are social events, sales, social traffic, conservation, key social metrics.
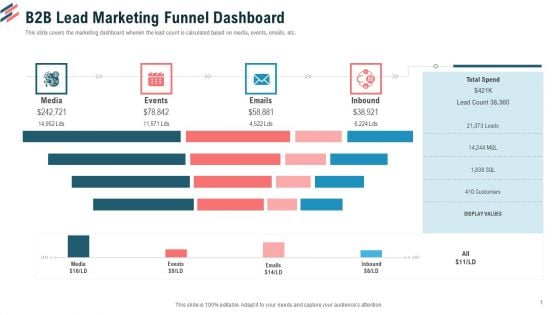
B2B Lead Marketing Funnel Dashboard Ppt Model Slides PDF
This slide covers the marketing dashboard wherein the lead count is calculated based on media, events, emails, etc.Presenting B2B lead marketing funnel dashboard ppt model slides pdf. to provide visual cues and insights. Share and navigate important information on four stages that need your due attention. This template can be used to pitch topics like media, events, inbound. In addtion, this PPT design contains high resolution images, graphics, etc, that are easily editable and available for immediate download.
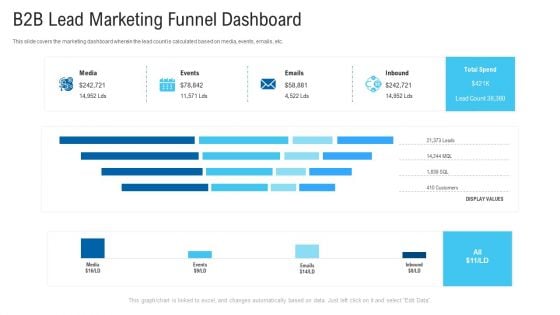
B2B Lead Marketing Funnel Dashboard Ppt Styles Ideas PDF
This slide covers the marketing dashboard wherein the lead count is calculated based on media, events, emails, etc.Presenting B2B lead marketing funnel dashboard ppt styles ideas pdf. to provide visual cues and insights. Share and navigate important information on four stages that need your due attention. This template can be used to pitch topics like media, events, inbound. In addtion, this PPT design contains high resolution images, graphics, etc, that are easily editable and available for immediate download.
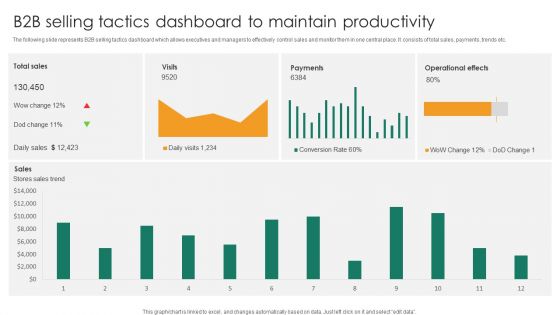
B2b Selling Tactics Dashboard To Maintain Productivity Introduction PDF
The following slide represents B2B selling tactics dashboard which allows executives and managers to effectively control sales and monitor them in one central place. It consists of total sales, payments, trends etc.Pitch your topic with ease and precision using this B2b Selling Tactics Dashboard To Maintain Productivity Introduction PDF. This layout presents information on Operational Effects, Stores Sales Trend, Conversion Rate. It is also available for immediate download and adjustment. So, changes can be made in the color, design, graphics or any other component to create a unique layout.
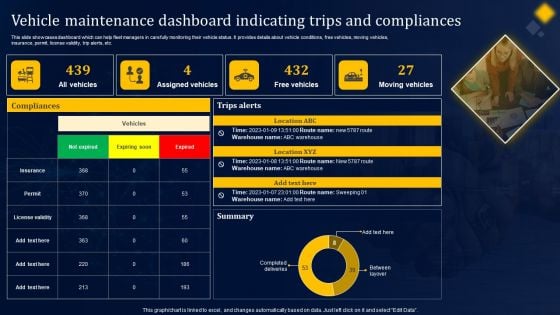
Vehicle Maintenance Dashboard Indicating Trips And Compliances Structure PDF
This slide showcases dashboard which can help fleet managers in carefully monitoring their vehicle status. It provides details about vehicle conditions, free vehicles, moving vehicles, insurance, permit, license validity, trip alerts, etc. Here you can discover an assortment of the finest PowerPoint and Google Slides templates. With these templates, you can create presentations for a variety of purposes while simultaneously providing your audience with an eye-catching visual experience. Download Vehicle Maintenance Dashboard Indicating Trips And Compliances Structure PDF to deliver an impeccable presentation. These templates will make your job of preparing presentations much quicker, yet still, maintain a high level of quality. Slidegeeks has experienced researchers who prepare these templates and write high-quality content for you. Later on, you can personalize the content by editing the Vehicle Maintenance Dashboard Indicating Trips And Compliances Structure PDF.
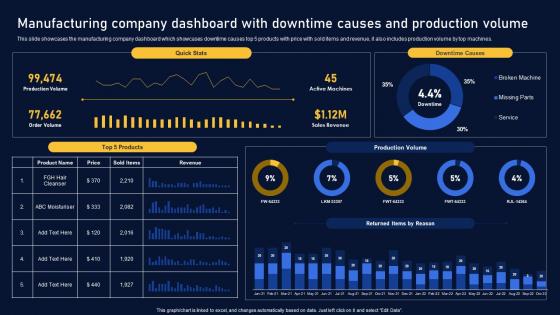
Manufacturing Company Dashboard Multinational Organization Customer Goods Diagrams Pdf
This slide showcases the manufacturing company dashboard which showcases downtime causes top 5 products with price with sold items and revenue, it also includes production volume by top machines. This modern and well arranged Manufacturing Company Dashboard Multinational Organization Customer Goods Diagrams Pdf provides lots of creative possibilities. It is very simple to customize and edit with the Powerpoint Software. Just drag and drop your pictures into the shapes. All facets of this template can be edited with Powerpoint, no extra software is necessary. Add your own material, put your images in the places assigned for them, adjust the colors, and then you can show your slides to the world, with an animated slide included. This slide showcases the manufacturing company dashboard which showcases downtime causes top 5 products with price with sold items and revenue, it also includes production volume by top machines.
Web Access Control Solution Secure Web Gateway Performance Tracking Dashboard
This slide represents a dashboard to maintain the record of various functions of Secure Web Gateway. The main components are top blocked web malware, web usage trend, top web application categories, risky web isolations, etc. Get a simple yet stunning designed Web Access Control Solution Secure Web Gateway Performance Tracking Dashboard. It is the best one to establish the tone in your meetings. It is an excellent way to make your presentations highly effective. So, download this PPT today from Slidegeeks and see the positive impacts. Our easy-to-edit Web Access Control Solution Secure Web Gateway Performance Tracking Dashboard can be your go-to option for all upcoming conferences and meetings. So, what are you waiting for Grab this template today. This slide represents a dashboard to maintain the record of various functions of Secure Web Gateway. The main components are top blocked web malware, web usage trend, top web application categories, risky web isolations, etc.

Agile QA Procedure Quality Control Kpi Dashboard Topics PDF
This slide shows the quality control dashboard to monitor the effectiveness of agile quality assurance model. It includes KPIs namely test execution summary, defect severity distribution, module wise text execution and defect severity index. Deliver an awe inspiring pitch with this creative agile qa procedure quality control kpi dashboard topics pdf bundle. Topics like quality control kpi dashboard can be discussed with this completely editable template. It is available for immediate download depending on the needs and requirements of the user.

Devsecops Performance Monitoring Dashboard Role Of Devsecops Ppt Presentation
This slide represents the dashboard to track the DevSecOps performance. The purpose of this slide is to showcase a dashboard for metrics that track the latest vulnerabilities, open issues, latest tickets, and time to fix the problem, etc. If you are looking for a format to display your unique thoughts, then the professionally designed Devsecops Performance Monitoring Dashboard Role Of Devsecops Ppt Presentation is the one for you. You can use it as a Google Slides template or a PowerPoint template. Incorporate impressive visuals, symbols, images, and other charts. Modify or reorganize the text boxes as you desire. Experiment with shade schemes and font pairings. Alter, share or cooperate with other people on your work. Download Devsecops Performance Monitoring Dashboard Role Of Devsecops Ppt Presentation and find out how to give a successful presentation. Present a perfect display to your team and make your presentation unforgettable. This slide represents the dashboard to track the DevSecOps performance. The purpose of this slide is to showcase a dashboard for metrics that track the latest vulnerabilities, open issues, latest tickets, and time to fix the problem, etc.
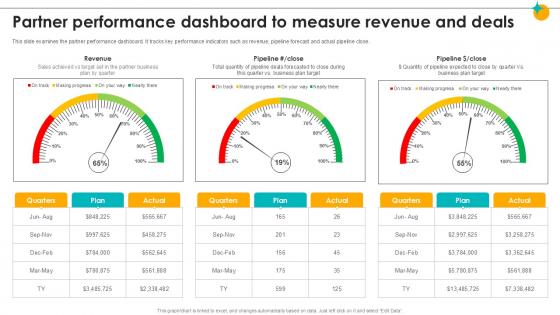
Partner Performance Dashboard To Measure Revenue Partner Relationship Ppt Template
This slide examines the partner performance dashboard. It tracks key performance indicators such as revenue, pipeline forecast and actual pipeline close. Are you in need of a template that can accommodate all of your creative concepts This one is crafted professionally and can be altered to fit any style. Use it with Google Slides or PowerPoint. Include striking photographs, symbols, depictions, and other visuals. Fill, move around, or remove text boxes as desired. Test out color palettes and font mixtures. Edit and save your work, or work with colleagues. Download Partner Performance Dashboard To Measure Revenue Partner Relationship Ppt Template and observe how to make your presentation outstanding. Give an impeccable presentation to your group and make your presentation unforgettable. This slide examines the partner performance dashboard. It tracks key performance indicators such as revenue, pipeline forecast and actual pipeline close.
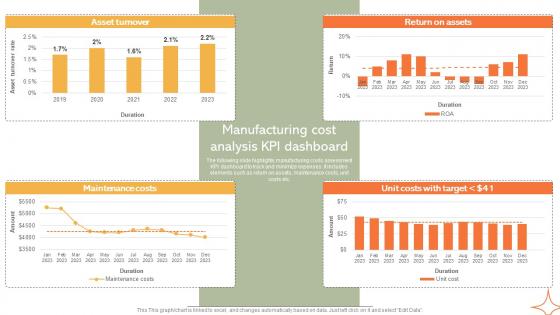
Manufacturing Cost Analysis KPI Dashboard Implementing Manufacturing Strategy SS V
The following slide highlights manufacturing costs assessment KPI dashboard to track and minimize expenses. It includes elements such as return on assets, maintenance costs, unit costs etc. Make sure to capture your audiences attention in your business displays with our gratis customizable Manufacturing Cost Analysis KPI Dashboard Implementing Manufacturing Strategy SS V. These are great for business strategies, office conferences, capital raising or task suggestions. If you desire to acquire more customers for your tech business and ensure they stay satisfied, create your own sales presentation with these plain slides. The following slide highlights manufacturing costs assessment KPI dashboard to track and minimize expenses. It includes elements such as return on assets, maintenance costs, unit costs etc.
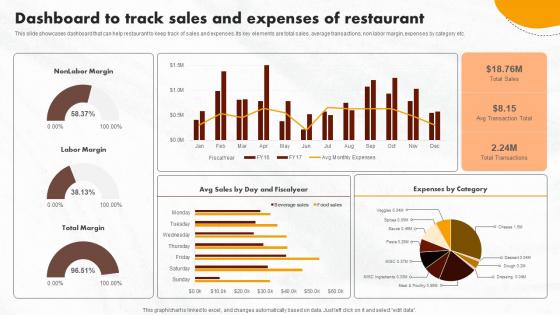
Online Promotional Activities Dashboard To Track Sales Sample Pdf
This slide showcases dashboard that can help restaurant to keep track of sales and expenses. Its key elements are total sales, average transactions, non labor margin, expenses by category etc. Are you in need of a template that can accommodate all of your creative concepts This one is crafted professionally and can be altered to fit any style. Use it with Google Slides or PowerPoint. Include striking photographs, symbols, depictions, and other visuals. Fill, move around, or remove text boxes as desired. Test out color palettes and font mixtures. Edit and save your work, or work with colleagues. Download Online Promotional Activities Dashboard To Track Sales Sample Pdf and observe how to make your presentation outstanding. Give an impeccable presentation to your group and make your presentation unforgettable. This slide showcases dashboard that can help restaurant to keep track of sales and expenses. Its key elements are total sales, average transactions, non labor margin, expenses by category etc.
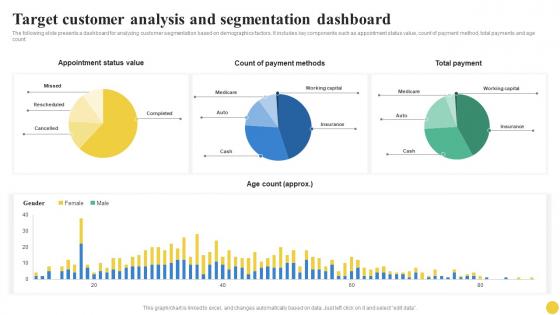
Target Customer Analysis And Segmentation Dashboard User Segmentation Professional Pdf
The following slide presents a dashboard for analyzing customer segmentation based on demographics factors. It includes key components such as appointment status value, count of payment method, total payments and age count. Are you in need of a template that can accommodate all of your creative concepts This one is crafted professionally and can be altered to fit any style. Use it with Google Slides or PowerPoint. Include striking photographs, symbols, depictions, and other visuals. Fill, move around, or remove text boxes as desired. Test out color palettes and font mixtures. Edit and save your work, or work with colleagues. Download Target Customer Analysis And Segmentation Dashboard User Segmentation Professional Pdf and observe how to make your presentation outstanding. Give an impeccable presentation to your group and make your presentation unforgettable. The following slide presents a dashboard for analyzing customer segmentation based on demographics factors. It includes key components such as appointment status value, count of payment method, total payments and age count.
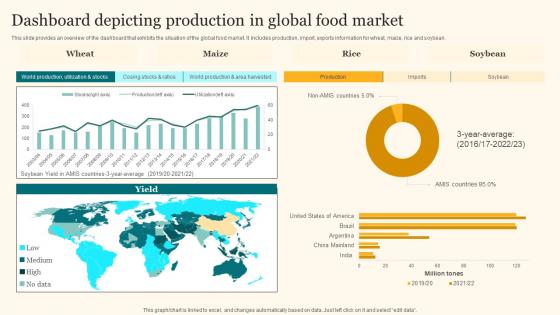
Dashboard Depicting Production In Global Agricultural Product Promotion Template Pdf
This slide provides an overview of the dashboard that exhibits the situation of the global food market. It includes production, import, exports information for wheat, maize, rice and soybean. Are you in need of a template that can accommodate all of your creative concepts This one is crafted professionally and can be altered to fit any style. Use it with Google Slides or PowerPoint. Include striking photographs, symbols, depictions, and other visuals. Fill, move around, or remove text boxes as desired. Test out color palettes and font mixtures. Edit and save your work, or work with colleagues. Download Dashboard Depicting Production In Global Agricultural Product Promotion Template Pdf and observe how to make your presentation outstanding. Give an impeccable presentation to your group and make your presentation unforgettable. This slide provides an overview of the dashboard that exhibits the situation of the global food market. It includes production, import, exports information for wheat, maize, rice and soybean.
Dashboard Tracking Business Major Promotional Analytics Future Trends Clipart Pdf
This slide covers the dashboard for analyzing blogging KPIs such as performance, published posts, views, new blog subscribers, top blog posts by pageviews, top blog posts by CTR, etc. If you are looking for a format to display your unique thoughts, then the professionally designed Dashboard Tracking Business Major Promotional Analytics Future Trends Clipart Pdf is the one for you. You can use it as a Google Slides template or a PowerPoint template. Incorporate impressive visuals, symbols, images, and other charts. Modify or reorganize the text boxes as you desire. Experiment with shade schemes and font pairings. Alter, share or cooperate with other people on your work. Download Dashboard Tracking Business Major Promotional Analytics Future Trends Clipart Pdf and find out how to give a successful presentation. Present a perfect display to your team and make your presentation unforgettable. This slide covers the dashboard for analyzing blogging KPIs such as performance, published posts, views, new blog subscribers, top blog posts by pageviews, top blog posts by CTR, etc.
Green Cloud Computing Performance Tracking Dashboard Eco Friendly Computing IT
This slide depicts the performance tracking dashboard for green cloud computing. This slide aims to showcase the performance tracking report of green cloud computing by covering parameters such as Power Use Effectiveness PUE, high-density zone, history, consumption, and Average Propensity to Consume APC consumption.If you are looking for a format to display your unique thoughts, then the professionally designed Green Cloud Computing Performance Tracking Dashboard Eco Friendly Computing IT is the one for you. You can use it as a Google Slides template or a PowerPoint template. Incorporate impressive visuals, symbols, images, and other charts. Modify or reorganize the text boxes as you desire. Experiment with shade schemes and font pairings. Alter, share or cooperate with other people on your work. Download Green Cloud Computing Performance Tracking Dashboard Eco Friendly Computing IT and find out how to give a successful presentation. Present a perfect display to your team and make your presentation unforgettable. This slide depicts the performance tracking dashboard for green cloud computing. This slide aims to showcase the performance tracking report of green cloud computing by covering parameters such as Power Use Effectiveness ,PUE, high-density zone, history, consumption, and Average Propensity to Consume ,APC consumption.
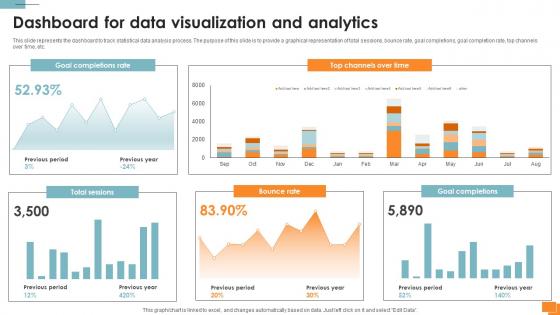
Statistical Tools For Evidence Dashboard For Data Visualization And Analytics
This slide represents the dashboard to track statistical data analysis process. The purpose of this slide is to provide a graphical representation of total sessions, bounce rate, goal completions, goal completion rate, top channels over time, etc. Are you in need of a template that can accommodate all of your creative concepts This one is crafted professionally and can be altered to fit any style. Use it with Google Slides or PowerPoint. Include striking photographs, symbols, depictions, and other visuals. Fill, move around, or remove text boxes as desired. Test out color palettes and font mixtures. Edit and save your work, or work with colleagues. Download Statistical Tools For Evidence Dashboard For Data Visualization And Analytics and observe how to make your presentation outstanding. Give an impeccable presentation to your group and make your presentation unforgettable. This slide represents the dashboard to track statistical data analysis process. The purpose of this slide is to provide a graphical representation of total sessions, bounce rate, goal completions, goal completion rate, top channels over time, etc.
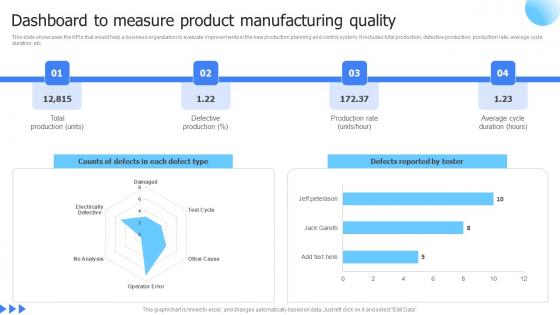
Leveraging Advanced Manufacturing Dashboard To Measure Product Professional Pdf
This slide showcases the KPIs that would help a business organization to evaluate improvements in the new production planning and control system. It includes total production, defective production, production rate, average cycle duration, etc. Get a simple yet stunning designed Leveraging Advanced Manufacturing Dashboard To Measure Product Professional Pdf It is the best one to establish the tone in your meetings. It is an excellent way to make your presentations highly effective. So, download this PPT today from Slidegeeks and see the positive impacts. Our easy-to-edit Leveraging Advanced Manufacturing Dashboard To Measure Product Professional Pdf can be your go-to option for all upcoming conferences and meetings. So, what are you waiting for Grab this template today. This slide showcases the KPIs that would help a business organization to evaluate improvements in the new production planning and control system. It includes total production, defective production, production rate, average cycle duration, etc.
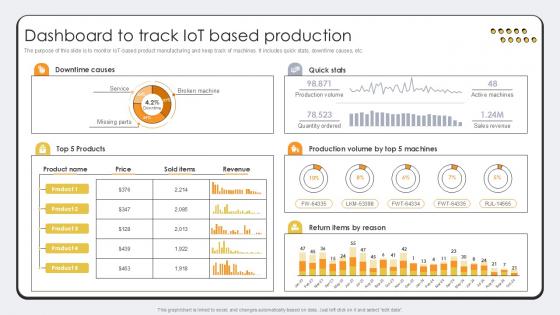
Dashboard To Track IoT Based Revolutionizing Production IoT Ppt PowerPoint
The purpose of this slide is to monitor IoT-based product manufacturing and keep track of machines. It includes quick stats, downtime causes, etc. If you are looking for a format to display your unique thoughts, then the professionally designed Dashboard To Track IoT Based Revolutionizing Production IoT Ppt PowerPoint is the one for you. You can use it as a Google Slides template or a PowerPoint template. Incorporate impressive visuals, symbols, images, and other charts. Modify or reorganize the text boxes as you desire. Experiment with shade schemes and font pairings. Alter, share or cooperate with other people on your work. Download Dashboard To Track IoT Based Revolutionizing Production IoT Ppt PowerPoint and find out how to give a successful presentation. Present a perfect display to your team and make your presentation unforgettable. The purpose of this slide is to monitor IoT-based product manufacturing and keep track of machines. It includes quick stats, downtime causes, etc.
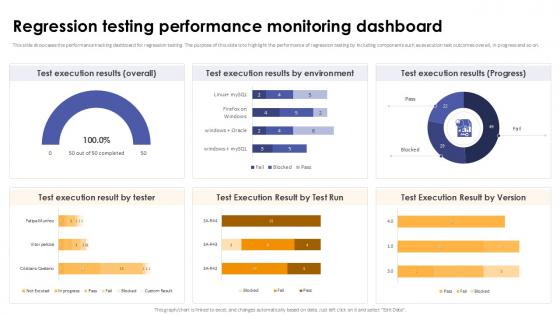
Regression Testing Performance Monitoring Dashboard Corrective Regression Testing Ppt Powerpoint
This slide showcases the performance tracking dashboard for regression testing. The purpose of this slide is to highlight the performance of regression testing by including components such as execution test outcomes overall, in progress and so on. Are you in need of a template that can accommodate all of your creative concepts This one is crafted professionally and can be altered to fit any style. Use it with Google Slides or PowerPoint. Include striking photographs, symbols, depictions, and other visuals. Fill, move around, or remove text boxes as desired. Test out color palettes and font mixtures. Edit and save your work, or work with colleagues. Download Regression Testing Performance Monitoring Dashboard Corrective Regression Testing Ppt Powerpoint and observe how to make your presentation outstanding. Give an impeccable presentation to your group and make your presentation unforgettable. This slide showcases the performance tracking dashboard for regression testing. The purpose of this slide is to highlight the performance of regression testing by including components such as execution test outcomes overall, in progress and so on.
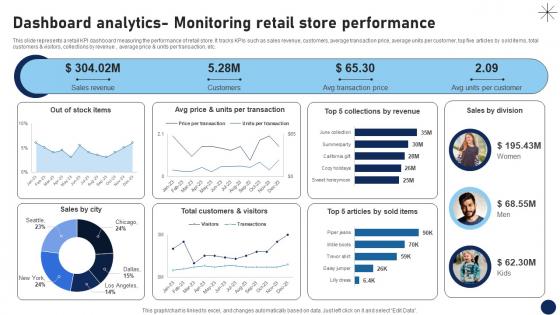
Dashboard Analytics Monitoring Retail Store Performance DT SS V
This slide represents a retail KPI dashboard measuring the performance of retail store. It tracks KPIs such as sales revenue, customers, average transaction price, average units per customer, top five articles by sold items, total customers and visitors, collections by revenue , average price and units per transaction, etc.Are you in need of a template that can accommodate all of your creative concepts This one is crafted professionally and can be altered to fit any style. Use it with Google Slides or PowerPoint. Include striking photographs, symbols, depictions, and other visuals. Fill, move around, or remove text boxes as desired. Test out color palettes and font mixtures. Edit and save your work, or work with colleagues. Download Dashboard Analytics Monitoring Retail Store Performance DT SS V and observe how to make your presentation outstanding. Give an impeccable presentation to your group and make your presentation unforgettable. This slide represents a retail KPI dashboard measuring the performance of retail store. It tracks KPIs such as sales revenue, customers, average transaction price, average units per customer, top five articles by sold items, total customers and visitors, collections by revenue , average price and units per transaction, etc.
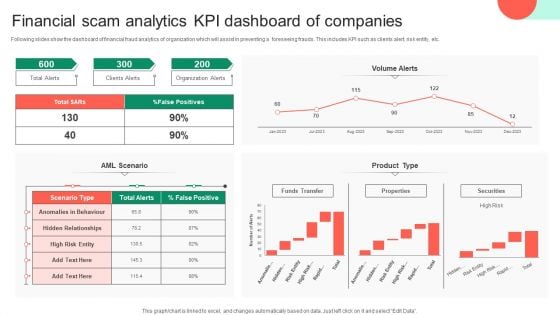
Financial Scam Analytics KPI Dashboard Of Companies Clipart PDF
Following slides show the dashboard of financial fraud analytics of organization which will assist in preventing a foreseeing frauds. This includes KPI such as clients alert, risk entity, etc. Pitch your topic with ease and precision using this Financial Scam Analytics KPI Dashboard Of Companies Clipart PDF. This layout presents information on Financial Scam Analytics, Kpi Dashboard Of Companies. It is also available for immediate download and adjustment. So, changes can be made in the color, design, graphics or any other component to create a unique layout.
Data Breach Prevention Status Tracking Dashboard Data Fortification Strengthening Defenses
This slide represents the critical cyber security performance indicators for the organization. The key components include application health, encryption status, license consumption, windows defender, etc.Are you in need of a template that can accommodate all of your creative concepts This one is crafted professionally and can be altered to fit any style. Use it with Google Slides or PowerPoint. Include striking photographs, symbols, depictions, and other visuals. Fill, move around, or remove text boxes as desired. Test out color palettes and font mixtures. Edit and save your work, or work with colleagues. Download Data Breach Prevention Status Tracking Dashboard Data Fortification Strengthening Defenses and observe how to make your presentation outstanding. Give an impeccable presentation to your group and make your presentation unforgettable. This slide represents the critical cyber security performance indicators for the organization. The key components include application health, encryption status, license consumption, windows defender, etc.

Customer Support Services Customer Support Service Analysis Dashboard Rules PDF
This slide exhibits customer service dashboard to improve visibility. The dashboard includes resolved and active cases, incoming cases by subject, priority, SLA status and age, CSAT and escalated case volume. Make sure to capture your audiences attention in your business displays with our gratis customizable Customer Support Services Customer Support Service Analysis Dashboard Rules PDF. These are great for business strategies, office conferences, capital raising or task suggestions. If you desire to acquire more customers for your tech business and ensure they stay satisfied, create your own sales presentation with these plain slides.
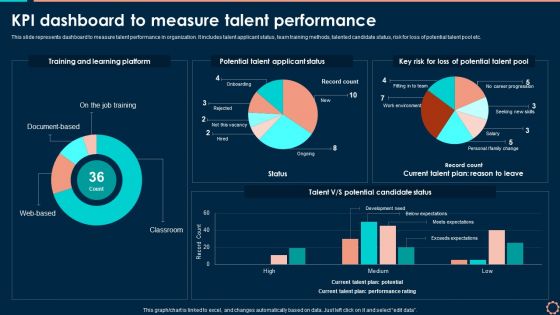
KPI Dashboard To Measure Talent Performance Slides PDF
This slide represents dashboard to measure talent performance in organization. It includes talent applicant status, team training methods, talented candidate status, risk for loss of potential talent pool etc. Get a simple yet stunning designed KPI Dashboard To Measure Talent Performance Slides PDF. It is the best one to establish the tone in your meetings. It is an excellent way to make your presentations highly effective. So, download this PPT today from Slidegeeks and see the positive impacts. Our easy to edit KPI Dashboard To Measure Talent Performance Slides PDF can be your go-to option for all upcoming conferences and meetings. So, what are you waiting for Grab this template today.
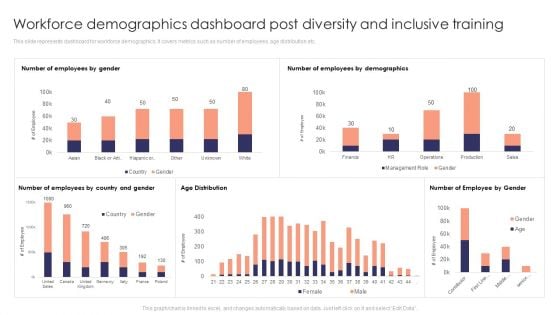
Workforce Demographics Dashboard Post Diversity And Inclusive Training Background PDF
This slide represents dashboard for workforce demographics. It covers metrics such as number of employees, age distribution etc. Make sure to capture your audiences attention in your business displays with our gratis customizable Workforce Demographics Dashboard Post Diversity And Inclusive Training Background PDF. These are great for business strategies, office conferences, capital raising or task suggestions. If you desire to acquire more customers for your tech business and ensure they stay satisfied, create your own sales presentation with these plain slides.
Fundamentals Of Reinforcement Performance Tracking Dashboard For Reinforcement Elements PDF
This slide represents the performance tracking dashboard for the reinforcement learning model based on different time frames and categories. Make sure to capture your audiences attention in your business displays with our gratis customizable Fundamentals Of Reinforcement Performance Tracking Dashboard For Reinforcement Elements PDF. These are great for business strategies, office conferences, capital raising or task suggestions. If you desire to acquire more customers for your tech business and ensure they stay satisfied, create your own sales presentation with these plain slides.
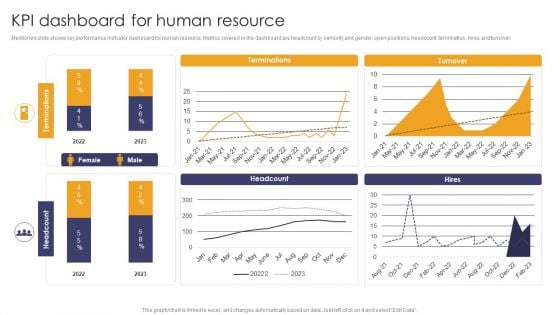
Implementing Succession Planning KPI Dashboard For Human Resource Template PDF
Mentioned slide shows key performance indicator dashboard for human resource. Metrics covered in the dashboard are headcount by seniority and gender, open positions, headcount, termination, hires and turnover. If you are looking for a format to display your unique thoughts, then the professionally designed Implementing Succession Planning KPI Dashboard For Human Resource Template PDF is the one for you. You can use it as a Google Slides template or a PowerPoint template. Incorporate impressive visuals, symbols, images, and other charts. Modify or reorganize the text boxes as you desire. Experiment with shade schemes and font pairings. Alter, share or cooperate with other people on your work. Download Implementing Succession Planning KPI Dashboard For Human Resource Template PDF and find out how to give a successful presentation. Present a perfect display to your team and make your presentation unforgettable.

Internal Employee Succession KPI Dashboard For Human Resource Information PDF
Mentioned slide shows key performance indicator dashboard for human resource. Metrics covered in the dashboard are headcount by seniority and gender, open positions, headcount, termination, hires and turnover. If you are looking for a format to display your unique thoughts, then the professionally designed Internal Employee Succession KPI Dashboard For Human Resource Information PDF is the one for you. You can use it as a Google Slides template or a PowerPoint template. Incorporate impressive visuals, symbols, images, and other charts. Modify or reorganize the text boxes as you desire. Experiment with shade schemes and font pairings. Alter, share or cooperate with other people on your work. Download Internal Employee Succession KPI Dashboard For Human Resource Information PDF and find out how to give a successful presentation. Present a perfect display to your team and make your presentation unforgettable.
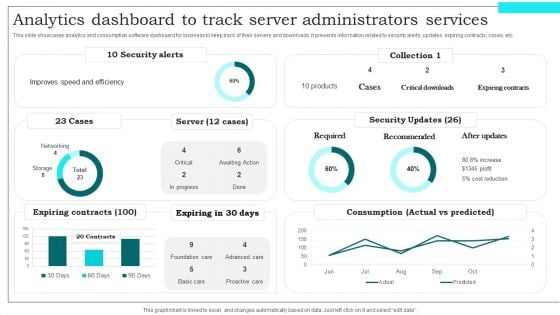
Analytics Dashboard To Track Server Administrators Services Demonstration PDF
This slide showcases analytics and consumption software dashboard for business to keep track of their servers and downloads. It presents information related to security alerts, updates, expiring contracts, cases, etc. Showcasing this set of slides titled Analytics Dashboard To Track Server Administrators Services Demonstration PDF. The topics addressed in these templates are Expiring Contracts, Security Updates, Required. All the content presented in this PPT design is completely editable. Download it and make adjustments in color, background, font etc. as per your unique business setting.
Software Implementation Project Progress Tracking Dashboard Summary PDF
This slide represents the dashboard to track the progress of software implementation project. It includes details related to health, tasks, project, time, cost and workload of software implementation project. If you are looking for a format to display your unique thoughts, then the professionally designed Software Implementation Project Progress Tracking Dashboard Summary PDF is the one for you. You can use it as a Google Slides template or a PowerPoint template. Incorporate impressive visuals, symbols, images, and other charts. Modify or reorganize the text boxes as you desire. Experiment with shade schemes and font pairings. Alter, share or cooperate with other people on your work. Download Software Implementation Project Progress Tracking Dashboard Summary PDFSoftware Implementation Project Progress Tracking Dashboard Summary PDF and find out how to give a successful presentation. Present a perfect display to your team and make your presentation unforgettable.
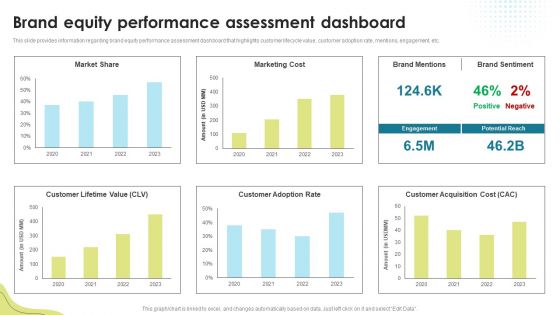
Brand Equity Performance Assessment Dashboard Brand Administration Template PDF
This slide provides information regarding brand equity performance assessment dashboard that highlights customer lifecycle value, customer adoption rate, mentions, engagement, etc. This modern and well-arranged Brand Equity Performance Assessment Dashboard Brand Administration Template PDF provides lots of creative possibilities. It is very simple to customize and edit with the Powerpoint Software. Just drag and drop your pictures into the shapes. All facets of this template can be edited with Powerpoint no extra software is necessary. Add your own material, put your images in the places assigned for them, adjust the colors, and then you can show your slides to the world, with an animated slide included.
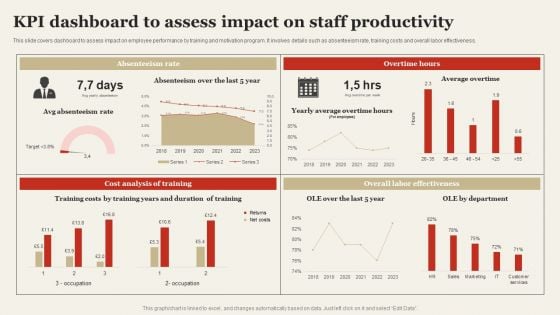
KPI Dashboard To Assess Impact On Staff Productivity Infographics PDF
This slide covers dashboard to assess impact on employee performance by training and motivation program. It involves details such as absenteeism rate, training costs and overall labor effectiveness. Make sure to capture your audiences attention in your business displays with our gratis customizable KPI Dashboard To Assess Impact On Staff Productivity Infographics PDF. These are great for business strategies, office conferences, capital raising or task suggestions. If you desire to acquire more customers for your tech business and ensure they stay satisfied, create your own sales presentation with these plain slides.
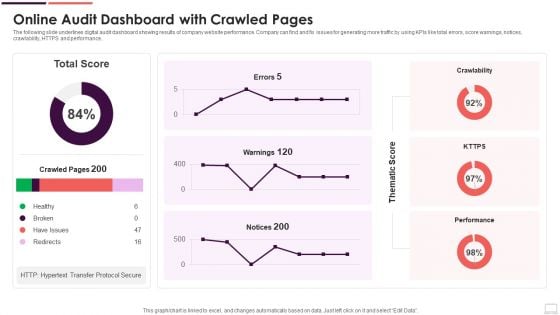
Online Audit Dashboard With Crawled Pages Background PDF
The following slide underlines digital audit dashboard showing results of company website performance. Company can find and fix issues for generating more traffic by using KPIs like total errors, score warnings, notices, crawlability, HTTPS and performance. Showcasing this set of slides titled Online Audit Dashboard With Crawled Pages Background PDF. The topics addressed in these templates are Redirects, Have Issues, Healthy. All the content presented in this PPT design is completely editable. Download it and make adjustments in color, background, font etc. as per your unique business setting.
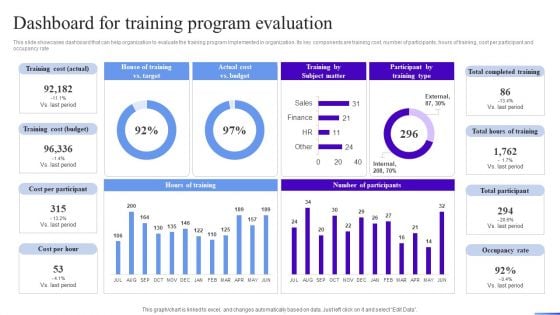
Business Development Program Dashboard For Training Program Evaluation Infographics PDF
This slide showcases dashboard that can help organization to evaluate the training program implemented in organization. Its key components are training cost, number of participants, hours of training, cost per participant and occupancy rate. Get a simple yet stunning designed Business Development Program Dashboard For Training Program Evaluation Infographics PDF. It is the best one to establish the tone in your meetings. It is an excellent way to make your presentations highly effective. So, download this PPT today from Slidegeeks and see the positive impacts. Our easy-to-edit Business Development Program Dashboard For Training Program Evaluation Infographics PDF can be your go-to option for all upcoming conferences and meetings. So, what are you waiting for Grab this template today.
Monthly Sales Performance Tracking And Monitoring Dashboard Diagrams PDF
This slide showcases a dashboard presenting various metrics to measure and analyze sales performance for revenue growth. It includes key components such as number of sales, revenue, profit, cost, sales revenue, sales increment, cost analysis and cross sell. Make sure to capture your audiences attention in your business displays with our gratis customizable Monthly Sales Performance Tracking And Monitoring Dashboard Diagrams PDF. These are great for business strategies, office conferences, capital raising or task suggestions. If you desire to acquire more customers for your tech business and ensure they stay satisfied, create your own sales presentation with these plain slides.
Monthly Sales Performance Tracking And Monitoring Dashboard Designs PDF
This slide showcases a dashboard presenting various metrics to measure and analyze sales performance for revenue growth. It includes key components such as number of sales, revenue, profit, cost, sales revenue, sales increment, cost analysis and cross sell. Make sure to capture your audiences attention in your business displays with our gratis customizable Monthly Sales Performance Tracking And Monitoring Dashboard Designs PDF. These are great for business strategies, office conferences, capital raising or task suggestions. If you desire to acquire more customers for your tech business and ensure they stay satisfied, create your own sales presentation with these plain slides.
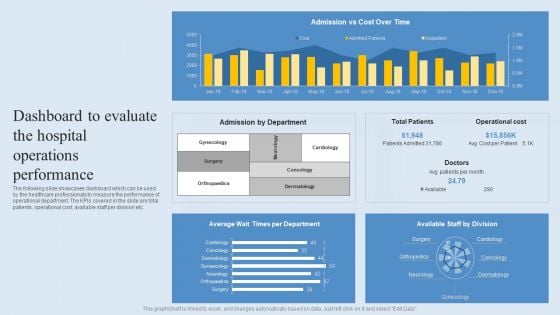
Dashboard To Evaluate The Hospital Operations Performance Diagrams PDF
The following slide showcases dashboard which can be used by the healthcare professionals to measure the performance of operational department. The KPIs covered in the slide are total patients, operational cost, available staff per division etc. Make sure to capture your audiences attention in your business displays with our gratis customizable Dashboard To Evaluate The Hospital Operations Performance Diagrams PDF. These are great for business strategies, office conferences, capital raising or task suggestions. If you desire to acquire more customers for your tech business and ensure they stay satisfied, create your own sales presentation with these plain slides.
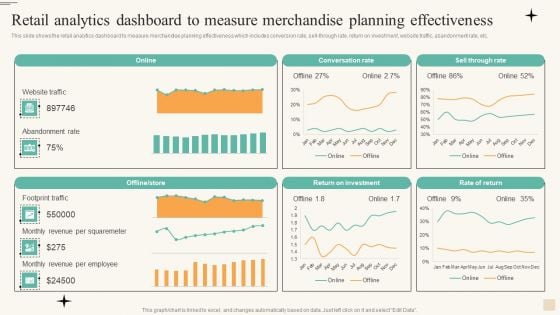
Retail Analytics Dashboard To Measure Merchandise Planning Effectiveness Microsoft PDF
This slide shows the retail analytics dashboard to measure merchandise planning effectiveness which includes conversion rate, sell through rate, return on investment, website traffic, abandonment rate, etc. Make sure to capture your audiences attention in your business displays with our gratis customizable Retail Analytics Dashboard To Measure Merchandise Planning Effectiveness Microsoft PDF. These are great for business strategies, office conferences, capital raising or task suggestions. If you desire to acquire more customers for your tech business and ensure they stay satisfied, create your own sales presentation with these plain slides.
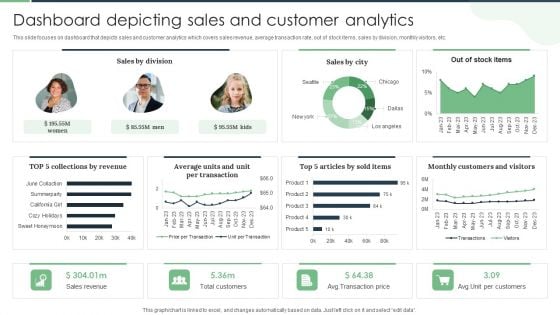
Dashboard Depicting Sales And Customer Analytics Professional PDF
This slide focuses on dashboard that depicts sales and customer analytics which covers sales revenue, average transaction rate, out of stock items, sales by division, monthly visitors, etc. Make sure to capture your audiences attention in your business displays with our gratis customizable Dashboard Depicting Sales And Customer Analytics Professional PDF. These are great for business strategies, office conferences, capital raising or task suggestions. If you desire to acquire more customers for your tech business and ensure they stay satisfied, create your own sales presentation with these plain slides.
PPC Marketing KPI Dashboard To Analyse Strategy Efficiency Icons PDF
This slide covers PPC marketing dashboard to improve efficiency. It involves total spends, number of clicks, cost per conversion, change in conversion rate and cost per thousand impression. Make sure to capture your audiences attention in your business displays with our gratis customizable PPC Marketing KPI Dashboard To Analyse Strategy Efficiency Icons PDF. These are great for business strategies, office conferences, capital raising or task suggestions. If you desire to acquire more customers for your tech business and ensure they stay satisfied, create your own sales presentation with these plain slides.
Cost And Purchase Order Procurement Dashboard Icons PDF
This slide provides an overview of the cost and purchase order-related performance indicators to improve efficiency and optimize processes. The dashboard includes the cost of the purchase order, cost reduction, savings, procurement ROI and top 5 suppliers. If you are looking for a format to display your unique thoughts, then the professionally designed Cost And Purchase Order Procurement Dashboard Icons PDF is the one for you. You can use it as a Google Slides template or a PowerPoint template. Incorporate impressive visuals, symbols, images, and other charts. Modify or reorganize the text boxes as you desire. Experiment with shade schemes and font pairings. Alter, share or cooperate with other people on your work. Download Cost And Purchase Order Procurement Dashboard Icons PDF and find out how to give a successful presentation. Present a perfect display to your team and make your presentation unforgettable.

Dashboard To Measure Workflow Performance Post RPA Implementation Demonstration PDF
This slide presents a dashboard to measure the overall operation performance after RPA implementation. It includes return on investment, bot numbers, saved hours, capital, bots runtime, time saved by bots, and workflow processes. If you are looking for a format to display your unique thoughts, then the professionally designed Dashboard To Measure Workflow Performance Post RPA Implementation Demonstration PDF is the one for you. You can use it as a Google Slides template or a PowerPoint template. Incorporate impressive visuals, symbols, images, and other charts. Modify or reorganize the text boxes as you desire. Experiment with shade schemes and font pairings. Alter, share or cooperate with other people on your work. Download Dashboard To Measure Workflow Performance Post RPA Implementation Demonstration PDF and find out how to give a successful presentation. Present a perfect display to your team and make your presentation unforgettable.
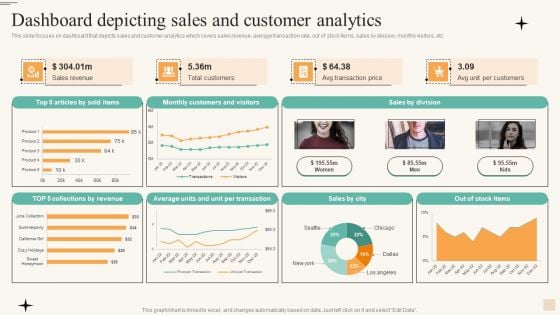
Dashboard Depicting Sales And Customer Analytics Infographics PDF
This slide focuses on dashboard that depicts sales and customer analytics which covers sales revenue, average transaction rate, out of stock items, sales by division, monthly visitors, etc. If you are looking for a format to display your unique thoughts, then the professionally designed Dashboard Depicting Sales And Customer Analytics Infographics PDF is the one for you. You can use it as a Google Slides template or a PowerPoint template. Incorporate impressive visuals, symbols, images, and other charts. Modify or reorganize the text boxes as you desire. Experiment with shade schemes and font pairings. Alter, share or cooperate with other people on your work. Download Dashboard Depicting Sales And Customer Analytics Infographics PDF and find out how to give a successful presentation. Present a perfect display to your team and make your presentation unforgettable.
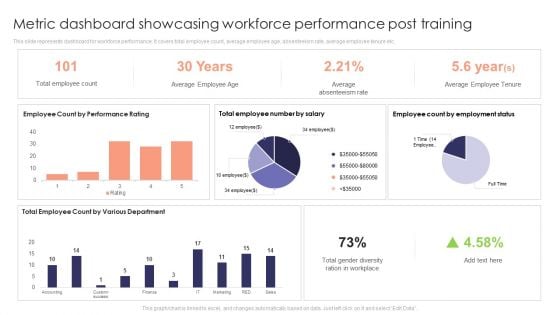
Metric Dashboard Showcasing Workforce Performance Post Training Ideas PDF
This slide represents dashboard for workforce performance. It covers total employee count, average employee age, absenteeism rate, average employee tenure etc. If you are looking for a format to display your unique thoughts, then the professionally designed Metric Dashboard Showcasing Workforce Performance Post Training Ideas PDF is the one for you. You can use it as a Google Slides template or a PowerPoint template. Incorporate impressive visuals, symbols, images, and other charts. Modify or reorganize the text boxes as you desire. Experiment with shade schemes and font pairings. Alter, share or cooperate with other people on your work. Download Metric Dashboard Showcasing Workforce Performance Post Training Ideas PDF and find out how to give a successful presentation. Present a perfect display to your team and make your presentation unforgettable.
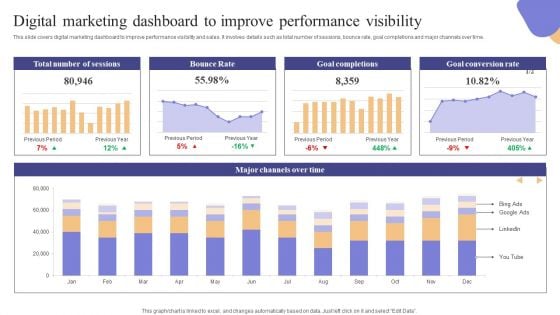
Digital Marketing Dashboard To Improve Performance Visibility Brochure PDF
This slide covers digital marketing dashboard to improve performance visibility and sales. It involves details such as total number of sessions, bounce rate, goal completions and major channels over time. If you are looking for a format to display your unique thoughts, then the professionally designed Digital Marketing Dashboard To Improve Performance Visibility Brochure PDF is the one for you. You can use it as a Google Slides template or a PowerPoint template. Incorporate impressive visuals, symbols, images, and other charts. Modify or reorganize the text boxes as you desire. Experiment with shade schemes and font pairings. Alter, share or cooperate with other people on your work. Download Digital Marketing Dashboard To Improve Performance Visibility Brochure PDF and find out how to give a successful presentation. Present a perfect display to your team and make your presentation unforgettable.
Activity Tracking Dashboard For Umbrella Brand Topics PDF
This slide provides information regarding activities tracking dashboard for umbrella brand in terms of customer retention, market share, etc. If you are looking for a format to display your unique thoughts, then the professionally designed Activity Tracking Dashboard For Umbrella Brand Topics PDF is the one for you. You can use it as a Google Slides template or a PowerPoint template. Incorporate impressive visuals, symbols, images, and other charts. Modify or reorganize the text boxes as you desire. Experiment with shade schemes and font pairings. Alter, share or cooperate with other people on your work. Download Activity Tracking Dashboard For Umbrella Brand Topics PDF and find out how to give a successful presentation. Present a perfect display to your team and make your presentation unforgettable.
Product And Customer Performance Tracking Dashboard Summary PDF
This slide provides information regarding dashboard utilized by firm to monitor performance of products offered and customer associated. The performance is tracked through revenues generated, new customer acquired, customer satisfaction, sales comparison, etc. If you are looking for a format to display your unique thoughts, then the professionally designed Product And Customer Performance Tracking Dashboard Summary PDF is the one for you. You can use it as a Google Slides template or a PowerPoint template. Incorporate impressive visuals, symbols, images, and other charts. Modify or reorganize the text boxes as you desire. Experiment with shade schemes and font pairings. Alter, share or cooperate with other people on your work. Download Product And Customer Performance Tracking Dashboard Summary PDF and find out how to give a successful presentation. Present a perfect display to your team and make your presentation unforgettable.
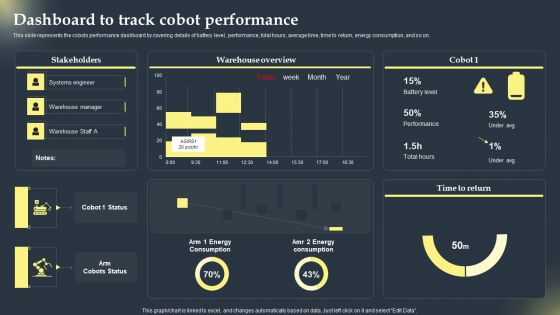
Cobots Global Statistics Dashboard To Track Cobot Performance Mockup PDF
This slide represents the cobots performance dashboard by covering details of battery level, performance, total hours, average time, time to return, energy consumption, and so on. If you are looking for a format to display your unique thoughts, then the professionally designed Cobots Global Statistics Dashboard To Track Cobot Performance Mockup PDF is the one for you. You can use it as a Google Slides template or a PowerPoint template. Incorporate impressive visuals, symbols, images, and other charts. Modify or reorganize the text boxes as you desire. Experiment with shade schemes and font pairings. Alter, share or cooperate with other people on your work. Download Cobots Global Statistics Dashboard To Track Cobot Performance Mockup PDF and find out how to give a successful presentation. Present a perfect display to your team and make your presentation unforgettable.
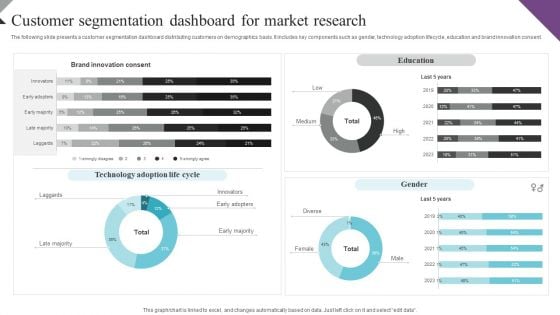
Customer Segmentation And Behavioral Analysis Customer Segmentation Dashboard Designs PDF
The following slide presents a customer segmentation dashboard distributing customers on demographics basis. It includes key components such as gender, technology adoption lifecycle, education and brand innovation consent. If you are looking for a format to display your unique thoughts, then the professionally designed Customer Segmentation And Behavioral Analysis Customer Segmentation Dashboard Designs PDF is the one for you. You can use it as a Google Slides template or a PowerPoint template. Incorporate impressive visuals, symbols, images, and other charts. Modify or reorganize the text boxes as you desire. Experiment with shade schemes and font pairings. Alter, share or cooperate with other people on your work. Download Customer Segmentation And Behavioral Analysis Customer Segmentation Dashboard Designs PDF and find out how to give a successful presentation. Present a perfect display to your team and make your presentation unforgettable.


 Continue with Email

 Home
Home


