Executive Dashboard
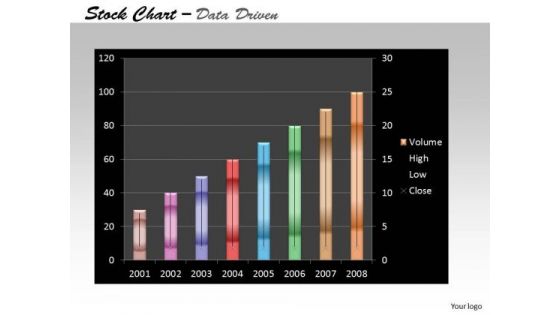
Data Analysis On Excel Driven Stock Chart For Business Growth PowerPoint Slides Templates
Add Some Dramatization To Your Thoughts. Our data analysis on excel driven stock chart for business growth powerpoint slides Templates Make Useful Props.
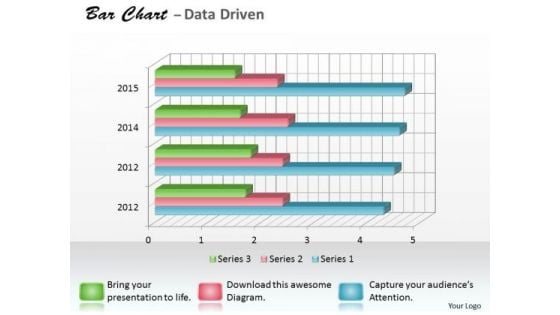
Data Analysis Programs 3d Bar Chart For Research In Statistics PowerPoint Templates
Draw It Out On Our data analysis programs 3d bar chart for research in statistics Powerpoint Templates . Provide Inspiration To Your Colleagues.
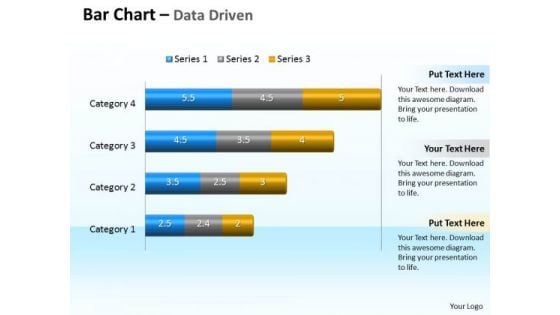
Data Analysis Programs 3d Bar Chart To Compare Categories PowerPoint Templates
Discover Decisive Moments With Our data analysis programs 3d bar chart to compare categories Powerpoint Templates . They Help Make That Crucial Difference.
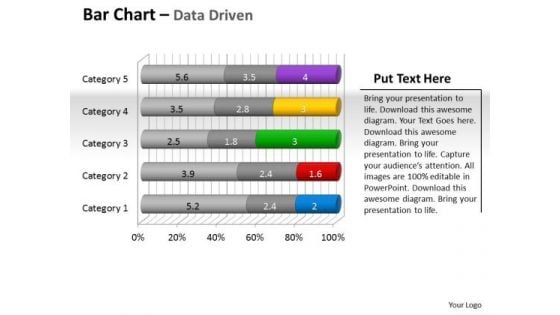
Data Analysis Programs 3d Bar Chart To Put Information PowerPoint Templates
Draw Up Your Agenda On Our data analysis programs 3d bar chart to put information Powerpoint Templates . Coax Your Audience Into Acceptance.
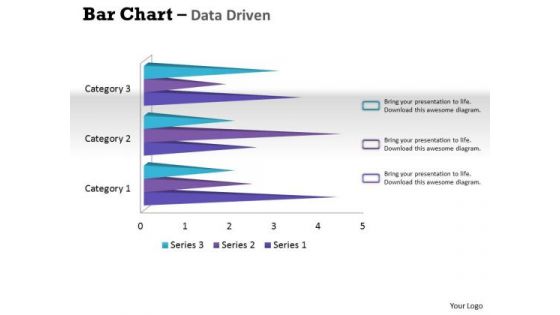
Data Analysis Techniques 3d Bar Chart For Financial Solutions PowerPoint Templates
Make Your Dreams A Reality With Our data analysis techniques 3d bar chart for financial solutions Powerpoint Templates . Your Ideas Will Begin To Take Shape.

Data Analysis Template Driven Express Business Facts Pie Chart PowerPoint Slides Templates
Display Your Drive On Our data analysis template driven express business facts pie chart powerpoint slides Templates . Invigorate The Audience With Your Fervor.
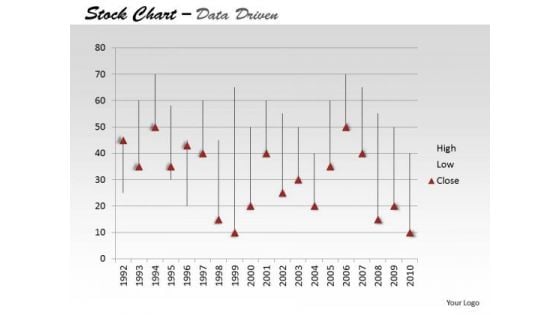
Data Analysis Template Driven Ineract With Stock Chart PowerPoint Slides Templates
Drive Your Passion With Our data analysis template driven ineract with stock chart powerpoint slides Templates . Steer Yourself To Achieve Your Aims.
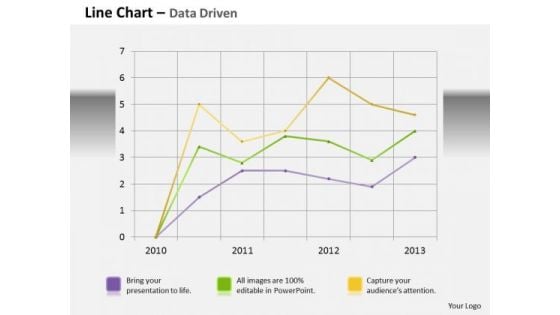
Data Analysis Template Driven Line Chart Business Graph PowerPoint Slides Templates
Bottle Your Thoughts In Our data analysis template driven line chart business graph powerpoint slides Templates . Pass It Around For Your Audience To Sip.
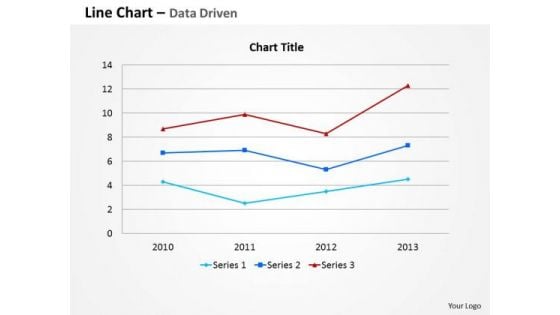
Data Analysis Template Driven Line Chart For Business Information PowerPoint Slides Templates
Your Thoughts Are Dripping With Wisdom. Lace It With Our data analysis template driven line chart for business information powerpoint slides Templates .
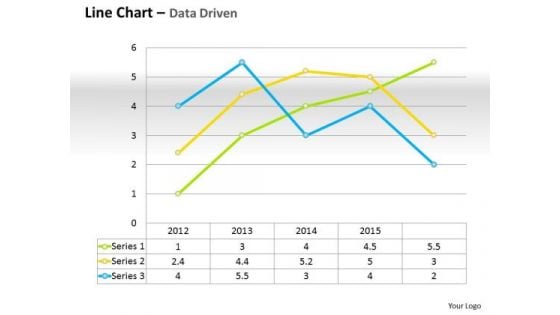
Data Analysis Template Driven Line Chart For Business Performance PowerPoint Slides Templates
Do Not Allow Things To Drift. Ring In Changes With Our data analysis template driven line chart for business performance powerpoint slides Templates .
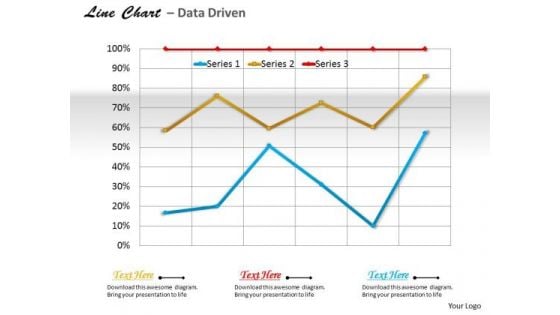
Data Analysis Template Driven Line Chart For Business Trends PowerPoint Slides Templates
Use Our data analysis template driven line chart for business trends powerpoint slides Templates As The Bit. Drill Your Thoughts Into Their Minds.
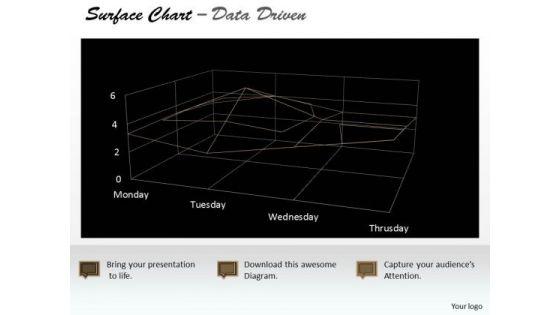
Data Analysis Template Driven Surface Chart Indicating Areas PowerPoint Slides Templates
Highlight Your Drive With Our data analysis template driven surface chart indicating areas powerpoint slides Templates . Prove The Fact That You Have Control.
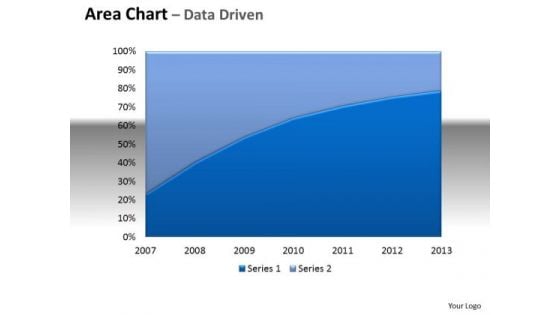
Financial Data Analysis Area Chart With Plotted Line Center PowerPoint Templates
Be The Doer With Our financial data analysis area chart with plotted line center Powerpoint Templates . Put Your Thoughts Into Practice.
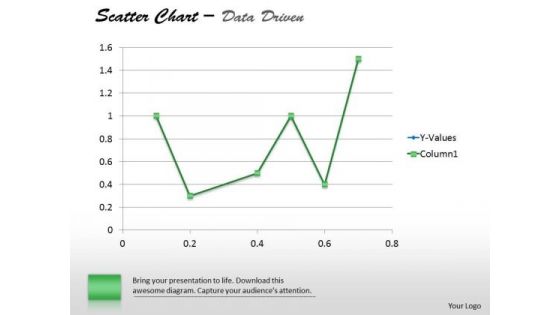
Financial Data Analysis Driven Demonstrate Statistics With Scatter Chart PowerPoint Slides Templates
Establish The Dominance Of Your Ideas. Our financial data analysis driven demonstrate statistics with scatter chart powerpoint slides Templates Will Put Them On Top.
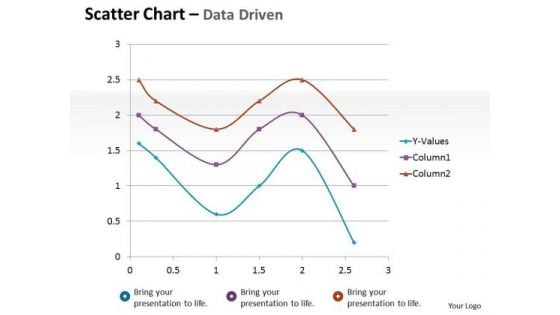
Financial Data Analysis Driven Scatter Chart Mathematical Diagram PowerPoint Slides Templates
Dominate Proceedings With Your Ideas. Our financial data analysis driven scatter chart mathematical diagram powerpoint slides Templates Will Empower Your Thoughts.
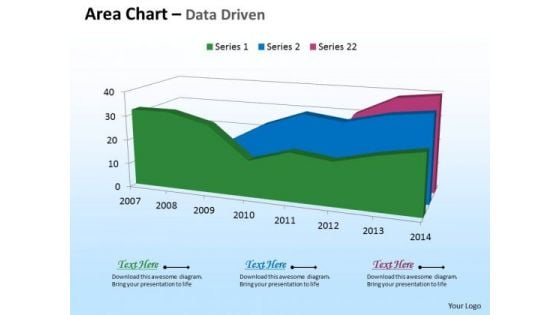
Microsoft Excel Data Analysis 3d Area Chart For Time Based PowerPoint Templates
Deliver The Right Dose With Our microsoft excel data analysis 3d area chart for time based Powerpoint Templates . Your Ideas Will Get The Correct Illumination.
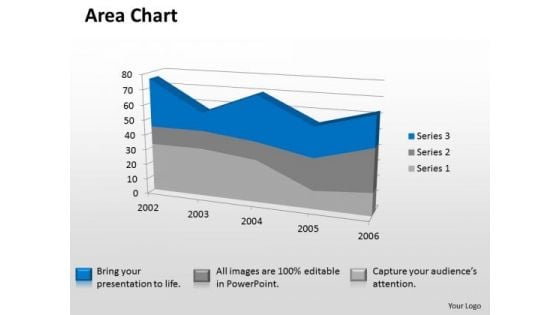
Microsoft Excel Data Analysis 3d Area Chart Showimg Change In Values PowerPoint Templates
Our microsoft excel data analysis 3d area chart showimg change in values Powerpoint Templates Deliver At Your Doorstep. Let Them In For A Wonderful Experience.
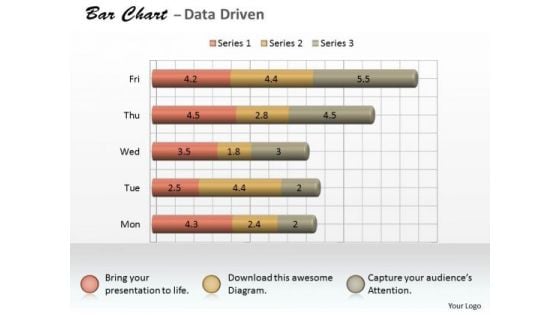
Microsoft Excel Data Analysis 3d Bar Chart As Research Tool PowerPoint Templates
Knock On The Door To Success With Our microsoft excel data analysis 3d bar chart as research tool Powerpoint Templates . Be Assured Of Gaining Entry.
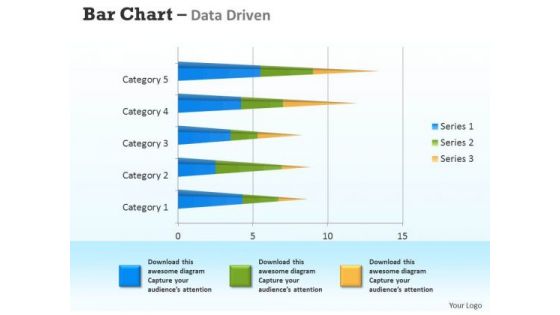
Microsoft Excel Data Analysis 3d Bar Chart For Analyzing Survey PowerPoint Templates
Connect The Dots With Our microsoft excel data analysis 3d bar chart for analyzing survey Powerpoint Templates . Watch The Whole Picture Clearly Emerge.
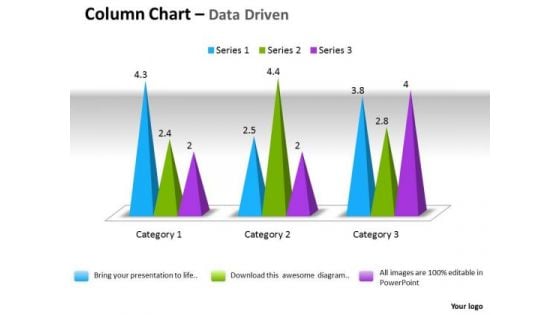
Microsoft Excel Data Analysis 3d Change In Business Process Chart PowerPoint Templates
Double Your Chances With Our microsoft excel data analysis 3d change in business process chart Powerpoint Templates . The Value Of Your Thoughts Will Increase Two-Fold.
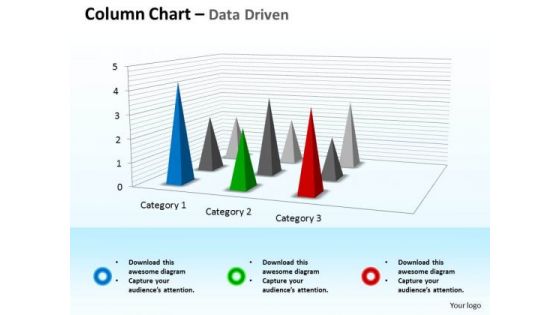
Microsoft Excel Data Analysis 3d Chart For Business Observation PowerPoint Templates
Double Up Our microsoft excel data analysis 3d chart for business observation Powerpoint Templates With Your Thoughts. They Will Make An Awesome Pair.
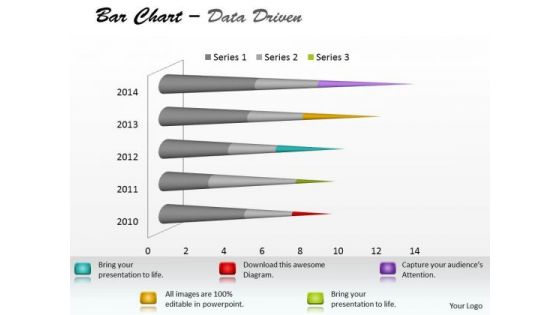
Microsoft Excel Data Analysis Bar Chart To Communicate Information PowerPoint Templates
With Our microsoft excel data analysis bar chart to communicate information Powerpoint Templates You Will Be Doubly Sure. They Possess That Stamp Of Authority.
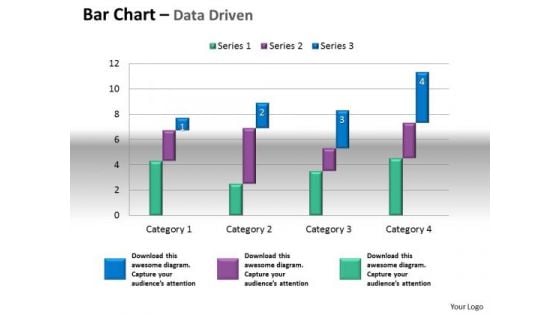
Microsoft Excel Data Analysis Bar Chart To Compare Quantities PowerPoint Templates
Our microsoft excel data analysis bar chart to compare quantities Powerpoint Templates Leave No One In Doubt. Provide A Certainty To Your Views.
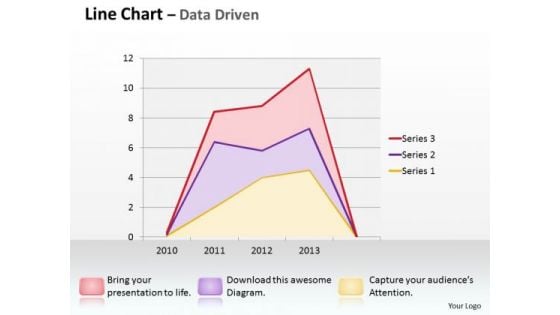
Multivariate Data Analysis Driven Line Chart Shows Revenue Trends PowerPoint Slides Templates
Good Camaraderie Is A Key To Teamwork. Our multivariate data analysis driven line chart shows revenue trends powerpoint slides Templates Can Be A Cementing Force.
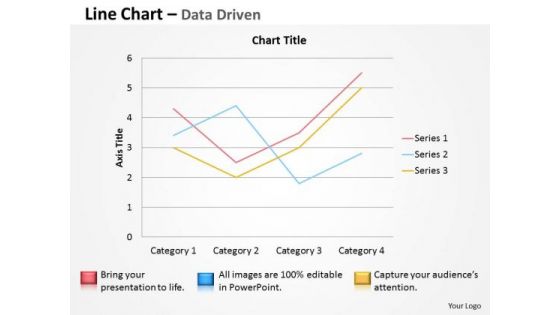
Multivariate Data Analysis Driven Line Chart To Demonstrate PowerPoint Slides Templates
Brace Yourself, Arm Your Thoughts. Prepare For The Hustle With Our multivariate data analysis driven line chart to demonstrate powerpoint slides Templates .
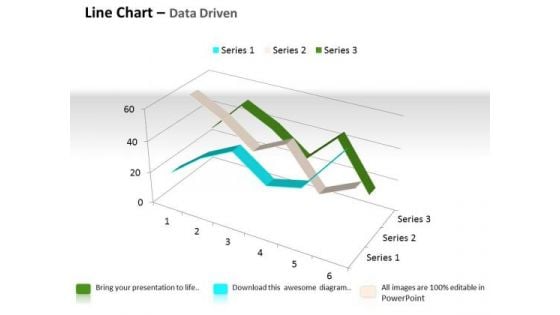
Quantitative Data Analysis 3d Line Chart For Comparison Of PowerPoint Templates
Touch Base With Our quantitative data analysis 3d line chart for comparison of Powerpoint Templates . Review Your Growth With Your Audience.

Quantitative Data Analysis 3d Pie Chart For Business Process PowerPoint Templates
Put Them On The Same Page With Our quantitative data analysis 3d pie chart for business process Powerpoint Templates . Your Team Will Sing From The Same Sheet.
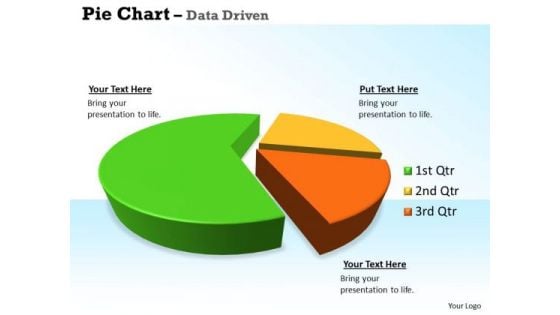
Quantitative Data Analysis 3d Pie Chart For Business Statistics PowerPoint Templates
Our quantitative data analysis 3d pie chart for business statistics Powerpoint Templates Allow You To Do It With Ease. Just Like Picking The Low Hanging Fruit.
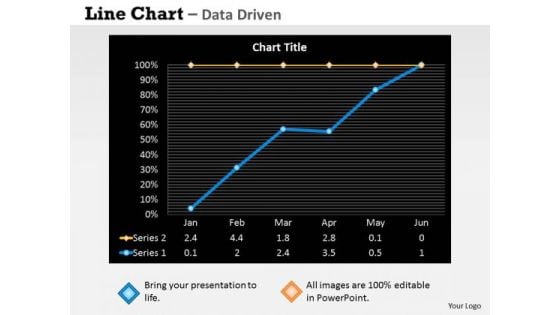
Quantitative Data Analysis Driven Economic Status Line Chart PowerPoint Slides Templates
Be The Dramatist With Our quantitative data analysis driven economic status line chart powerpoint slides Templates . Script Out The Play Of Words.
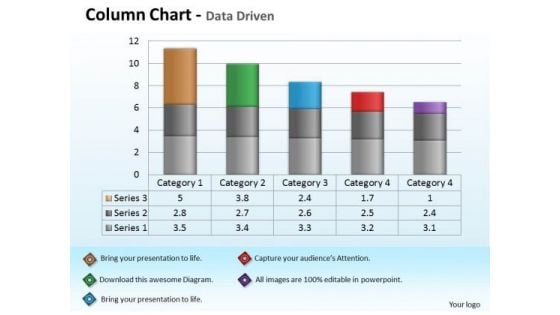
Quantitative Data Analysis Driven Economic With Column Chart PowerPoint Slides Templates
Add Some Dramatization To Your Thoughts. Our quantitative data analysis driven economic with column chart powerpoint slides Templates Make Useful Props.

Fishbone Ishikawa Cause And Effect Analysis Magnifying Glass Ppt PowerPoint Presentation Summary Objects PDF
Presenting this set of slides with name fishbone ishikawa cause and effect analysis magnifying glass ppt powerpoint presentation summary objects pdf. This is a four stage process. The stages in this process are magnifying glass. This is a completely editable PowerPoint presentation and is available for immediate download. Download now and impress your audience.
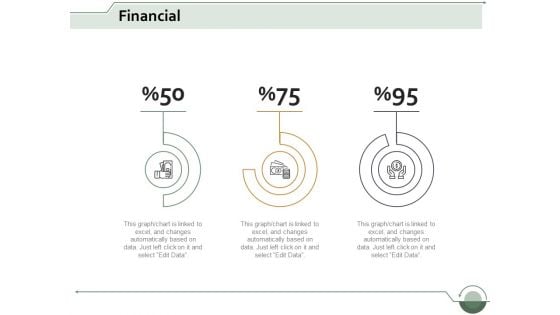
financial analysis ppt powerpoint presentation styles objects
This is a financial analysis ppt powerpoint presentation styles objects. This is a three stage process. The stages in this process are dashboard, business, marketing, management, planning.
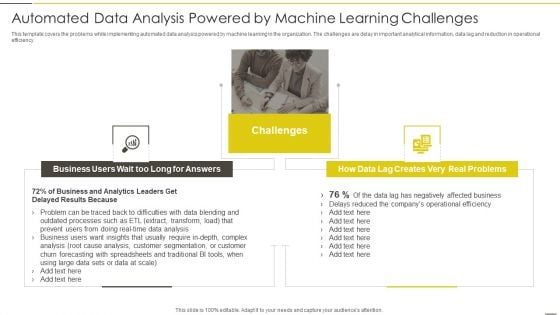
Administered Data And Analytic Quality Playbook Automated Data Analysis Powered Structure PDF
This template covers the problems while implementing automated data analysis powered by machine learning in the organization. The challenges are delay in important analytical information, data lag and reduction in operational efficiency.This is a Administered Data And Analytic Quality Playbook Automated Data Analysis Powered Structure PDF template with various stages. Focus and dispense information on two stages using this creative set, that comes with editable features. It contains large content boxes to add your information on topics like Business Analytics, Challenges Negatively, Affected Business You can also showcase facts, figures, and other relevant content using this PPT layout. Grab it now.
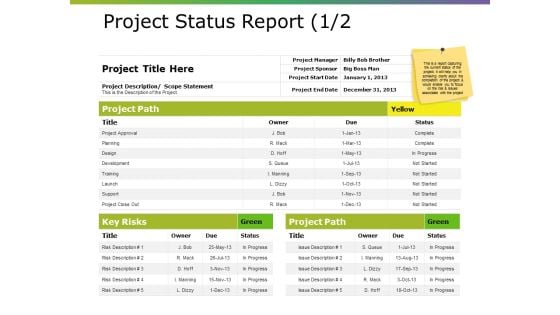
Project Status Report Ppt PowerPoint Presentation Portfolio Structure
This is a project status report ppt powerpoint presentation portfolio structure. This is a three stage process. The stages in this process are project path, key risks, project approval, planning, design.
External Analysis Labour Market Forecasts Ppt PowerPoint Presentation Icon Guidelines
This is a external analysis labour market forecasts ppt powerpoint presentation icon guidelines. This is a seven stage process. The stages in this process are labour market characteristic, tables, data, analysis, planning.

Magnifying Glass Ppt PowerPoint Presentation Layouts Guide
This is a magnifying glass ppt powerpoint presentation layouts guide. This is a six stage process. The stages in this process are magnifying glass, process, business, marketing, technology.

BI Implementation To Enhance Hiring Process Roles And Responsibi Lities By Stages Of BI Implementation Introduction PDF
This slide represents the responsibilities performed by different key stakeholders at the time of implementation of business intelligence in organization. It includes roles and responsibilities of business executive, BI head, data analytics, BI engineer etc.Retrieve professionally designed BI Implementation To Enhance Hiring Process Roles And Responsibi Lities By Stages Of BI Implementation Introduction PDF to effectively convey your message and captivate your listeners. Save time by selecting pre-made slideshows that are appropriate for various topics, from business to educational purposes. These themes come in many different styles, from creative to corporate, and all of them are easily adjustable and can be edited quickly. Access them as PowerPoint templates or as Google Slides themes. You do not have to go on a hunt for the perfect presentation because Slidegeeks got you covered from everywhere.
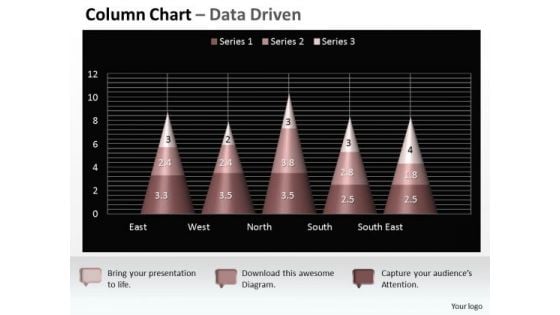
Data Analysis On Excel 3d Chart Shows Interrelated Sets Of PowerPoint Templates
Put Them On The Same Page With Our data analysis on excel 3d chart shows interrelated sets of Powerpoint Templates . Your Team Will Sing From The Same Sheet.
Medical DNA Structure Analysis Vector Icon Ppt PowerPoint Presentation File Sample PDF
Persuade your audience using this medical dna structure analysis vector icon ppt powerpoint presentation file sample pdf. This PPT design covers three stages, thus making it a great tool to use. It also caters to a variety of topics including medical dna structure analysis vector icon. Download this PPT design now to present a convincing pitch that not only emphasizes the topic but also showcases your presentation skills.
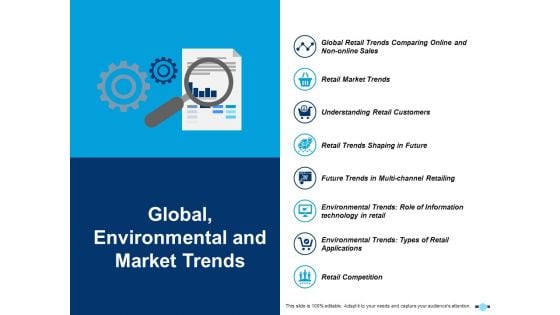
Global Environmental And Market Trends Retail Market Trends Ppt PowerPoint Presentation Styles Information
This is a global environmental and market trends retail market trends ppt powerpoint presentation styles information. This is a eight stage process. The stages in this process are icons, management, strategy, analysis, marketing.
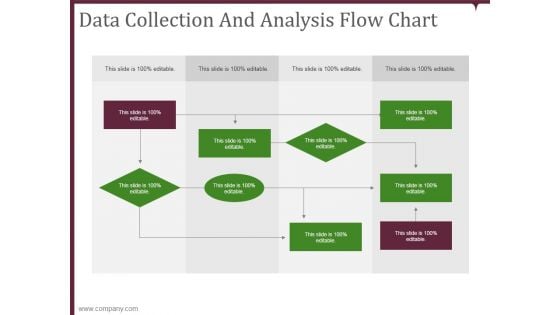
data collection and analysis flow chart ppt powerpoint presentation microsoft
This is a data collection and analysis flow chart ppt powerpoint presentation microsoft. This is a nine stage process. The stages in this process are business, planning, marketing, strategy, management.
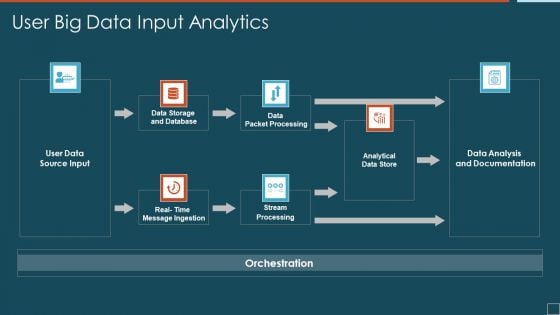
User Big Data Input Analytics Designs PDF
Showcasing this set of slides titled user big data input analytics designs pdf. The topics addressed in these templates are analytical data store, data packet processing, stream processing. All the content presented in this PPT design is completely editable. Download it and make adjustments in color, background, font etc. as per your unique business setting.
Bar Chart Business Analytics Vector Icon Ppt PowerPoint Presentation Layouts Shapes
Presenting this set of slides with name bar chart business analytics vector icon ppt powerpoint presentation layouts shapes. This is a three stage process. The stages in this process are data visualization icon, research analysis, business focus. This is a completely editable PowerPoint presentation and is available for immediate download. Download now and impress your audience.
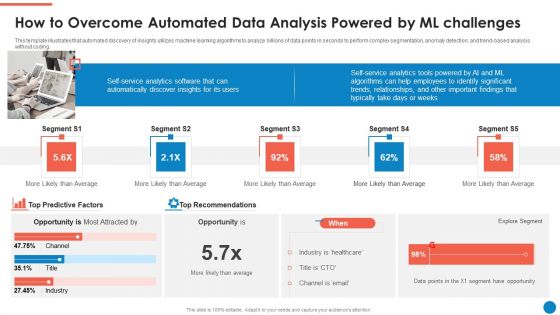
Data And Analytics Playbook How To Overcome Automated Data Analysis Powered By Ml Diagrams PDF
This template illustrates that automated discovery of insights utilizes machine learning algorithms to analyze billions of data points in seconds to perform complex segmentation, anomaly detection, and trend-based analysis without coding. This is a Data And Analytics Playbook How To Overcome Automated Data Analysis Powered By Ml Diagrams PDF template with various stages. Focus and dispense information on one stages using this creative set, that comes with editable features. It contains large content boxes to add your information on topics like Self Service Analytics Software, Top Recommendations, Explore Segment. You can also showcase facts, figures, and other relevant content using this PPT layout. Grab it now.
Data Research And Analysis Vector Icon Ppt PowerPoint Presentation Icon Background Image PDF
Presenting data research and analysis vector icon ppt powerpoint presentation icon background image pdf to dispense important information. This template comprises three stages. It also presents valuable insights into the topics including data research and analysis vector icon. This is a completely customizable PowerPoint theme that can be put to use immediately. So, download it and address the topic impactfully.
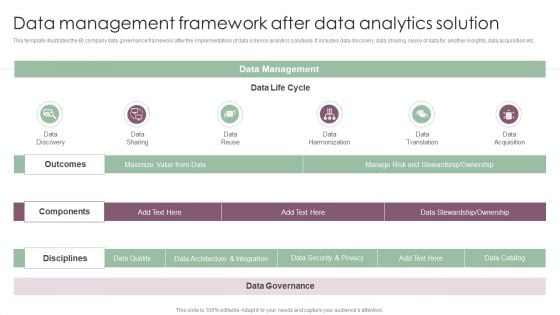
Information Analysis And BI Playbook Data Management Framework After Data Analytics Solution Template PDF
This template illustrates the BI company data governance framework after the implementation of data science analytics solutions. It includes data discovery, data sharing, reuse of data for another insights, data acquisition etc. Are you in need of a template that can accommodate all of your creative concepts This one is crafted professionally and can be altered to fit any style. Use it with Google Slides or PowerPoint. Include striking photographs, symbols, depictions, and other visuals. Fill, move around, or remove text boxes as desired. Test out color palettes and font mixtures. Edit and save your work, or work with colleagues. Download Information Analysis And BI Playbook Data Management Framework After Data Analytics Solution Template PDF and observe how to make your presentation outstanding. Give an impeccable presentation to your group and make your presentation unforgettable.
Business Data Insights Report Icon Download PDF
Showcasing this set of slides titled Business Data Insights Report Icon Download PDF. The topics addressed in these templates are Business, Data Insights, Report. All the content presented in this PPT design is completely editable. Download it and make adjustments in color, background, font etc. as per your unique business setting.
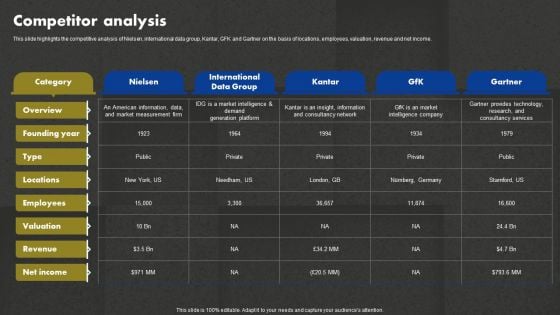
Data And Customer Analysis Company Outline Competitor Analysis Topics PDF
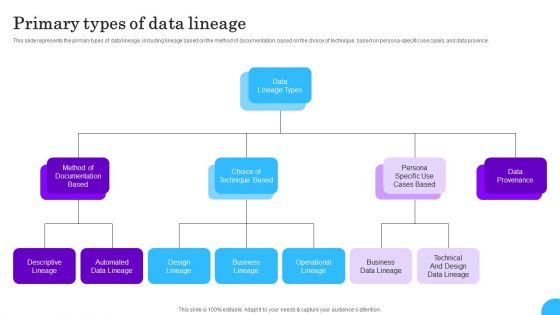
Comprehensive Analysis Of Different Data Lineage Classification Primary Types Of Data Lineage Designs PDF
This slide represents the primary types of data lineage, including lineage based on the method of documentation, based on the choice of technique, based on persona specific use cases, and data province. From laying roadmaps to briefing everything in detail, our templates are perfect for you. You can set the stage with your presentation slides. All you have to do is download these easy to edit and customizable templates. Comprehensive Analysis Of Different Data Lineage Classification Primary Types Of Data Lineage Designs PDF will help you deliver an outstanding performance that everyone would remember and praise you for. Do download this presentation today.
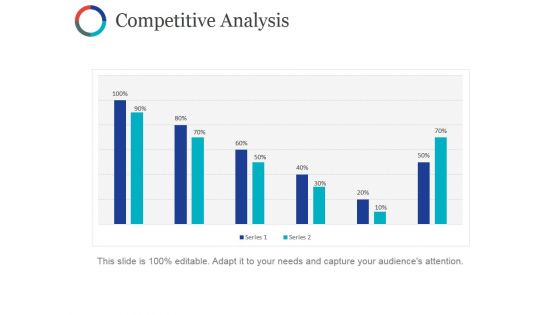
Competitive Analysis Template Ppt PowerPoint Presentation Infographic Template Files
This is a competitive analysis template ppt powerpoint presentation infographic template files. This is a twelve stage process. The stages in this process are table, data analysis, business, marketing, strategy.
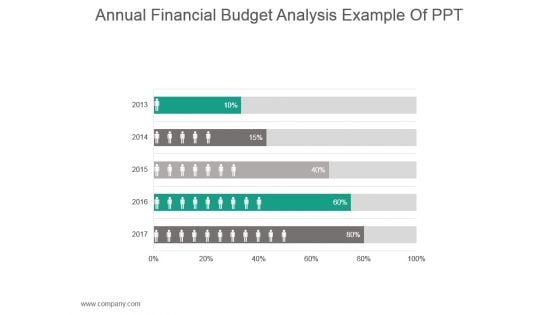
Annual Financial Budget Analysis Example Of Ppt
This is a annual financial budget analysis example of ppt. This is a five stage process. The stages in this process are business, strategy, finance, planning, compare.
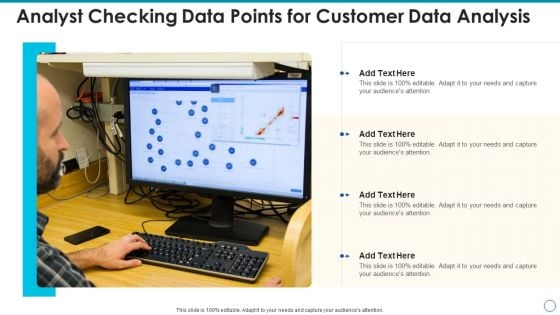
Analyst Checking Data Points For Customer Data Analysis Demonstration PDF
Presenting analyst checking data points for customer data analysis demonstration pdf to dispense important information. This template comprises four stages. It also presents valuable insights into the topics including analyst checking data points for customer data analysis. This is a completely customizable PowerPoint theme that can be put to use immediately. So, download it and address the topic impactfully.
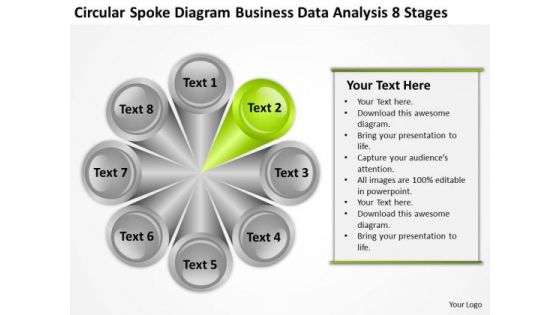
Business Data Analysis 8 Stages Ppt Plan Example PowerPoint Templates
We present our business data analysis 8 stages ppt plan example PowerPoint templates.Download and present our Process and Flows PowerPoint Templates because Our PowerPoint Templates and Slides will bullet point your ideas. See them fall into place one by one. Download our Circle Charts PowerPoint Templates because These PowerPoint Templates and Slides will give the updraft to your ideas. See them soar to great heights with ease. Present our Shapes PowerPoint Templates because Our PowerPoint Templates and Slides help you meet the demand of the Market. Just browse and pick the slides that appeal to your intuitive senses. Download our Flow Charts PowerPoint Templates because Our PowerPoint Templates and Slides are created by a hardworking bunch of busybees. Always flitting around with solutions gauranteed to please. Use our Business PowerPoint Templates because Our PowerPoint Templates and Slides will bullet point your ideas. See them fall into place one by one.Use these PowerPoint slides for presentations relating to Abstract, business, catalog, chart, circle, colors, cross, demonstration, description, design, diagram, futuristic, glossy, goals,illustration, information, interface, internet, isolated, level, list, marketing, model, multiple, navigation, network, pattern, presentation, registry, report, space, sphere, statement, statistics, steps, structure, wheel. The prominent colors used in the PowerPoint template are Gray, Green, White. Our Business Data Analysis 8 Stages Ppt Plan Example PowerPoint Templates offer easy availability and access. You will find them always around.
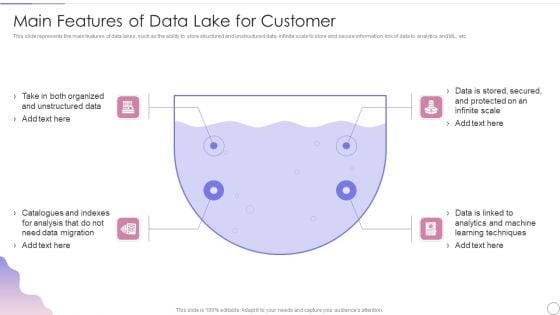
Data Lake Architecture Future Of Data Analysis Main Features Of Data Lake For Customer Ideas PDF
This slide represents the main features of data lakes, such as the ability to store structured and unstructured data, infinite scale to store and secure information, link of data to analytics and ML, etc.This is a Data Lake Architecture Future Of Data Analysis Main Features Of Data Lake For Customer Ideas PDF template with various stages. Focus and dispense information on four stages using this creative set, that comes with editable features. It contains large content boxes to add your information on topics like Organized And Unstructured, Catalogues And Indexes, Data Migration. You can also showcase facts, figures, and other relevant content using this PPT layout. Grab it now.
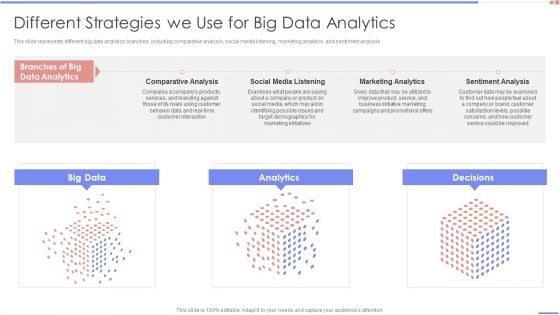
Data Analytics Management Different Strategies We Use For Big Data Analytics Ideas PDF
This slide represents different big data analytics branches, including comparative analysis, social media listening, marketing analytics, and sentiment analysis.Deliver an awe inspiring pitch with this creative Data Analytics Management Different Strategies We Use For Big Data Analytics Ideas PDF bundle. Topics like Comparative Analysis, Media Listening, Marketing Analytics can be discussed with this completely editable template. It is available for immediate download depending on the needs and requirements of the user.
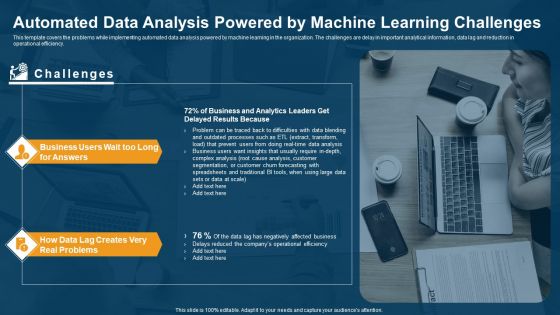
Data Interpretation And Analysis Playbook Automated Data Analysis Powered By Machine Learning Challenges Summary PDF
This template covers the problems while implementing automated data analysis powered by machine learning in the organization. The challenges are delay in important analytical information, data lag and reduction in operational efficiency. Presenting data interpretation and analysis playbook automated data analysis powered by machine learning challenges summary pdf to provide visual cues and insights. Share and navigate important information on two stages that need your due attention. This template can be used to pitch topics like operational, efficiency, business, analysis. In addtion, this PPT design contains high resolution images, graphics, etc, that are easily editable and available for immediate download.
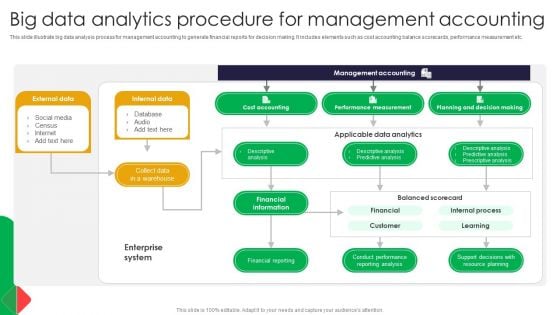
Big Data Analytics Procedure For Management Accounting Formats PDF
This slide illustrate big data analysis process for management accounting to generate financial reports for decision making. It includes elements such as cost accounting balance scorecards, performance measurement etc. Showcasing this set of slides titled Big Data Analytics Procedure For Management Accounting Formats PDF. The topics addressed in these templates are Accounting, Internal Data, Social Media. All the content presented in this PPT design is completely editable. Download it and make adjustments in color, background, font etc. as per your unique business setting.
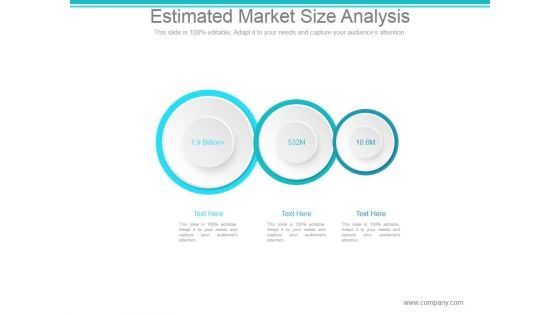
Estimated Market Size Analysis Ppt PowerPoint Presentation Slide Download
This is a estimated market size analysis ppt powerpoint presentation slide download. This is a three stage process. The stages in this process are billion, market, business.
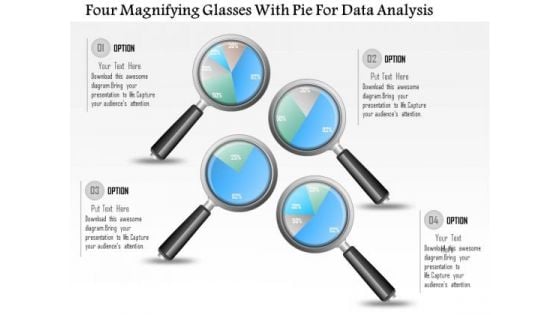
Business Diagram Four Magnifying Glasses With Pie For Data Analysis PowerPoint Slide
This business diagram displays graphic of pie charts in shape of magnifying glasses This business slide is suitable to present and compare business data. Use this diagram to build professional presentations for your viewers.

Business Diagram Four Pie Chart For Data Driven Result Analysis Of Business PowerPoint Slide
This business diagram displays graphic of pie charts in shape of flasks. This business slide is suitable to present and compare business data. Use this diagram to build professional presentations for your viewers.


 Continue with Email

 Home
Home


