Executive Dashboard
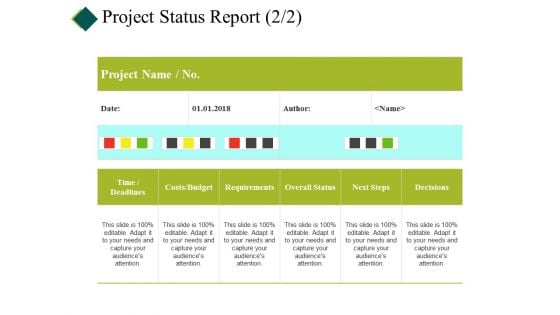
Project Status Report Template Ppt PowerPoint Presentation Infographics Ideas
This is a project status report template ppt powerpoint presentation infographics ideas. This is a five stage process. The stages in this process are cost, planning, table, project report, data management.
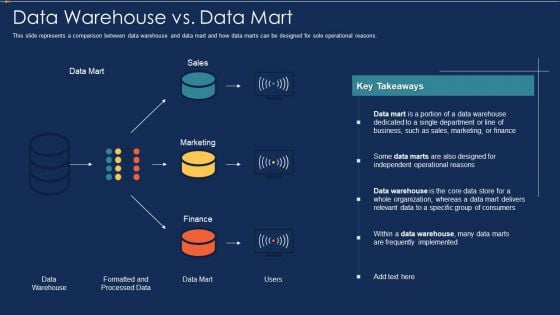
Data Warehousing IT Data Warehouse Vs Data Mart Ppt Infographic Template Background Image PDF
This slide represents a comparison between data warehouse and data mart and how data marts can be designed for sole operational reasons. Deliver an awe inspiring pitch with this creative data warehousing it data warehouse vs data mart ppt infographic template background image pdf bundle. Topics like marketing, finance, sales, formatted and processed data, data mart, data warehouse can be discussed with this completely editable template. It is available for immediate download depending on the needs and requirements of the user.
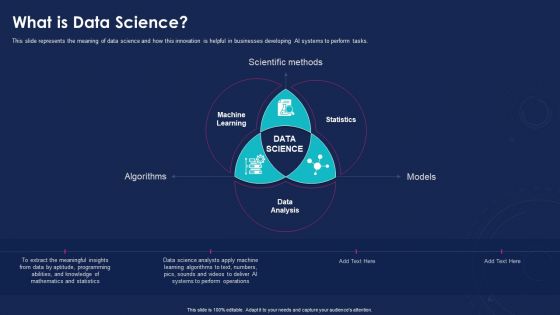
Data Analytics IT What Is Data Science Ppt Infographics Design Templates PDF
This slide represents the meaning of data science and how this innovation is helpful in businesses developing AI systems to perform tasks. This is a data analytics it what is data science ppt infographics design templates pdf template with various stages. Focus and dispense information on three stages using this creative set, that comes with editable features. It contains large content boxes to add your information on topics like algorithms, models, scientific methods. You can also showcase facts, figures, and other relevant content using this PPT layout. Grab it now.
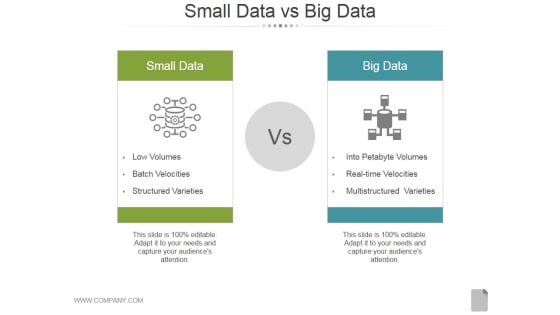
Small Data Vs Big Data Ppt PowerPoint Presentation Inspiration
This is a small data vs big data ppt powerpoint presentation inspiration. This is a two stage process. The stages in this process are low volumes, batch velocities, into petabyte volumes, multistructured varieties, structured varieties.

Business And Financial Analysis Ppt PowerPoint Presentation Inspiration Design Templates
This is a business and financial analysis ppt powerpoint presentation inspiration design templates. This is a eight stage process. The stages in this process are investment, equipment, land cost, interior cost, employee cost.

ROI Calculation Ppt PowerPoint Presentation Complete Deck With Slides
This is a roi calculation ppt powerpoint presentation complete deck with slides. This is a one stage process. The stages in this process are business, planning, strategy, marketing, management.
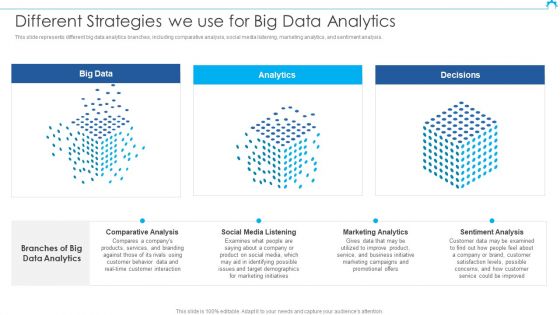
Big Data Architect Different Strategies We Use For Big Data Analytics Background PDF
This slide represents different big data analytics branches, including comparative analysis, social media listening, marketing analytics, and sentiment analysis.Deliver an awe inspiring pitch with this creative Big Data Architect Different Strategies We Use For Big Data Analytics Background PDF bundle. Topics like Comparative Analysis, Media Listening, Marketing Analytics can be discussed with this completely editable template. It is available for immediate download depending on the needs and requirements of the user.
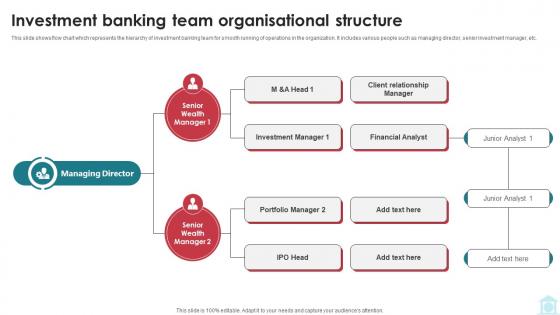
Investment Banking Team Organisational Structure Mastering Investment Banking Fin SS V
This slide shows flow chart which represents the hierarchy of investment banking team for smooth running of operations in the organization. It includes various people such as managing director, senior investment manager, etc. The Investment Banking Team Organisational Structure Mastering Investment Banking Fin SS V is a compilation of the most recent design trends as a series of slides. It is suitable for any subject or industry presentation, containing attractive visuals and photo spots for businesses to clearly express their messages. This template contains a variety of slides for the user to input data, such as structures to contrast two elements, bullet points, and slides for written information. Slidegeeks is prepared to create an impression. This slide shows flow chart which represents the hierarchy of investment banking team for smooth running of operations in the organization. It includes various people such as managing director, senior investment manager, etc.
Mobile Data Analysis Vector Ppt PowerPoint Presentation Icon Slide
This is a mobile data analysis vector ppt powerpoint presentation icon slide. This is a four stage process. The stages in this process are mobile analytics, mobile tracking, mobile web analytics.
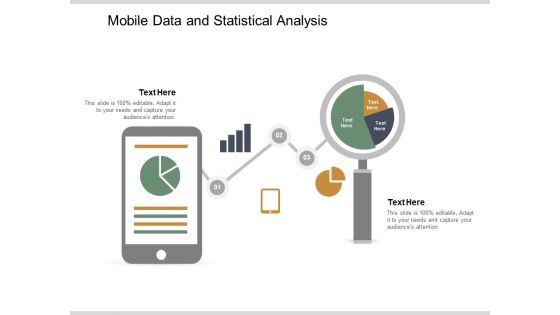
Mobile Data And Statistical Analysis Ppt PowerPoint Presentation Slides Portrait
This is a mobile data and statistical analysis ppt powerpoint presentation slides portrait. This is a two stage process. The stages in this process are mobile analytics, mobile tracking, mobile web analytics.
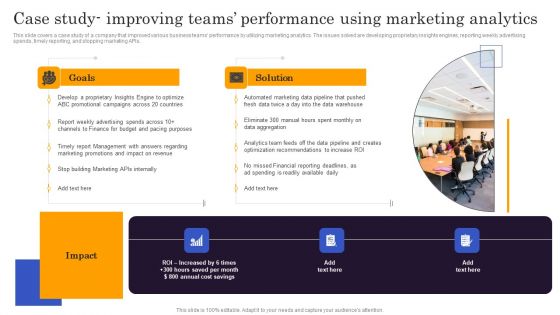
Marketers Guide To Data Analysis Optimization Case Study Improving Teams Performance Using Marketing Professional PDF
This slide covers a case study of a company that improved various business teams performance by utilizing marketing analytics. The issues solved are developing proprietary insights engines, reporting weekly advertising spends, timely reporting, and stopping marketing APIs. Make sure to capture your audiences attention in your business displays with our gratis customizable Marketers Guide To Data Analysis Optimization Case Study Improving Teams Performance Using Marketing Professional PDF. These are great for business strategies, office conferences, capital raising or task suggestions. If you desire to acquire more customers for your tech business and ensure they stay satisfied, create your own sales presentation with these plain slides.
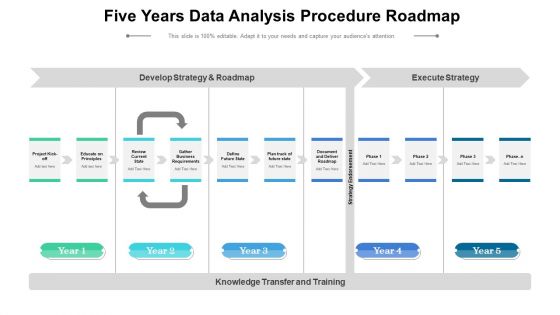
Five Years Data Analysis Procedure Roadmap Infographics
Introducing our five years data analysis procedure roadmap infographics. This PPT presentation is Google Slides compatible, therefore, you can share it easily with the collaborators for measuring the progress. Also, the presentation is available in both standard screen and widescreen aspect ratios. So edit the template design by modifying the font size, font type, color, and shapes as per your requirements. As this PPT design is fully editable it can be presented in PDF, JPG and PNG formats.
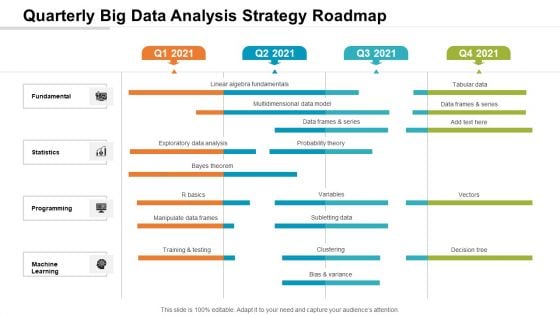
Quarterly Big Data Analysis Strategy Roadmap Infographics
Presenting our jaw-dropping quarterly big data analysis strategy roadmap infographics. You can alternate the color, font size, font type, and shapes of this PPT layout according to your strategic process. This PPT presentation is compatible with Google Slides and is available in both standard screen and widescreen aspect ratios. You can also download this well-researched PowerPoint template design in different formats like PDF, JPG, and PNG. So utilize this visually-appealing design by clicking the download button given below.
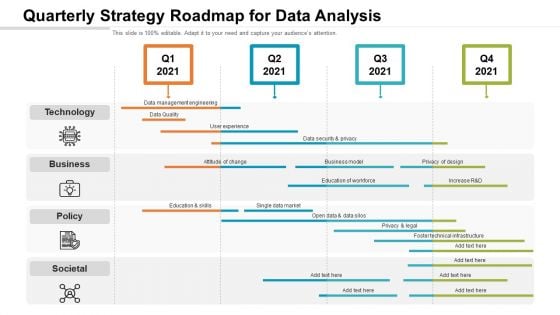
Quarterly Strategy Roadmap For Data Analysis Microsoft
Introducing our quarterly strategy roadmap for data analysis microsoft. This PPT presentation is Google Slides compatible, therefore, you can share it easily with the collaborators for measuring the progress. Also, the presentation is available in both standard screen and widescreen aspect ratios. So edit the template design by modifying the font size, font type, color, and shapes as per your requirements. As this PPT design is fully editable it can be presented in PDF, JPG and PNG formats.

Comparative Analysis Of Quantitative And Qualitative Data Analysis Pictures PDF
Presenting Comparative Analysis Of Quantitative And Qualitative Data Analysis Pictures PDF to dispense important information. This template comprises five stages. It also presents valuable insights into the topics including Data Format, Analysis, Definition. This is a completely customizable PowerPoint theme that can be put to use immediately. So, download it and address the topic impactfully.
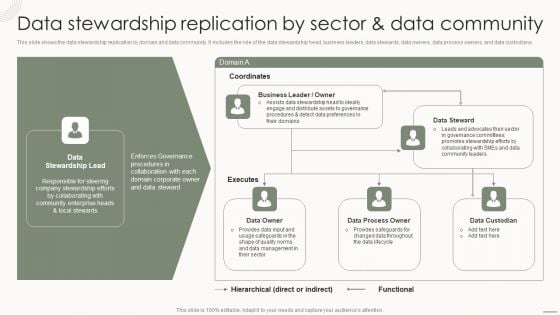
Data Governance IT Data Stewardship Replication By Sector And Data Community Elements PDF
This slide shows the data stewardship replication by domain and data community. It includes the role of the data stewardship head, business leaders, data stewards, data owners, data process owners, and data custodians. Do you have to make sure that everyone on your team knows about any specific topic I yes, then you should give Data Governance IT Data Stewardship Replication By Sector And Data Community Elements PDF a try. Our experts have put a lot of knowledge and effort into creating this impeccable Data Governance IT Data Stewardship Replication By Sector And Data Community Elements PDF. You can use this template for your upcoming presentations, as the slides are perfect to represent even the tiniest detail. You can download these templates from the Slidegeeks website and these are easy to edit. So grab these today.
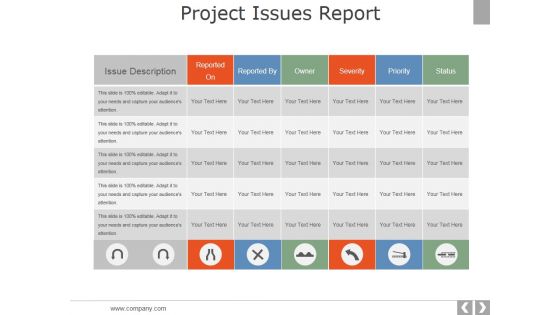
Project Issues Report Ppt PowerPoint Presentation Slide
This is a project issues report ppt powerpoint presentation slide. This is a six stage process. The stages in this process are issue description, reported on, reported by, owner, severity.
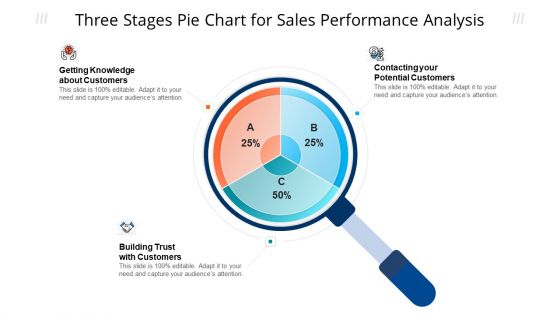
Three Stages Pie Chart For Sales Performance Analysis Ppt Model Tips PDF
Persuade your audience using this three stages pie chart for sales performance analysis ppt model tips pdf. This PPT design covers three stages, thus making it a great tool to use. It also caters to a variety of topics including potential customers, knowledge about customers, sales performance analysis. Download this PPT design now to present a convincing pitch that not only emphasizes the topic but also showcases your presentation skills.
Ingestion Icon For Stream Processing And Analysis Ppt PowerPoint Presentation Gallery Visual Aids PDF
Persuade your audience using this Ingestion Icon For Stream Processing And Analysis Ppt PowerPoint Presentation Gallery Visual Aids PDF. This PPT design covers three stages, thus making it a great tool to use. It also caters to a variety of topics including Ingestion Icon, Stream, Processing And Analysis. Download this PPT design now to present a convincing pitch that not only emphasizes the topic but also showcases your presentation skills.
Icon Of BI System To Enhance Processes For Statistical Analysis Ppt Ideas Elements PDF
Persuade your audience using this Icon Of BI System To Enhance Processes For Statistical Analysis Ppt Ideas Elements PDF. This PPT design covers four stages, thus making it a great tool to use. It also caters to a variety of topics including Icon, BI System, Enhance Processes, Statistical Analysis. Download this PPT design now to present a convincing pitch that not only emphasizes the topic but also showcases your presentation skills.
Website Analysis Icon For SEO Performance Improvement Ppt Gallery Professional PDF
Persuade your audience using this Website Analysis Icon For SEO Performance Improvement Ppt Gallery Professional PDF. This PPT design covers four stages, thus making it a great tool to use. It also caters to a variety of topics including Website Analysis, Icon, SEO Performance Improvement. Download this PPT design now to present a convincing pitch that not only emphasizes the topic but also showcases your presentation skills.

Toolkit For Data Science And Analytics Transition Data Analytics Project Plan Designs PDF
This slide shows the data analytics lifecycle covering multiple stages starting from presenting the business case to data identification, data validation, analysis and ending at data visualization and utilization of results. Present like a pro with Toolkit For Data Science And Analytics Transition Data Analytics Project Plan Designs PDF Create beautiful presentations together with your team, using our easy to use presentation slides. Share your ideas in real time and make changes on the fly by downloading our templates. So whether you are in the office, on the go, or in a remote location, you can stay in sync with your team and present your ideas with confidence. With Slidegeeks presentation got a whole lot easier. Grab these presentations today.
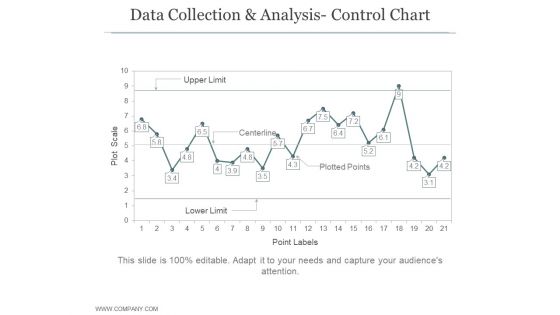
Data Collection And Analysis Control Chart Ppt PowerPoint Presentation Example File
This is a data collection and analysis control chart ppt powerpoint presentation example file. This is a four stage process. The stages in this process are business, strategy, marketing, bar graph, growth strategy.
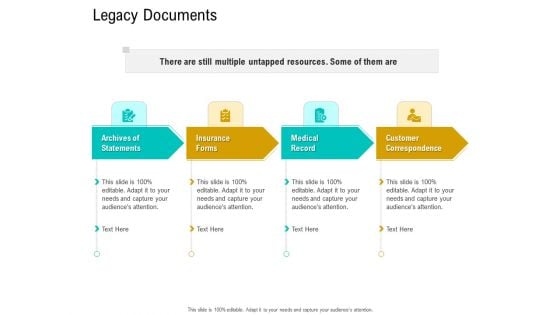
Business Data Analysis Legacy Documents Clipart PDF
Presenting business data analysis legacy documents clipart pdf to provide visual cues and insights. Share and navigate important information on four stages that need your due attention. This template can be used to pitch topics like archives of statements, insurance forms, medical record, customer correspondence, there are still multiple untapped resources. some of them are. In addtion, this PPT design contains high resolution images, graphics, etc, that are easily editable and available for immediate download.
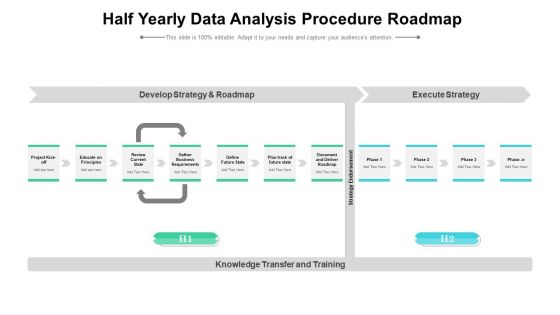
Half Yearly Data Analysis Procedure Roadmap Formats
Presenting our innovatively structured half yearly data analysis procedure roadmap formats Template. Showcase your roadmap process in different formats like PDF, PNG, and JPG by clicking the download button below. This PPT design is available in both Standard Screen and Widescreen aspect ratios. It can also be easily personalized and presented with modified font size, font type, color, and shapes to measure your progress in a clear way.
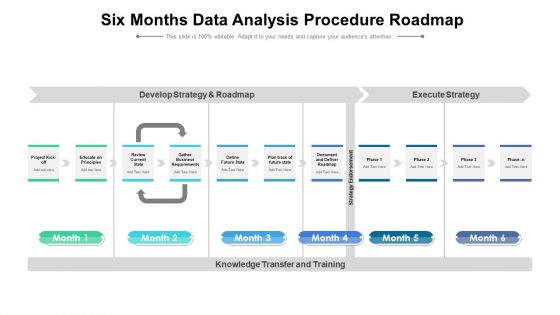
Six Months Data Analysis Procedure Roadmap Topics
Presenting our innovatively structured six months data analysis procedure roadmap topics Template. Showcase your roadmap process in different formats like PDF, PNG, and JPG by clicking the download button below. This PPT design is available in both Standard Screen and Widescreen aspect ratios. It can also be easily personalized and presented with modified font size, font type, color, and shapes to measure your progress in a clear way.
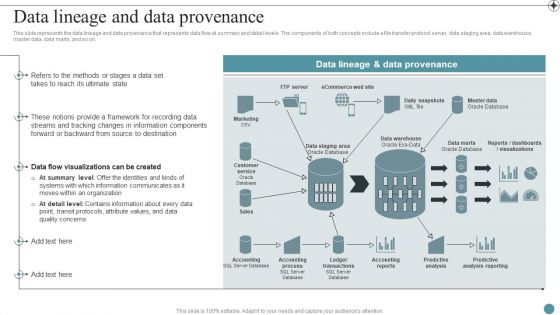
Data Lineage And Data Provenance Deploying Data Lineage IT Demonstration PDF
This slide represents the data lineage and data provenance that represents data flow at summary and detail levels. The components of both concepts include a file transfer protocol server, data staging area, data warehouse, master data, data marts, and so on.Do you have to make sure that everyone on your team knows about any specific topic I yes, then you should give Data Lineage And Data Provenance Deploying Data Lineage IT Demonstration PDF a try. Our experts have put a lot of knowledge and effort into creating this impeccable Data Lineage And Data Provenance Deploying Data Lineage IT Demonstration PDF. You can use this template for your upcoming presentations, as the slides are perfect to represent even the tiniest detail. You can download these templates from the Slidegeeks website and these are easy to edit. So grab these today.

Proposal For Data Analysis In Research Project Team Structure Of Data Analysis Company One Pager Sample Example Document
Presenting you an exemplary Proposal For Data Analysis In Research Project Team Structure Of Data Analysis Company One Pager Sample Example Document. Our one-pager comprises all the must-have essentials of an inclusive document. You can edit it with ease, as its layout is completely editable. With such freedom, you can tweak its design and other elements to your requirements. Download this Proposal For Data Analysis In Research Project Team Structure Of Data Analysis Company One Pager Sample Example Document brilliant piece now.
Data Interpretation And Analysis Playbook Icons Slide For Data Interpretation And Analysis Playbook Designs PDF
Presenting our innovatively structured data interpretation and analysis playbook icons slide for data interpretation and analysis playbook designs pdf set of slides. The slides contain a hundred percent editable icons. You can replace these icons without any inconvenience. Therefore, pick this set of slides and create a striking presentation.
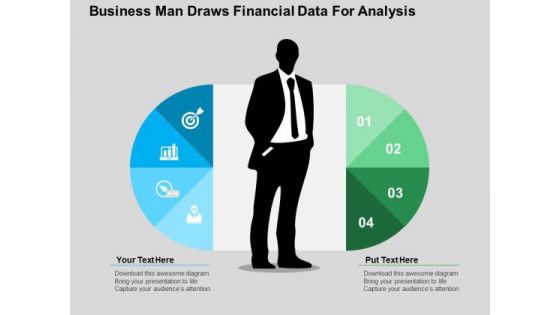
Business Man Draws Financial Data For Analysis PowerPoint Templates
This PowerPoint slide has a theme for financial data analysis. This image has been designed to display concept of financial planning and analysis. Deliver amazing presentations to mesmerize your audience using this image
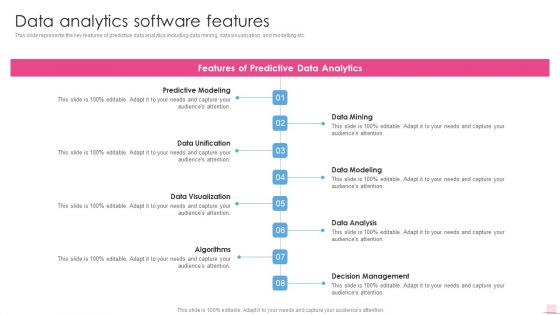
Data Analytics Software Features Business Analysis Modification Toolkit Formats PDF
This slide represents the key features of predictive data analytics including data mining, data visualization, and modelling etc.Presenting Data Analytics Software Features Business Analysis Modification Toolkit Formats PDF to provide visual cues and insights. Share and navigate important information on eight stages that need your due attention. This template can be used to pitch topics like Predictive Modeling, Data Unification, Data Visualization. In addtion, this PPT design contains high resolution images, graphics, etc, that are easily editable and available for immediate download.
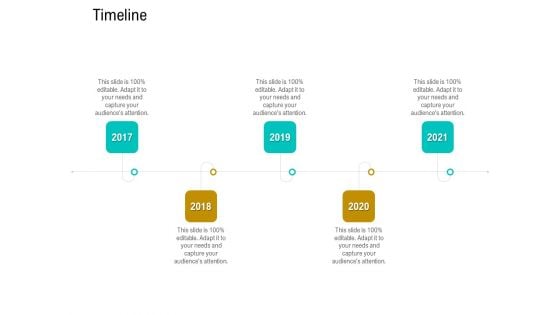
Business Data Analysis Timeline Portrait PDF
This is a business data analysis timeline portrait pdf template with various stages. Focus and dispense information on four stages using this creative set, that comes with editable features. It contains large content boxes to add your information on topics like timeline 2017 to 2021. You can also showcase facts, figures, and other relevant content using this PPT layout. Grab it now.
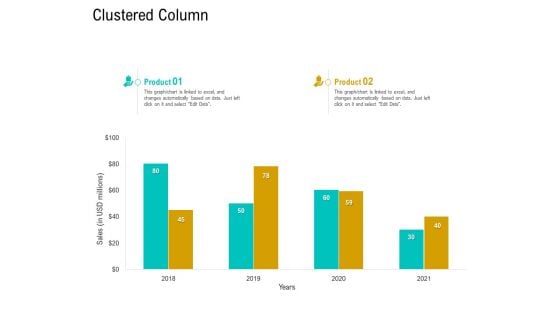
Business Data Analysis Clustered Column Template PDF
Deliver an awe inspiring pitch with this creative business data analysis clustered column template pdf bundle. Topics like clustered column can be discussed with this completely editable template. It is available for immediate download depending on the needs and requirements of the user.
Business Data Analysis Roadmap Graphics PDF
This is a business data analysis roadmap graphics pdf template with various stages. Focus and dispense information on four stages using this creative set, that comes with editable features. It contains large content boxes to add your information on topics like roadmap. You can also showcase facts, figures, and other relevant content using this PPT layout. Grab it now.
Campaign Report Ppt PowerPoint Presentation File Icon
This is a campaign report ppt powerpoint presentation file icon. This is a ten stage process. The stages in this process are email name, send date time, recipients, delivered, spam.
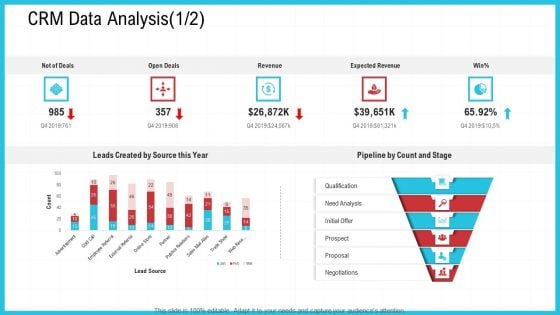
CRM Data Analysis Analysis Ppt Portfolio Inspiration PDF
Deliver and pitch your topic in the best possible manner with this crm data analysis analysis ppt portfolio inspiration pdf. Use them to share invaluable insights on revenue, source, analysis and impress your audience. This template can be altered and modified as per your expectations. So, grab it now.
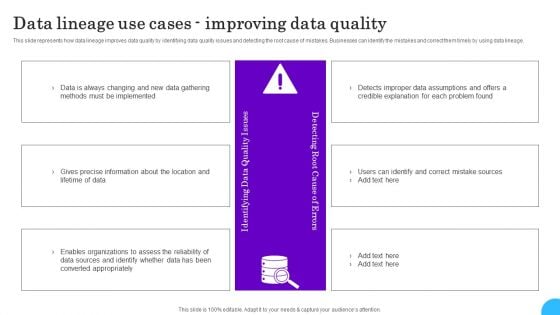
Comprehensive Analysis Of Different Data Lineage Classification Data Lineage Use Cases Improving Data Mockup PDF
This slide represents how data lineage improves data quality by identifying data quality issues and detecting the root cause of mistakes. Businesses can identify the mistakes and correct them timely by using data lineage. This Comprehensive Analysis Of Different Data Lineage Classification Data Lineage Use Cases Improving Data Mockup PDF is perfect for any presentation, be it in front of clients or colleagues. It is a versatile and stylish solution for organizing your meetings. The Comprehensive Analysis Of Different Data Lineage Classification Data Lineage Use Cases Improving Data Mockup PDF features a modern design for your presentation meetings. The adjustable and customizable slides provide unlimited possibilities for acing up your presentation. Slidegeeks has done all the homework before launching the product for you. So, do not wait, grab the presentation templates today
Business Tactical And Strategic Analysis For Profitability Growth Icon Pictures PDF
Presenting Business Tactical And Strategic Analysis For Profitability Growth Icon Pictures PDF to dispense important information. This template comprises three stages. It also presents valuable insights into the topics including Business Tactical, Analysis, Profitability Growth, Icon. This is a completely customizable PowerPoint theme that can be put to use immediately. So, download it and address the topic impactfully.
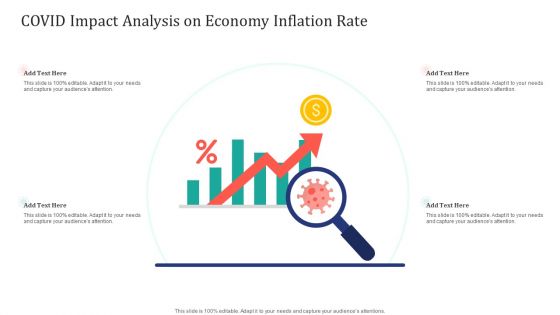
COVID Impact Analysis On Economy Inflation Rate Ppt Portfolio Slide PDF
Presenting COVID Impact Analysis On Economy Inflation Rate Ppt Portfolio Slide PDF to dispense important information. This template comprises one stages. It also presents valuable insights into the topics including COVID Impact Analysis, Economy Inflation Rate. This is a completely customizable PowerPoint theme that can be put to use immediately. So, download it and address the topic impactfully.
Magnifying Glass Ppt PowerPoint Presentation Model Designs Download
This is a magnifying glass ppt powerpoint presentation model designs download. This is a four stage process. The stages in this process are business, icons, magnifier glass, search, marketing.
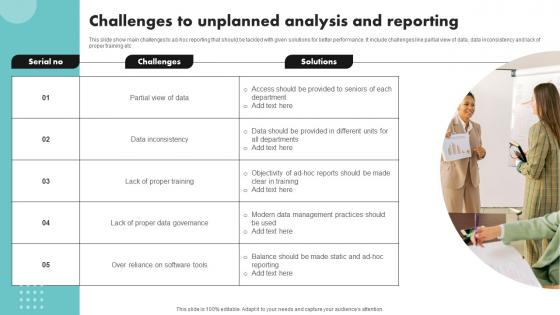
Challenges To Unplanned Analysis And Reporting Pictures Pdf
This slide show main challenges to ad-hoc reporting that should be tackled with given solutions for better performance. It include challenges like partial view of data, data inconsistency and lack of proper training etc Showcasing this set of slides titled Challenges To Unplanned Analysis And Reporting Pictures Pdf The topics addressed in these templates are Partial View Of Data, Data Inconsistency, Lack Of Proper Training All the content presented in this PPT design is completely editable. Download it and make adjustments in color, background, font etc. as per your unique business setting. This slide show main challenges to ad-hoc reporting that should be tackled with given solutions for better performance. It include challenges like partial view of data, data inconsistency and lack of proper training etc
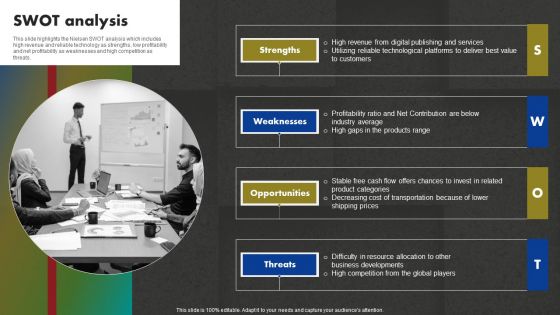
Data And Customer Analysis Company Outline SWOT Analysis Mockup PDF
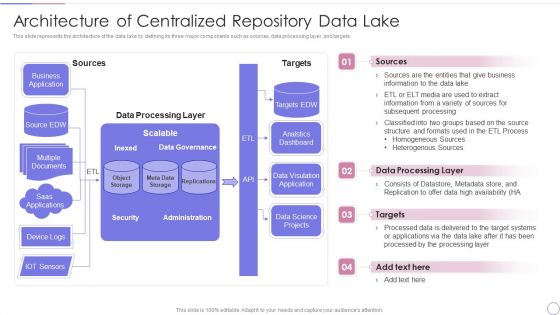
Data Lake Architecture Future Of Data Analysis Architecture Of Centralized Repository Data Lake Demonstration PDF
This slide represents the architecture of the data lake by defining its three major components such as sources, data processing layer, and targets.Deliver and pitch your topic in the best possible manner with this Data Lake Architecture Future Of Data Analysis Architecture Of Centralized Repository Data Lake Demonstration PDF. Use them to share invaluable insights on Administration, Data Processing, Processed Processing and impress your audience. This template can be altered and modified as per your expectations. So, grab it now.
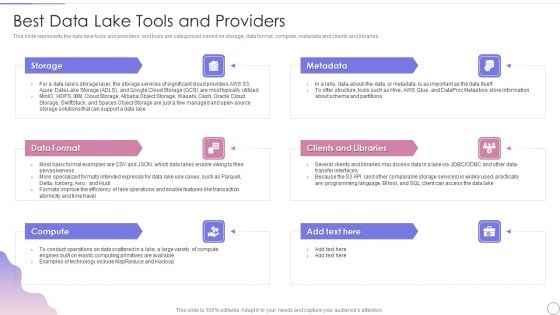
Data Lake Architecture Future Of Data Analysis Best Data Lake Tools And Providers Clipart PDF
This slide represents the data lake tools and providers, and tools are categorized based on storage, data format, compute, metadata and clients and libraries.Deliver an awe inspiring pitch with this creative Data Lake Architecture Future Of Data Analysis Best Data Lake Tools And Providers Clipart PDF bundle. Topics like Clients And Libraries, Data Format, Compute can be discussed with this completely editable template. It is available for immediate download depending on the needs and requirements of the user.
Project Conclusion Report Budget Costs Ppt PowerPoint Presentation Icon Graphics
This is a project conclusion report budget costs ppt powerpoint presentation icon graphics. This is a four stage process. The stages in this process are type of cost, planned costs, actual costs, equipment.
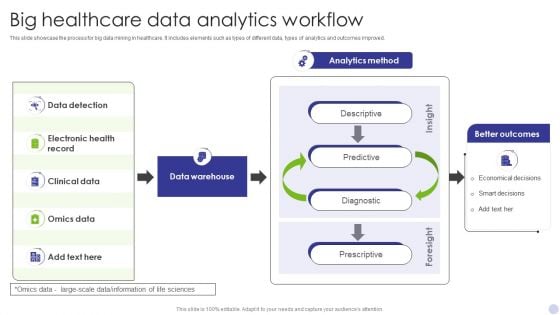
Big Healthcare Data Analytics Workflow Infographics PDF
This slide showcase the process for big data mining in healthcare. It includes elements such as types of different data, types of analytics and outcomes improved. Showcasing this set of slides titled Big Healthcare Data Analytics Workflow Infographics PDF. The topics addressed in these templates are Data Detection, Electronic Health Record, Clinical Data. All the content presented in this PPT design is completely editable. Download it and make adjustments in color, background, font etc. as per your unique business setting.
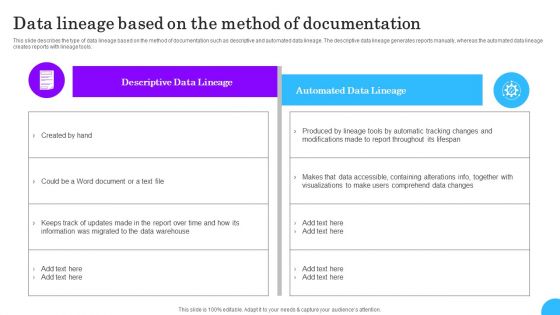
Comprehensive Analysis Of Different Data Lineage Classification Data Lineage Based On The Method Microsoft PDF
This slide describes the type of data lineage based on the method of documentation such as descriptive and automated data lineage. The descriptive data lineage generates reports manually, whereas the automated data lineage creates reports with lineage tools. If your project calls for a presentation, then Slidegeeks is your go to partner because we have professionally designed, easy to edit templates that are perfect for any presentation. After downloading, you can easily edit Comprehensive Analysis Of Different Data Lineage Classification Data Lineage Based On The Method Microsoft PDF and make the changes accordingly. You can rearrange slides or fill them with different images. Check out all the handy templates
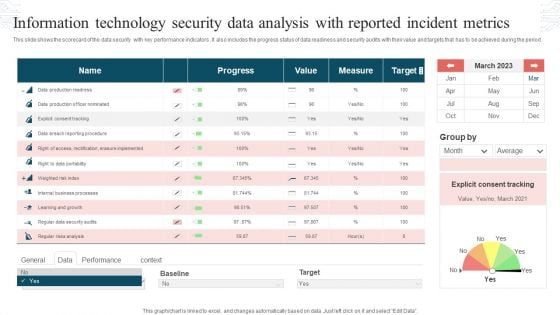
Information Technology Security Data Analysis With Reported Incident Metrics Rules PDF
This slide shows the scorecard of the data security with key performance indicators. It also includes the progress status of data readiness and security audits with their value and targets that has to be achieved during the period. Pitch your topic with ease and precision using this Information Technology Security Data Analysis With Reported Incident Metrics Rules PDF. This layout presents information on Progress, Value, Measure, Target. It is also available for immediate download and adjustment. So, changes can be made in the color, design, graphics or any other component to create a unique layout.
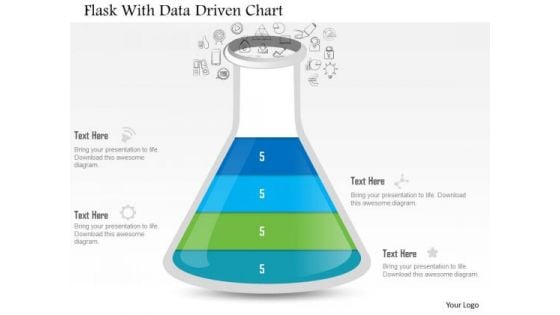
Business Diagram Flask With Data Driven Chart PowerPoint Slide
This data driven diagram has been designed with flask graphics. Download this diagram to give your presentations more effective look. It helps in clearly conveying your message to clients and audience.
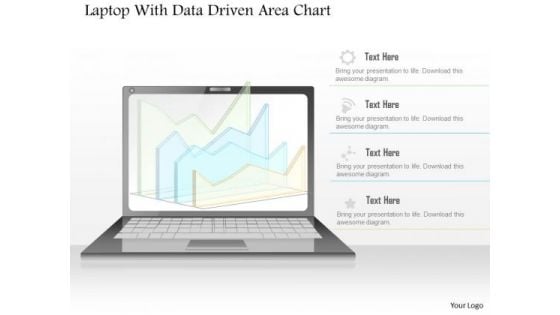
Business Diagram Laptop With Data Driven Area Chart PowerPoint Slide
This diagram has been designed with laptop and data driven area chart. Download this diagram to give your presentations more effective look. It helps in clearly conveying your message to clients and audience.
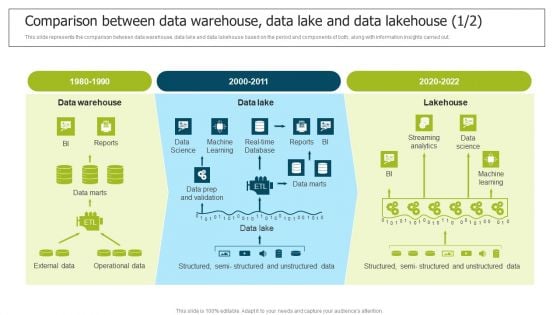
Data Lake Implementation Comparison Between Data Warehouse Data Lake And Data Infographics PDF
This slide represents the comparison between data warehouse, data lake and data lakehouse based on the period and components of both, along with information insights carried out. From laying roadmaps to briefing everything in detail, our templates are perfect for you. You can set the stage with your presentation slides. All you have to do is download these easy-to-edit and customizable templates. Data Lake Implementation Comparison Between Data Warehouse Data Lake And Data Infographics PDF will help you deliver an outstanding performance that everyone would remember and praise you for. Do download this presentation today.
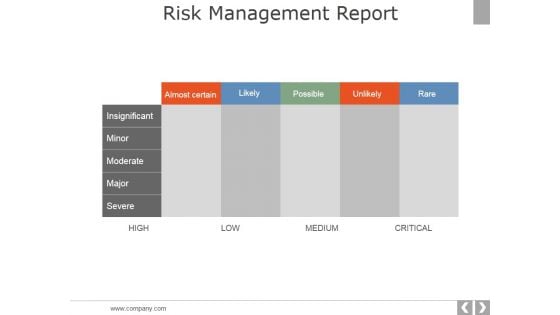
Risk Management Report Template 2 Ppt PowerPoint Presentation Infographics Brochure
This is a risk management report template 2 ppt powerpoint presentation infographics brochure. This is a five stage process. The stages in this process are insignificant, minor, moderate, major, severe.
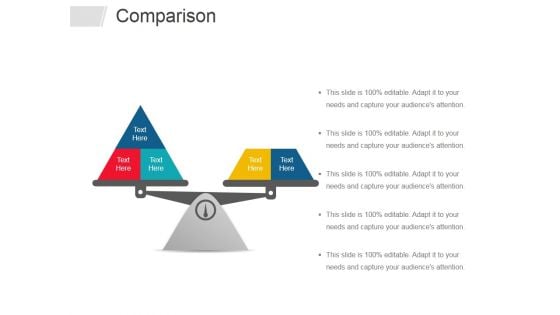
Comparison Ppt PowerPoint Presentation Infographic Template Graphics Tutorials
This is a comparison ppt powerpoint presentation infographic template graphics tutorials. This is a two stage process. The stages in this process are comparison, planning, business, management, marketing.

Magnifying Glass Ppt PowerPoint Presentation Outline Design Templates
This is a magnifying glass ppt powerpoint presentation outline design templates. This is a four stage process. The stages in this process are business, management, analysis, strategy, marketing.
Small Data Vs Big Data Ppt PowerPoint Presentation Icon Model
This is a small data vs big data ppt powerpoint presentation icon model. This is a two stage process. The stages in this process are small data, big data.
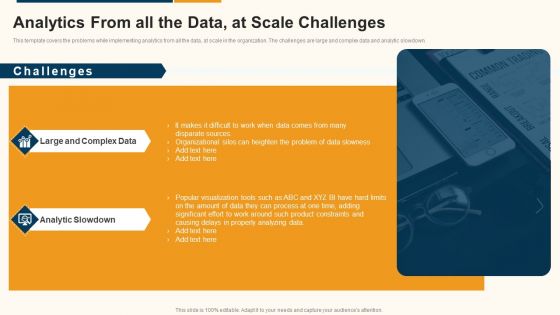
Data Interpretation And Analysis Playbook Analytics From All The Data At Scale Challenges Structure PDF
This template covers the problems while implementing analytics from all the data, at scale in the organization. The challenges are large and complex data and analytic slowdown. This is a data interpretation and analysis playbook analytics from all the data at scale challenges structure pdf template with various stages. Focus and dispense information on two stages using this creative set, that comes with editable features. It contains large content boxes to add your information on topics like large and complex data, analytic slowdown. You can also showcase facts, figures, and other relevant content using this PPT layout. Grab it now.
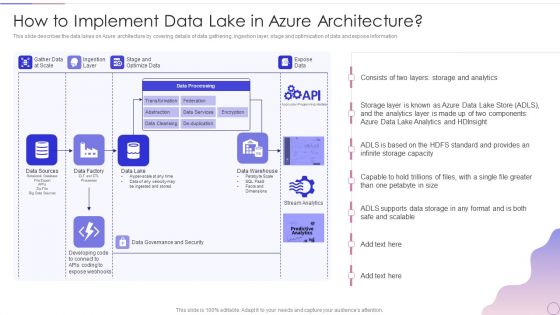
Data Lake Architecture Future Of Data Analysis How To Implement Data Lake In Azure Architecture Slides PDF
This slide describes the data lakes on Azure architecture by covering details of data gathering, ingestion layer, stage and optimization of data and expose information.Deliver an awe inspiring pitch with this creative Data Lake Architecture Future Of Data Analysis How To Implement Data Lake In Azure Architecture Slides PDF bundle. Topics like Data Processing, Storage And Analytics, Governance And Security can be discussed with this completely editable template. It is available for immediate download depending on the needs and requirements of the user.
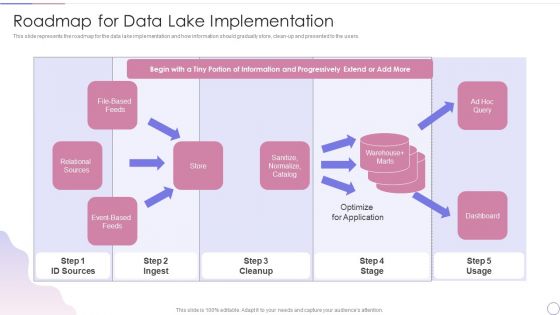
Data Lake Architecture Future Of Data Analysis Roadmap For Data Lake Implementation Slides PDF
Deliver an awe inspiring pitch with this creative Data Lake Architecture Future Of Data Analysis Roadmap For Data Lake Implementation Slides PDF bundle. Topics like Relational Sources, Optimize Application, Information Progressively can be discussed with this completely editable template. It is available for immediate download depending on the needs and requirements of the user.
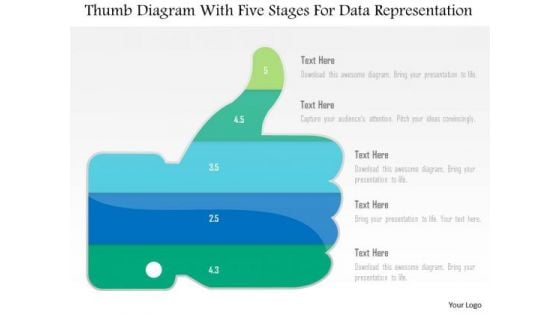
Business Diagram Thumb Diagram With Five Stages For Data Representation PowerPoint Slide
This business diagram displays thumb up with five stages. This diagram contains text boxes for data representation. Use this diagram to display business process workflows in any presentations.
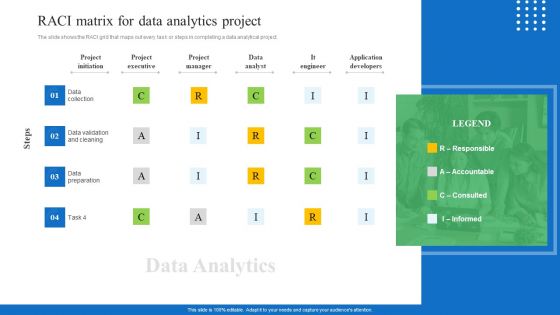
Toolkit For Data Science And Analytics Transition RACI Matrix For Data Analytics Project Designs PDF
The slide shows the RACI grid that maps out every task or steps in completing a data analytical project. Do you have an important presentation coming up Are you looking for something that will make your presentation stand out from the rest Look no further than Toolkit For Data Science And Analytics Transition RACI Matrix For Data Analytics Project Designs PDF. With our professional designs, you can trust that your presentation will pop and make delivering it a smooth process. And with Slidegeeks, you can trust that your presentation will be unique and memorable. So why wait Grab Toolkit For Data Science And Analytics Transition RACI Matrix For Data Analytics Project Designs PDF today and make your presentation stand out from the rest.


 Continue with Email

 Home
Home


