Executive Kpi
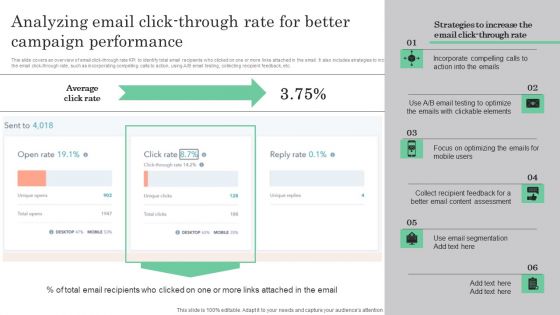
Online Marketing Analytics To Enhance Business Growth Analyzing Email Click Through Rate For Better Portrait PDF
This slide covers an overview of email click through rate KPI to identify total email recipients who clicked on one or more links attached in the email. It also includes strategies to increase the email click through rate, such as incorporating compelling calls to action, using A B email testing, collecting recipient feedback, etc. Want to ace your presentation in front of a live audience Our Online Marketing Analytics To Enhance Business Growth Analyzing Email Click Through Rate For Better Portrait PDF can help you do that by engaging all the users towards you. Slidegeeks experts have put their efforts and expertise into creating these impeccable powerpoint presentations so that you can communicate your ideas clearly. Moreover, all the templates are customizable, and easy to edit and downloadable. Use these for both personal and commercial use.
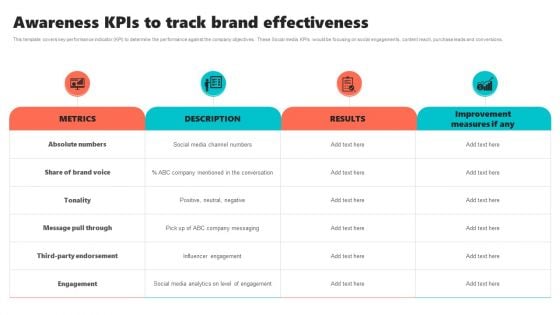
New Brand Introduction Plan Awareness Kpis To Track Brand Effectiveness Clipart PDF
This template covers key performance indicator KPI to determine the performance against the company objectives. These Social media KPIs would be focusing on social engagements, content reach, purchase leads and conversions. This modern and well-arranged New Brand Introduction Plan Awareness Kpis To Track Brand Effectiveness Clipart PDF provides lots of creative possibilities. It is very simple to customize and edit with the Powerpoint Software. Just drag and drop your pictures into the shapes. All facets of this template can be edited with Powerpoint no extra software is necessary. Add your own material, put your images in the places assigned for them, adjust the colors, and then you can show your slides to the world, with an animated slide included.
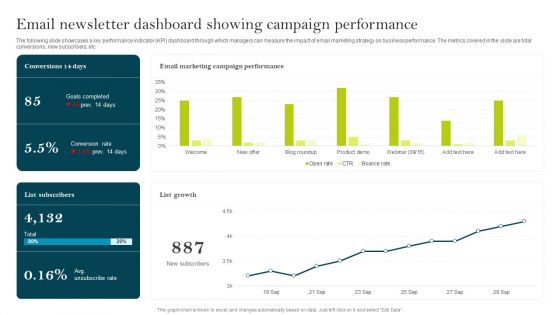
Email Newsletter Dashboard Showing Campaign Performance Ppt PowerPoint Presentation File Infographic Template PDF
The following slide showcases a key performance indicator KPI dashboard through which managers can measure the impact of email marketing strategy on business performance. The metrics covered in the slide are total conversions, new subscribers, etc. Coming up with a presentation necessitates that the majority of the effort goes into the content and the message you intend to convey. The visuals of a PowerPoint presentation can only be effective if it supplements and supports the story that is being told. Keeping this in mind our experts created Email Newsletter Dashboard Showing Campaign Performance Ppt PowerPoint Presentation File Infographic Template PDF to reduce the time that goes into designing the presentation. This way, you can concentrate on the message while our designers take care of providing you with the right template for the situation.
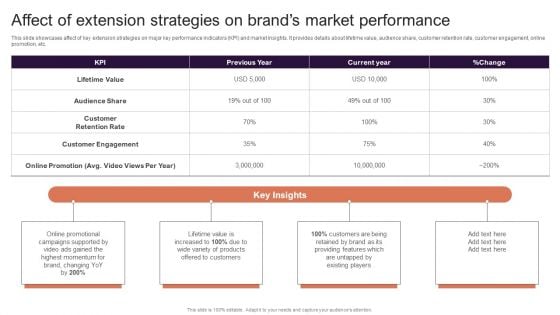
Implementing Brand Extension Initiatives For Apple Company Affect Of Extension Strategies On Brands Market Sample PDF
This slide showcases affect of key extension strategies on major key performance indicators KPI and market insights. It provides details about lifetime value, audience share, customer retention rate, customer engagement, online promotion, etc. Create an editable Implementing Brand Extension Initiatives For Apple Company Affect Of Extension Strategies On Brands Market Sample PDF that communicates your idea and engages your audience. Whether youre presenting a business or an educational presentation, pre designed presentation templates help save time. Implementing Brand Extension Initiatives For Apple Company Affect Of Extension Strategies On Brands Market Sample PDF is highly customizable and very easy to edit, covering many different styles from creative to business presentations. Slidegeeks has creative team members who have crafted amazing templates. So, go and get them without any delay.
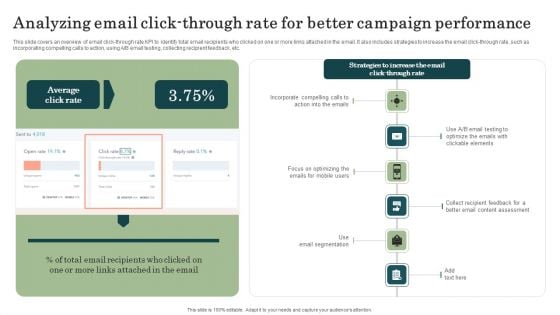
Marketing Success Metrics Analyzing Email Click Through Rate For Better Campaign Mockup PDF
This slide covers an overview of email click-through rate KPI to identify total email recipients who clicked on one or more links attached in the email. It also includes strategies to increase the email click-through rate, such as incorporating compelling calls to action, using A or B email testing, collecting recipient feedback, etc. Welcome to our selection of the Marketing Success Metrics Analyzing Email Click Through Rate For Better Campaign Mockup PDF. These are designed to help you showcase your creativity and bring your sphere to life. Planning and Innovation are essential for any business that is just starting out. This collection contains the designs that you need for your everyday presentations. All of our PowerPoints are 100 percent editable, so you can customize them to suit your needs. This multi-purpose template can be used in various situations. Grab these presentation templates today.

ATS Administration To Improve Asset Management Dashboard To Track System Guidelines PDF
This slide covers KPI dashboard to track system performance. It involves detail such as total number of assets, value of assets and purchases in fiscal year. Get a simple yet stunning designed ATS Administration To Improve Asset Management Dashboard To Track System Guidelines PDF. It is the best one to establish the tone in your meetings. It is an excellent way to make your presentations highly effective. So, download this PPT today from Slidegeeks and see the positive impacts. Our easy-to-edit ATS Administration To Improve Asset Management Dashboard To Track System Guidelines PDF can be your go-to option for all upcoming conferences and meetings. So, what are you waiting for Grab this template today.
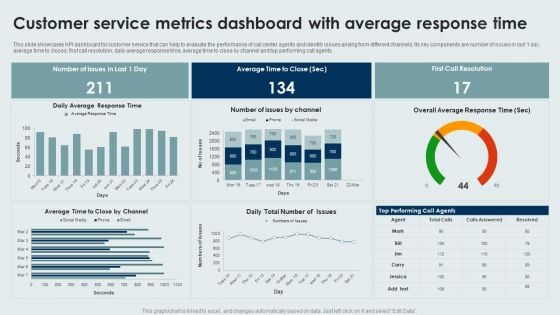
Customer Service Metrics Dashboard With Average Response Time Formats PDF
This slide showcases KPI dashboard for customer service that can help to evaluate the performance of call center agents and identify issues arising from different channels. Its key components are number of issues in last 1 day, average time to closes, first call resolution, daily average response time, average time to close by channel and top performing call agents. Pitch your topic with ease and precision using this Customer Service Metrics Dashboard With Average Response Time Formats PDF. This layout presents information on Customer Service, Metrics Dashboard, Average Response Time. It is also available for immediate download and adjustment. So, changes can be made in the color, design, graphics or any other component to create a unique layout.
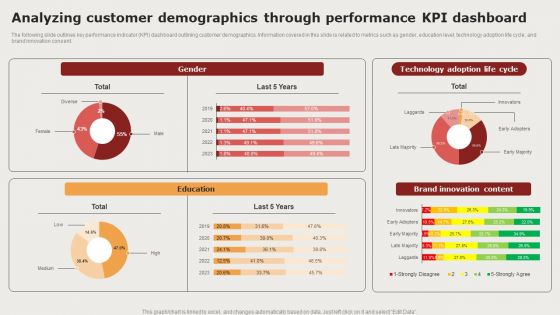
Creating Positioning Techniques For Market Research Analyzing Customer Demographics Through Performance Background PDF
The following slide outlines key performance indicator KPI dashboard outlining customer demographics. Information covered in this slide is related to metrics such as gender, education level, technology adoption life cycle, and brand innovation consent. If you are looking for a format to display your unique thoughts, then the professionally designed Creating Positioning Techniques For Market Research Analyzing Customer Demographics Through Performance Background PDF is the one for you. You can use it as a Google Slides template or a PowerPoint template. Incorporate impressive visuals, symbols, images, and other charts. Modify or reorganize the text boxes as you desire. Experiment with shade schemes and font pairings. Alter, share or cooperate with other people on your work. Download Creating Positioning Techniques For Market Research Analyzing Customer Demographics Through Performance Background PDF and find out how to give a successful presentation. Present a perfect display to your team and make your presentation unforgettable.
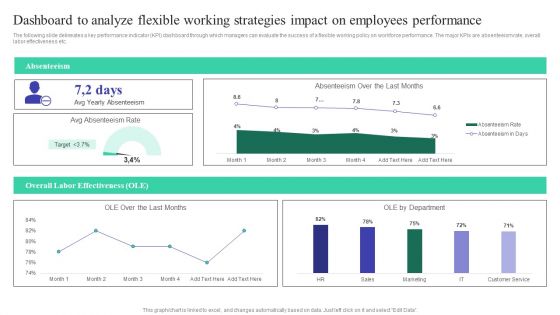
Dashboard To Analyze Flexible Working Strategies Impact On Employees Performance Professional PDF
The following slide delineates a key performance indicator KPI dashboard through which managers can evaluate the success of a flexible working policy on workforce performance. The major KPIs are absenteeism rate, overall labor effectiveness etc. If you are looking for a format to display your unique thoughts, then the professionally designed Dashboard To Analyze Flexible Working Strategies Impact On Employees Performance Professional PDF is the one for you. You can use it as a Google Slides template or a PowerPoint template. Incorporate impressive visuals, symbols, images, and other charts. Modify or reorganize the text boxes as you desire. Experiment with shade schemes and font pairings. Alter, share or cooperate with other people on your work. Download Dashboard To Analyze Flexible Working Strategies Impact On Employees Performance Professional PDF and find out how to give a successful presentation. Present a perfect display to your team and make your presentation unforgettable.
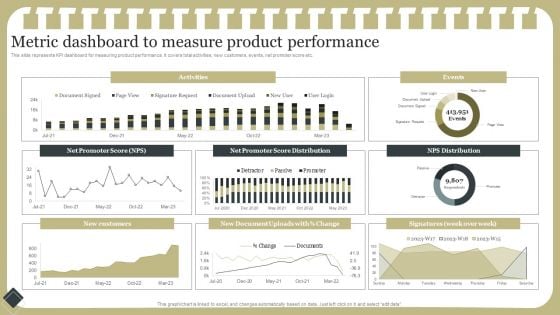
Effective Product Development Strategy Metric Dashboard To Measure Product Performance Information PDF
This slide represents KPI dashboard for measuring product performance. It covers total activities, new customers, events, net promoter score etc.Coming up with a presentation necessitates that the majority of the effort goes into the content and the message you intend to convey. The visuals of a PowerPoint presentation can only be effective if it supplements and supports the story that is being told. Keeping this in mind our experts created Effective Product Development Strategy Metric Dashboard To Measure Product Performance Information PDF to reduce the time that goes into designing the presentation. This way, you can concentrate on the message while our designers take care of providing you with the right template for the situation.
Marketing Success Metrics Analyzing Blog Views Visits To Increase Organic Traffic Icons PDF
This slide covers blog view KPI to identify how many unique visitors have viewed your blogs. It also includes strategies to improve blog page views, create viral content, use FAB strategy to create content, and create evergreen list posts. Coming up with a presentation necessitates that the majority of the effort goes into the content and the message you intend to convey. The visuals of a PowerPoint presentation can only be effective if it supplements and supports the story that is being told. Keeping this in mind our experts created Marketing Success Metrics Analyzing Blog Views Visits To Increase Organic Traffic Icons PDF to reduce the time that goes into designing the presentation. This way, you can concentrate on the message while our designers take care of providing you with the right template for the situation.
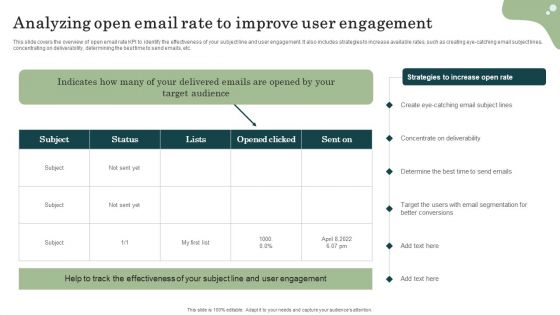
Marketing Success Metrics Analyzing Open Email Rate To Improve User Engagement Demonstration PDF
This slide covers the overview of open email rate KPI to identify the effectiveness of your subject line and user engagement. It also includes strategies to increase available rates, such as creating eye-catching email subject lines, concentrating on deliverability, determining the best time to send emails, etc. Are you searching for a Marketing Success Metrics Analyzing Open Email Rate To Improve User Engagement Demonstration PDF that is uncluttered, straightforward, and original Its easy to edit, and you can change the colors to suit your personal or business branding. For a presentation that expresses how much effort youve put in, this template is ideal With all of its features, including tables, diagrams, statistics, and lists, its perfect for a business plan presentation. Make your ideas more appealing with these professional slides. Download Marketing Success Metrics Analyzing Open Email Rate To Improve User Engagement Demonstration PDF from Slidegeeks today.

Strategy To Enhance Supply Chain Operations Dashboard To Analyze Impact Of Warehouse Management Topics PDF
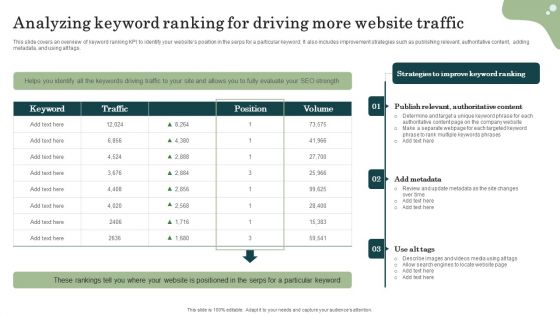
Marketing Success Metrics Analyzing Keyword Ranking For Driving More Website Traffic Sample PDF
This slide covers an overview of keyword ranking KPI to identify your websites position in the serps for a particular keyword. It also includes improvement strategies such as publishing relevant, authoritative content, adding metadata, and using alt tags. Explore a selection of the finest Marketing Success Metrics Analyzing Keyword Ranking For Driving More Website Traffic Sample PDF here. With a plethora of professionally designed and pre-made slide templates, you can quickly and easily find the right one for your upcoming presentation. You can use our Marketing Success Metrics Analyzing Keyword Ranking For Driving More Website Traffic Sample PDF to effectively convey your message to a wider audience. Slidegeeks has done a lot of research before preparing these presentation templates. The content can be personalized and the slides are highly editable. Grab templates today from Slidegeeks.
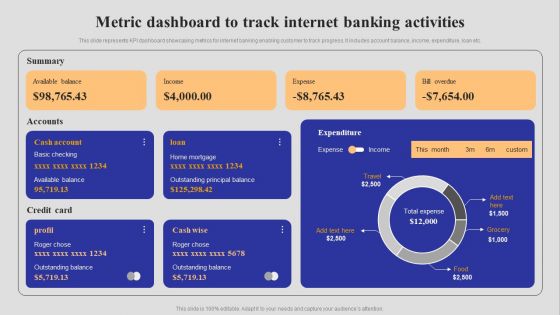
Introduction To Digital Banking Services Metric Dashboard To Track Internet Banking Activities Download PDF
This slide represents KPI dashboard showcasing metrics for internet banking enabling customer to track progress. It includes account balance, income, expenditure, loan etc. Slidegeeks is here to make your presentations a breeze with Introduction To Digital Banking Services Metric Dashboard To Track Internet Banking Activities Download PDF With our easy to use and customizable templates, you can focus on delivering your ideas rather than worrying about formatting. With a variety of designs to choose from, you are sure to find one that suits your needs. And with animations and unique photos, illustrations, and fonts, you can make your presentation pop. So whether you are giving a sales pitch or presenting to the board, make sure to check out Slidegeeks first.
Data Driven Marketing Campaigns Key Metrics Dashboard Ppt Icon Graphics Pictures PDF
This slide represents the KPI dashboard to track and monitor performance of data driven marketing campaigns launched by the marketing team. It includes details related to conversions by google ads, Facebook and Instagram etc. Explore a selection of the finest Data Driven Marketing Campaigns Key Metrics Dashboard Ppt Icon Graphics Pictures PDF here. With a plethora of professionally designed and pre made slide templates, you can quickly and easily find the right one for your upcoming presentation. You can use our Data Driven Marketing Campaigns Key Metrics Dashboard Ppt Icon Graphics Pictures PDF to effectively convey your message to a wider audience. Slidegeeks has done a lot of research before preparing these presentation templates. The content can be personalized and the slides are highly editable. Grab templates today from Slidegeeks.
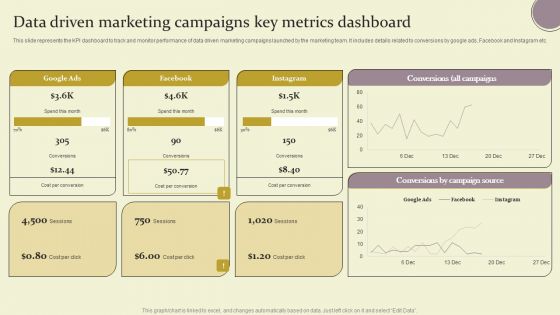
Data Driven Marketing Campaigns Key Metrics Dashboard Ppt Outline Example Introduction PDF
This slide represents the KPI dashboard to track and monitor performance of data driven marketing campaigns launched by the marketing team. It includes details related to conversions by google ads, Facebook and Instagram etc. Explore a selection of the finest Data Driven Marketing Campaigns Key Metrics Dashboard Ppt Outline Example Introduction PDF here. With a plethora of professionally designed and pre made slide templates, you can quickly and easily find the right one for your upcoming presentation. You can use our Data Driven Marketing Campaigns Key Metrics Dashboard Ppt Outline Example Introduction PDF to effectively convey your message to a wider audience. Slidegeeks has done a lot of research before preparing these presentation templates. The content can be personalized and the slides are highly editable. Grab templates today from Slidegeeks.
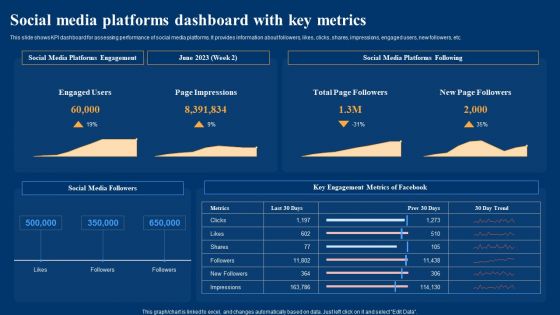
Optimizing Social Networks Social Media Platforms Dashboard With Key Metrics Structure PDF
This slide shows KPI dashboard for assessing performance of social media platforms. It provides information about followers, likes, clicks, shares, impressions, engaged users, new followers, etc. Retrieve professionally designed Optimizing Social Networks Social Media Platforms Dashboard With Key Metrics Structure PDF to effectively convey your message and captivate your listeners. Save time by selecting pre-made slideshows that are appropriate for various topics, from business to educational purposes. These themes come in many different styles, from creative to corporate, and all of them are easily adjustable and can be edited quickly. Access them as PowerPoint templates or as Google Slides themes. You dont have to go on a hunt for the perfect presentation because Slidegeeks got you covered from everywhere.
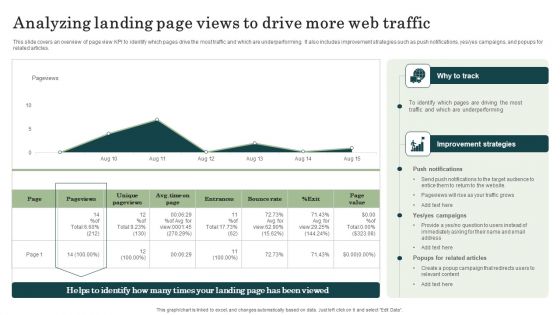
Marketing Success Metrics Analyzing Landing Page Views To Drive More Web Traffic Slides PDF
This slide covers an overview of page view kpi to identify which pages drive the most traffic and which are underperforming. it also includes improvement strategies such as push notifications, yes or yes campaigns, and popups for related articles. The Marketing Success Metrics Analyzing Landing Page Views To Drive More Web Traffic Slides PDF is a compilation of the most recent design trends as a series of slides. It is suitable for any subject or industry presentation, containing attractive visuals and photo spots for businesses to clearly express their messages. This template contains a variety of slides for the user to input data, such as structures to contrast two elements, bullet points, and slides for written information. Slidegeeks is prepared to create an impression.

Real Time Content Marketing Result Dashboard Ppt Infographic Template Example PDF
The following slide depicts real time content marketing KPI dashboard to monitor traffic flow and manage promotional efforts. It includes elements such as visitors by channel, conversion rate, search, direct, sessions, average time engaged etc. The Real Time Content Marketing Result Dashboard Ppt Infographic Template Example PDF is a compilation of the most recent design trends as a series of slides. It is suitable for any subject or industry presentation, containing attractive visuals and photo spots for businesses to clearly express their messages. This template contains a variety of slides for the user to input data, such as structures to contrast two elements, bullet points, and slides for written information. Slidegeeks is prepared to create an impression.
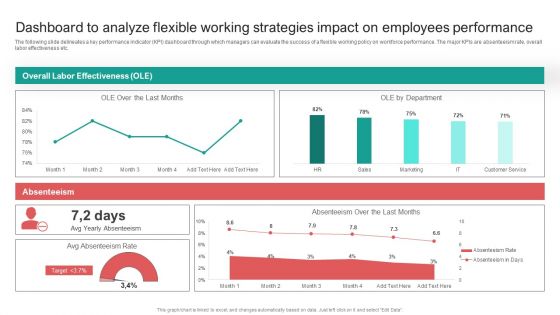
Dashboard To Analyze Flexible Working Strategies Impact On Employees Performance Infographics PDF
The following slide delineates a key performance indicator KPI dashboard through which managers can evaluate the success of a flexible working policy on workforce performance. The major KPIs are absenteeism rate, overall labor effectiveness etc. Presenting this PowerPoint presentation, titled Dashboard To Analyze Flexible Working Strategies Impact On Employees Performance Infographics PDF, with topics curated by our researchers after extensive research. This editable presentation is available for immediate download and provides attractive features when used. Download now and captivate your audience. Presenting this Dashboard To Analyze Flexible Working Strategies Impact On Employees Performance Infographics PDF. Our researchers have carefully researched and created these slides with all aspects taken into consideration. This is a completely customizable Dashboard To Analyze Flexible Working Strategies Impact On Employees Performance Infographics PDF that is available for immediate downloading. Download now and make an impact on your audience. Highlight the attractive features available with our PPTs.
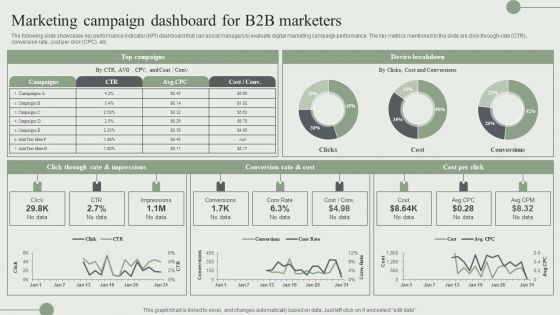
Marketing Campaign Dashboard For B2B Marketers Ppt PowerPoint Presentation File Diagrams PDF
The following slide showcases key performance indicator KPI dashboard that can assist managers to evaluate digital marketing campaign performance. The key metrics mentioned in the slide are click-through-rate CTR, conversion rate, cost per click CPC, etc. Present like a pro with Marketing Campaign Dashboard For B2B Marketers Ppt PowerPoint Presentation File Diagrams PDF Create beautiful presentations together with your team, using our easy to use presentation slides. Share your ideas in real time and make changes on the fly by downloading our templates. So whether you are in the office, on the go, or in a remote location, you can stay in sync with your team and present your ideas with confidence. With Slidegeeks presentation got a whole lot easier. Grab these presentations today.
Enhanced Lead Performance Tracking Dashboard Improving Lead Generation Process Professional PDF
This slide covers the KPI dashboard for tracking improved lead management system performance. It includes metrics such as visitors, social media followers, email subscribers, organic leads, etc. Explore a selection of the finest Enhanced Lead Performance Tracking Dashboard Improving Lead Generation Process Professional PDF here. With a plethora of professionally designed and pre made slide templates, you can quickly and easily find the right one for your upcoming presentation. You can use our Enhanced Lead Performance Tracking Dashboard Improving Lead Generation Process Professional PDF to effectively convey your message to a wider audience. Slidegeeks has done a lot of research before preparing these presentation templates. The content can be personalized and the slides are highly editable. Grab templates today from Slidegeeks.
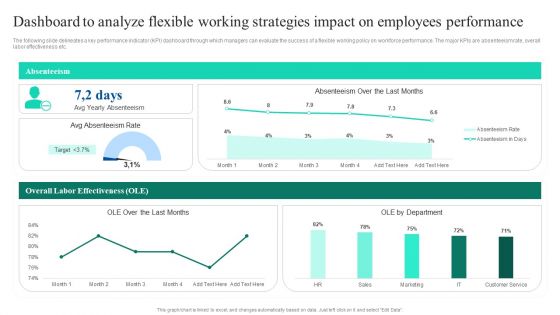
Adopting Flexible Work Policy Dashboard To Analyze Flexible Working Strategies Impact Template PDF
The following slide delineates a key performance indicator KPI dashboard through which managers can evaluate the success of a flexible working policy on workforce performance. The major KPIs are absenteeism rate, overall labor effectiveness etc. Do you have to make sure that everyone on your team knows about any specific topic I yes, then you should give Adopting Flexible Work Policy Dashboard To Analyze Flexible Working Strategies Impact Template PDF a try. Our experts have put a lot of knowledge and effort into creating this impeccable Adopting Flexible Work Policy Dashboard To Analyze Flexible Working Strategies Impact Template PDF. You can use this template for your upcoming presentations, as the slides are perfect to represent even the tiniest detail. You can download these templates from the Slidegeeks website and these are easy to edit. So grab these today.
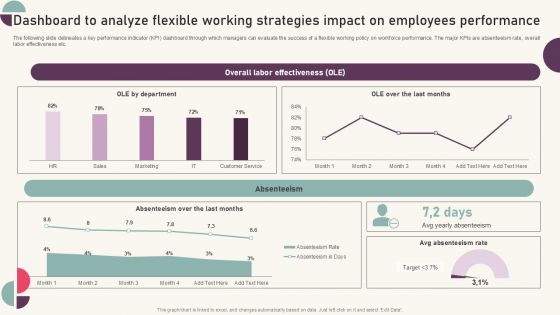
Tactics For Establishing Sustainable Hybrid Work Environment Dashboard To Analyze Flexible Working Strategies Topics PDF
Consumer Lead Generation Process Enhanced Lead Performance Tracking Dashboard Portrait PDF
This slide covers the KPI dashboard for tracking improved lead management system performance. It includes metrics such as visitors, social media followers, email subscribers, organic leads, etc. Slidegeeks is here to make your presentations a breeze with Consumer Lead Generation Process Enhanced Lead Performance Tracking Dashboard Portrait PDF With our easy-to-use and customizable templates, you can focus on delivering your ideas rather than worrying about formatting. With a variety of designs to choose from, youre sure to find one that suits your needs. And with animations and unique photos, illustrations, and fonts, you can make your presentation pop. So whether youre giving a sales pitch or presenting to the board, make sure to check out Slidegeeks first.
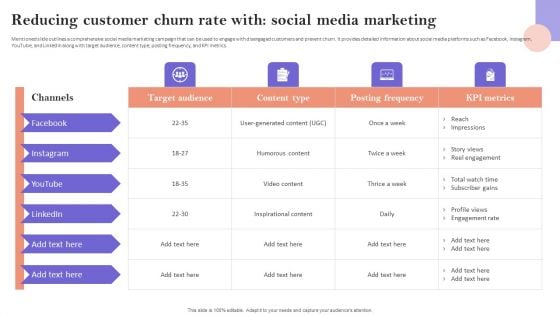
Reducing Customer Churn Rate With Social Media Marketing Structure PDF
Mentioned slide outlines a comprehensive social media marketing campaign that can be used to engage with disengaged customers and prevent churn. It provides detailed information about social media platforms such as Facebook, Instagram, YouTube, and LinkedIn along with target audience, content type, posting frequency, and KPI metrics. Do you know about Slidesgeeks Reducing Customer Churn Rate With Social Media Marketing Structure PDF. These are perfect for delivering any kind od presentation. Using it, create PowerPoint presentations that communicate your ideas and engage audiences. Save time and effort by using our pre designed presentation templates that are perfect for a wide range of topic. Our vast selection of designs covers a range of styles, from creative to business, and are all highly customizable and easy to edit. Download as a PowerPoint template or use them as Google Slides themes.
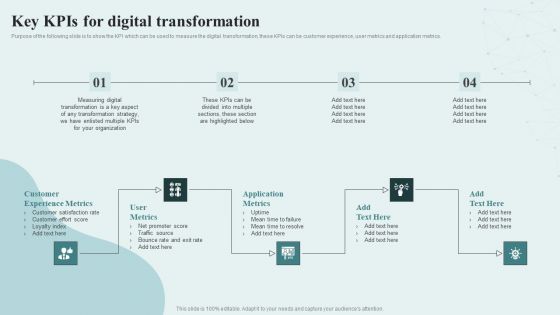
Digital Competency Evaluation And Modification Key Kpis For Digital Transformation Portrait PDF
Purpose of the following slide is to show the KPI which can be used to measure the digital transformation, these KPIs can be customer experience, user metrics and application metrics. Do you have an important presentation coming up Are you looking for something that will make your presentation stand out from the rest Look no further than Digital Competency Evaluation And Modification Key Kpis For Digital Transformation Portrait PDF. With our professional designs, you can trust that your presentation will pop and make delivering it a smooth process. And with Slidegeeks, you can trust that your presentation will be unique and memorable. So why wait Grab Digital Competency Evaluation And Modification Key Kpis For Digital Transformation Portrait PDF today and make your presentation stand out from the rest.
Social Media Marketing Performance Tracking Dashboard Guide To Personal Branding Inspiration PDF
Following slide displays KPI dashboard that can be used to monitor the performance of social media marketing campaign. Metrics covered are related to fans number, engagement rate and page impressions.Are you searching for a Social Media Marketing Performance Tracking Dashboard Guide To Personal Branding Inspiration PDF that is uncluttered, straightforward, and original Its easy to edit, and you can change the colors to suit your personal or business branding. For a presentation that expresses how much effort you ve put in, this template is ideal With all of its features, including tables, diagrams, statistics, and lists, its perfect for a business plan presentation. Make your ideas more appealing with these professional slides. Download xxxxxxxxxxxxxxxxxxxx from Slidegeeks today.
Dashboard For Tracking Digital Content Performance Consumer Contact Point Guide Summary PDF
This slide covers the KPI dashboard for analyzing online content. It includes metrics such as blog visitors, pageviews, newsletter conversion rate, new signups, new customers, etc. Are you searching for a Dashboard For Tracking Digital Content Performance Consumer Contact Point Guide Summary PDF that is uncluttered, straightforward, and original It is easy to edit, and you can change the colors to suit your personal or business branding. For a presentation that expresses how much effort you have put in, this template is ideal With all of its features, including tables, diagrams, statistics, and lists, it is perfect for a business plan presentation. Make your ideas more appealing with these professional slides. Download Dashboard For Tracking Digital Content Performance Consumer Contact Point Guide Summary PDF from Slidegeeks today.
Increasing Customer Dashboard For Tracking Aftersales Customer Services Team Ideas PDF
This slide covers the KPI dashboard for ticket tracking. It includes metrics such as tickets by month, service level, and details of customer service department agents. Are you searching for a Increasing Customer Dashboard For Tracking Aftersales Customer Services Team Ideas PDF that is uncluttered, straightforward, and original Its easy to edit, and you can change the colors to suit your personal or business branding. For a presentation that expresses how much effort youve put in, this template is ideal With all of its features, including tables, diagrams, statistics, and lists, its perfect for a business plan presentation. Make your ideas more appealing with these professional slides. Download Increasing Customer Dashboard For Tracking Aftersales Customer Services Team Ideas PDF from Slidegeeks today.
Dashboard For Tracking Social Media Platforms Consumer Contact Point Guide Graphics PDF
This slide covers the KPI dashboard for analyzing social media channels. It includes metrics such as social media followers, Facebook daily reach, Facebook engaged users and page impressions, etc. Retrieve professionally designed Dashboard For Tracking Social Media Platforms Consumer Contact Point Guide Graphics PDF to effectively convey your message and captivate your listeners. Save time by selecting pre-made slideshows that are appropriate for various topics, from business to educational purposes. These themes come in many different styles, from creative to corporate, and all of them are easily adjustable and can be edited quickly. Access them as PowerPoint templates or as Google Slides themes. You do not have to go on a hunt for the perfect presentation because Slidegeeks got you covered from everywhere.
Comprehensive Personal Branding Guidelines Social Media Marketing Performance Tracking Dashboard Pictures PDF
Following slide displays KPI dashboard that can be used to monitor the performance of social media marketing campaign. Metrics covered are related to fans number, engagement rate and page impressions.Retrieve professionally designed Comprehensive Personal Branding Guidelines Social Media Marketing Performance Tracking Dashboard Pictures PDF to effectively convey your message and captivate your listeners. Save time by selecting pre-made slideshows that are appropriate for various topics, from business to educational purposes. These themes come in many different styles, from creative to corporate, and all of them are easily adjustable and can be edited quickly. Access them as PowerPoint templates or as Google Slides themes. You do not have to go on a hunt for the perfect presentation because Slidegeeks got you covered from everywhere.
Dashboard For Tracking Aftersales Customer Services Team Performance Portrait PDF
This slide covers the KPI dashboard for ticket tracking. It includes metrics such as tickets by month, service level, and details of customer service department agents. Retrieve professionally designed Dashboard For Tracking Aftersales Customer Services Team Performance Portrait PDF to effectively convey your message and captivate your listeners. Save time by selecting pre-made slideshows that are appropriate for various topics, from business to educational purposes. These themes come in many different styles, from creative to corporate, and all of them are easily adjustable and can be edited quickly. Access them as PowerPoint templates or as Google Slides themes. You do not have to go on a hunt for the perfect presentation because Slidegeeks got you covered from everywhere.
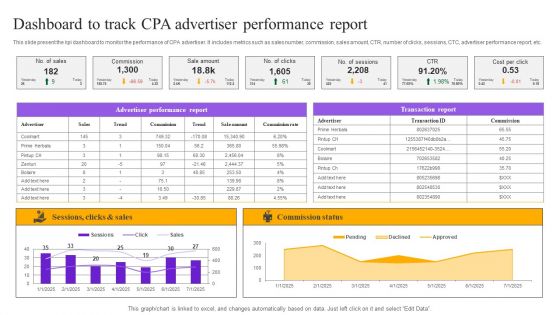
Strategies For Implementing CPA Marketing Dashboard To Track CPA Advertiser Performance Report Inspiration PDF
This slide present the kpi dashboard to monitor the performance of CPA advertiser. It includes metrics such as sales number, commission, sales amount, CTR, number of clicks, sessions, CTC, advertiser performance report, etc. The Strategies For Implementing CPA Marketing Dashboard To Track CPA Advertiser Performance Report Inspiration PDF is a compilation of the most recent design trends as a series of slides. It is suitable for any subject or industry presentation, containing attractive visuals and photo spots for businesses to clearly express their messages. This template contains a variety of slides for the user to input data, such as structures to contrast two elements, bullet points, and slides for written information. Slidegeeks is prepared to create an impression.
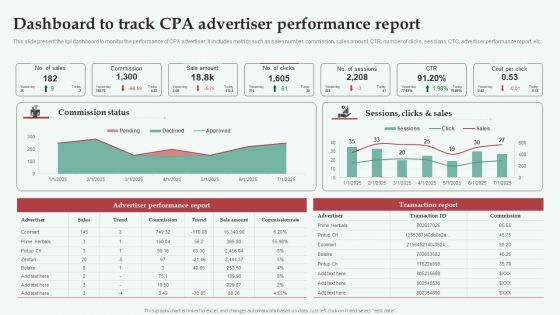
Integrating CPA Marketing Dashboard To Track CPA Advertiser Performance Introduction PDF
This slide present the kpi dashboard to monitor the performance of CPA advertiser. It includes metrics such as sales number, commission, sales amount, CTR, number of clicks, sessions, CTC, advertiser performance report, etc. Slidegeeks is here to make your presentations a breeze with Integrating CPA Marketing Dashboard To Track CPA Advertiser Performance Introduction PDF With our easy-to-use and customizable templates, you can focus on delivering your ideas rather than worrying about formatting. With a variety of designs to choose from, youre sure to find one that suits your needs. And with animations and unique photos, illustrations, and fonts, you can make your presentation pop. So whether youre giving a sales pitch or presenting to the board, make sure to check out Slidegeeks first.
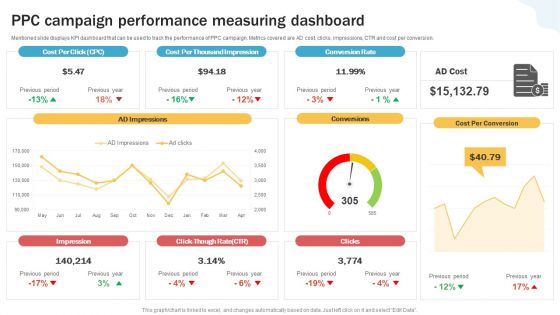
Developing Personal Brand On Social Media Channels Ppc Campaign Performance Measuring Sample PDF
Mentioned slide displays KPI dashboard that can be used to track the performance of PPC campaign. Metrics covered are AD cost, clicks, impressions, CTR and cost per conversion.Do you have an important presentation coming up Are you looking for something that will make your presentation stand out from the rest Look no further than Developing Personal Brand On Social Media Channels Ppc Campaign Performance Measuring Sample PDF. With our professional designs, you can trust that your presentation will pop and make delivering it a smooth process. And with Slidegeeks, you can trust that your presentation will be unique and memorable. So why wait Grab Developing Personal Brand On Social Media Channels Ppc Campaign Performance Measuring Sample PDF today and make your presentation stand out from the rest.
Social Media Marketing Performance Tracking Dashboard Inspiration PDF
Following slide displays KPI dashboard that can be used to monitor the performance of social media marketing campaign. Metrics covered are related to fans number, engagement rate and page impressions.This Social Media Marketing Performance Tracking Dashboard Inspiration PDF from Slidegeeks makes it easy to present information on your topic with precision. It provides customization options, so you can make changes to the colors, design, graphics, or any other component to create a unique layout. It is also available for immediate download, so you can begin using it right away. Slidegeeks has done good research to ensure that you have everything you need to make your presentation stand out. Make a name out there for a brilliant performance.
Effective Lead Generation For Higher Conversion Rates Dashboard For Tracking Leads Generated From Various Guidelines PDF
This slide covers the KPI dashboard for tracking metrics such as leads, ACV wins, customer acquisition cost, click-through rate, and cost per conversion. It also includes leads per various campaigns such as social media, paid marketing, email marketing, etc. If you are looking for a format to display your unique thoughts, then the professionally designed Effective Lead Generation For Higher Conversion Rates Dashboard For Tracking Leads Generated From Various Guidelines PDF is the one for you. You can use it as a Google Slides template or a PowerPoint template. Incorporate impressive visuals, symbols, images, and other charts. Modify or reorganize the text boxes as you desire. Experiment with shade schemes and font pairings. Alter, share or cooperate with other people on your work. Download Effective Lead Generation For Higher Conversion Rates Dashboard For Tracking Leads Generated From Various Guidelines PDF and find out how to give a successful presentation. Present a perfect display to your team and make your presentation unforgettable.
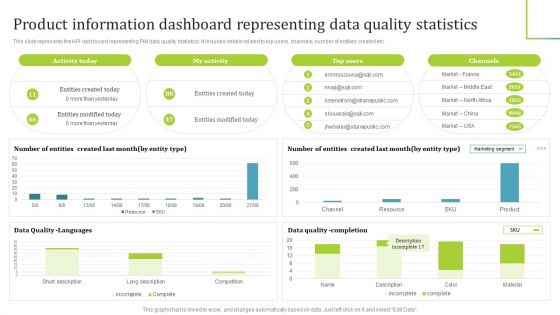
PIM Software Deployment To Enhance Conversion Rates Product Information Dashboard Representing Data Quality Statistics Download PDF
This slide represents the KPI dashboard representing PIM data quality statistics. It includes details related to top users, channels, number of entities created etc. Coming up with a presentation necessitates that the majority of the effort goes into the content and the message you intend to convey. The visuals of a PowerPoint presentation can only be effective if it supplements and supports the story that is being told. Keeping this in mind our experts created PIM Software Deployment To Enhance Conversion Rates Product Information Dashboard Representing Data Quality Statistics Download PDF to reduce the time that goes into designing the presentation. This way, you can concentrate on the message while our designers take care of providing you with the right template for the situation.
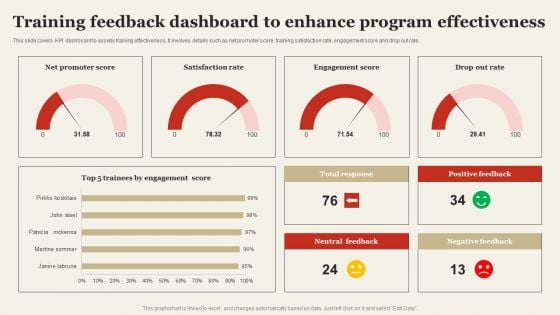
Training Feedback Dashboard To Enhance Program Effectiveness Themes PDF
This slide covers KPI dashboard to assess training effectiveness. It involves details such as net promoter score, training satisfaction rate, engagement score and drop out rate. Coming up with a presentation necessitates that the majority of the effort goes into the content and the message you intend to convey. The visuals of a PowerPoint presentation can only be effective if it supplements and supports the story that is being told. Keeping this in mind our experts created Training Feedback Dashboard To Enhance Program Effectiveness Themes PDF to reduce the time that goes into designing the presentation. This way, you can concentrate on the message while our designers take care of providing you with the right template for the situation.
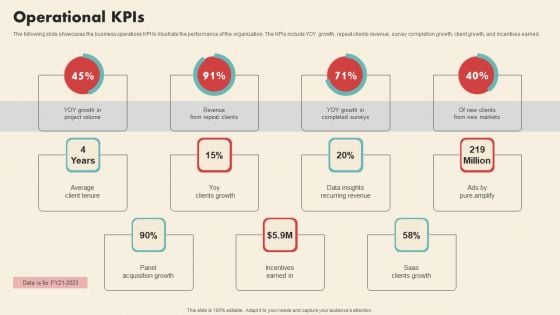
Data Driven Marketing Solutions Firm Company Profile Operational Kpis Graphics PDF
The following slide showcases the business operations KPI to illustrate the performance of the organization. The KPIs include YOY growth, repeat clients revenue, survey completion growth, client growth, and incentives earned. Are you searching for a Data Driven Marketing Solutions Firm Company Profile Operational Kpis Graphics PDF that is uncluttered, straightforward, and original Its easy to edit, and you can change the colors to suit your personal or business branding. For a presentation that expresses how much effort you have put in, this template is ideal. With all of its features, including tables, diagrams, statistics, and lists, its perfect for a business plan presentation. Make your ideas more appealing with these professional slides. Download Data Driven Marketing Solutions Firm Company Profile Operational Kpis Graphics PDF from Slidegeeks today.
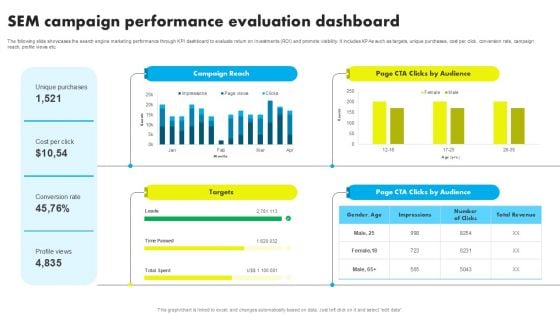
SEM Campaign Performance Evaluation Dashboard Ppt Icon Graphics Tutorials PDF
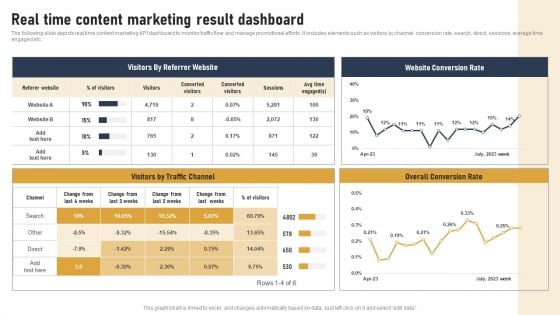
Incorporating Real Time Marketing For Improved Consumer Real Time Content Marketing Result Dashboard Mockup PDF
The following slide depicts real time content marketing KPI dashboard to monitor traffic flow and manage promotional efforts. It includes elements such as visitors by channel, conversion rate, search, direct, sessions, average time engaged etc. This modern and well arranged Incorporating Real Time Marketing For Improved Consumer Real Time Content Marketing Result Dashboard Mockup PDF provides lots of creative possibilities. It is very simple to customize and edit with the Powerpoint Software. Just drag and drop your pictures into the shapes. All facets of this template can be edited with Powerpoint no extra software is necessary. Add your own material, put your images in the places assigned for them, adjust the colors, and then you can show your slides to the world, with an animated slide included.
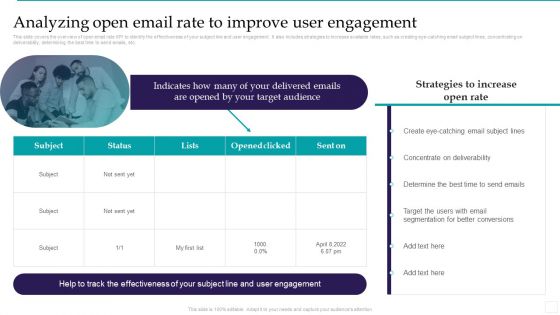
Optimizing Marketing Analytics To Enhance Organizational Growth Analyzing Open Email Rate Rules PDF
This slide covers the overview of open email rate KPI to identify the effectiveness of your subject line and user engagement. It also includes strategies to increase available rates, such as creating eye-catching email subject lines, concentrating on deliverability, determining the best time to send emails, etc. Slidegeeks is here to make your presentations a breeze with Optimizing Marketing Analytics To Enhance Organizational Growth Analyzing Open Email Rate Rules PDF With our easy to use and customizable templates, you can focus on delivering your ideas rather than worrying about formatting. With a variety of designs to choose from, you are sure to find one that suits your needs. And with animations and unique photos, illustrations, and fonts, you can make your presentation pop. So whether you are giving a sales pitch or presenting to the board, make sure to check out Slidegeeks first.
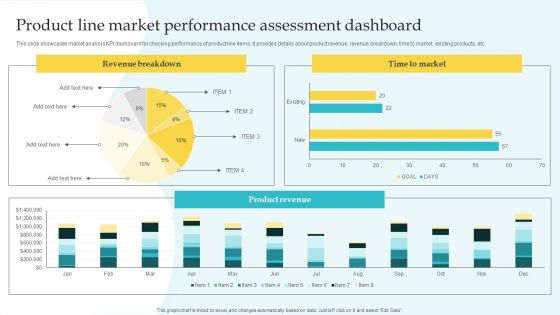
Commodity Line Expansion Product Line Market Performance Assessment Download PDF
This slide showcases market analysis KPI dashboard for checking performance of product line items. It provides details about product revenue, revenue breakdown, time to market, existing products, etc. Explore a selection of the finest Commodity Line Expansion Product Line Market Performance Assessment Download PDF here. With a plethora of professionally designed and pre-made slide templates, you can quickly and easily find the right one for your upcoming presentation. You can use our Commodity Line Expansion Product Line Market Performance Assessment Download PDF to effectively convey your message to a wider audience. Slidegeeks has done a lot of research before preparing these presentation templates. The content can be personalized and the slides are highly editable. Grab templates today from Slidegeeks.
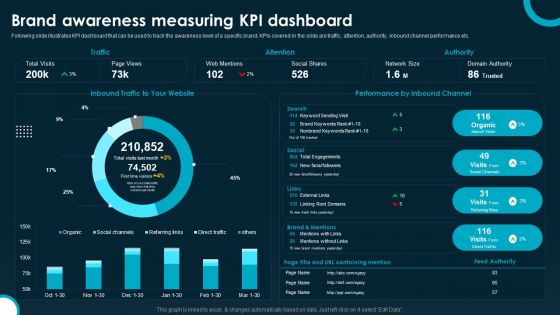
Creating And Implementing A Powerful Brand Leadership Strategy Brand Awareness Structure PDF
Following slide illustrates KPI dashboard that can be used to track the awareness level of a specific brand. KPIs covered in the slide are traffic, attention, authority, inbound channel performance etc. This Creating And Implementing A Powerful Brand Leadership Strategy Brand Awareness Structure PDF from Slidegeeks makes it easy to present information on your topic with precision. It provides customization options, so you can make changes to the colors, design, graphics, or any other component to create a unique layout. It is also available for immediate download, so you can begin using it right away. Slidegeeks has done good research to ensure that you have everything you need to make your presentation stand out. Make a name out there for a brilliant performance.
Actual Vs Forecast Powerpoint Ppt Template Bundles
This Actual Vs Forecast Powerpoint Ppt Template Bundles is designed to help you retain your audiences attention. This content-ready PowerPoint Template enables you to take your audience on a journey and share information in a way that is easier to recall. It helps you highlight the crucial parts of your work so that the audience does not get saddled with information download. This KPI Dashboard, Data Driven Marketing, Campaign Performance, Marketing Evaluation, Inventory Assessment-slide PPT Deck comes prepared with the graphs and charts you could need to showcase your information through visuals. You only need to enter your own data in them. Download this editable PowerPoint Theme and walk into that meeting with confidence. Our Actual vs. Forecast PowerPoint presentation can provide you with valuable business insights. Analyze sales figures, budgets, and financial predictions. Identify major differences, modify methods, and match projections with results to improve decision-making. Download now to accelerate your success.

Quarterly Report Powerpoint Presentation Slides PPT Example
This Quarterly Report Powerpoint Presentation Slides PPT Example is a primer on how to capitalize on business opportunities through planning, innovation, and market intelligence. The content-ready format of the complete deck will make your job as a decision-maker a lot easier. Use this ready-made PowerPoint Template to help you outline an extensive and legible plan to capture markets and grow your company on the right path, at an exponential pace. What is even more amazing is that this presentation is completely editable and 100 percent customizable. This twenty six slide complete deck helps you impress a roomful of people with your expertise in business and even presentation. Craft such a professional and appealing presentation for that amazing recall value. Download now. Our comprehensive Quarterly Report Template is a professionally created presentation that can help organizations in representing key data, performance metrics and progress updates. This ppt streamlines the reporting process by providing structured sections for financial results, project updates, strategic insights, etc. It is ideal for internal reviews, stakeholder presentations, and executive summaries, ensuring your quarterly updates are communicated effectively and positively.
Market Research Power Point Presentation Slides
This Market Research Power Point Presentation Slides is a primer on how to capitalize on business opportunities through planning, innovation, and market intelligence. The content-ready format of the complete deck will make your job as a decision-maker a lot easier. Use this ready-made PowerPoint Template to help you outline an extensive and legible plan to capture markets and grow your company on the right path, at an exponential pace. What is even more amazing is that this presentation is completely editable and 100 percent customizable. This N-slide complete deck helps you impress a roomful of people with your expertise in business and even presentation. Craft such a professional and appealing presentation for that amazing recall value. Download now. Use our professionally designed presentation on Market Research that helps to shape shape your organizations strategy and evaluate the viability of business projects. This PPT covers key market drivers, constraints, forecasts, and industry-specific drivers such as the Internet of Things, the food industry, and technology market trends. Utilize data through visually appealing and easy to understand dashboards and KPI tracker sheet that allow you to effectively showcase research findings.Get access to this valuable tool by downloading this presentation that helps to drive sales, boost profits and foster strategic discussions.
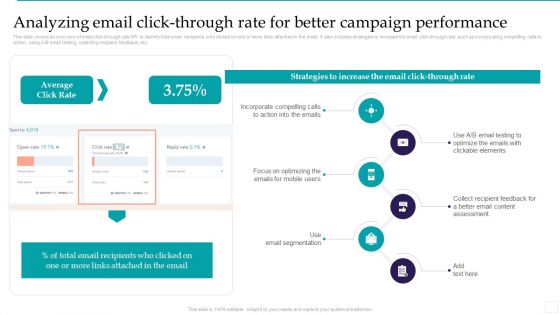
Analyzing Email Click Through Rate For Better Campaign Performance Slides PDF
This slide covers an overview of email click through rate KPI to identify total email recipients who clicked on one or more links attached in the email. It also includes strategies to increase the email click through rate, such as incorporating compelling calls to action, using A or B email testing, collecting recipient feedback, etc. If you are looking for a format to display your unique thoughts, then the professionally designed Analyzing Email Click Through Rate For Better Campaign Performance Slides PDF is the one for you. You can use it as a Google Slides template or a PowerPoint template. Incorporate impressive visuals, symbols, images, and other charts. Modify or reorganize the text boxes as you desire. Experiment with shade schemes and font pairings. Alter, share or cooperate with other people on your work. Download Analyzing Email Click Through Rate For Better Campaign Performance Slides PDF and find out how to give a successful presentation. Present a perfect display to your team and make your presentation unforgettable.
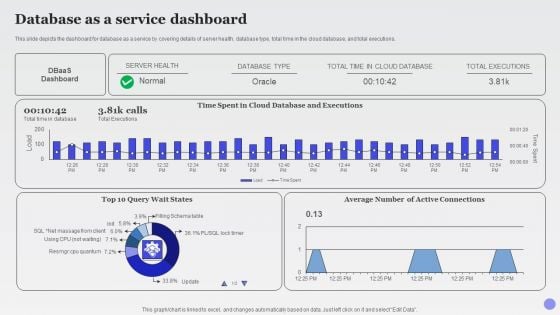
Database As A Service Dashboard Xaas Cloud Computing Models Ppt PowerPoint Presentation Infographics Graphics Design PDF
This slide depicts the dashboard for database as a service by covering details of server health, database type, total time in the cloud database, and total executions.Deliver an awe inspiring pitch with this creative Database As A Service Dashboard Xaas Cloud Computing Models Ppt PowerPoint Presentation Infographics Graphics Design PDF bundle. Topics like Database Executions, Active Connections, Total Executions can be discussed with this completely editable template. It is available for immediate download depending on the needs and requirements of the user.
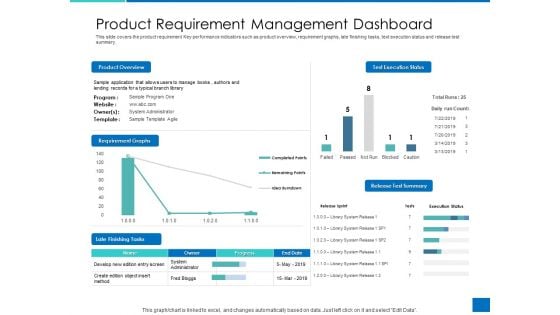
Analyzing Requirement Management Process Product Requirement Management Dashboard Download PDF
This slide covers the product requirement Key performance indicators such as product overview, requirement graphs, late finishing tasks, text execution status and release test summary. Deliver an awe inspiring pitch with this creative analyzing requirement management process product requirement management dashboard download pdf bundle. Topics like product overview, requirement graphs, late finishing tasks, test execution status, release test summary can be discussed with this completely editable template. It is available for immediate download depending on the needs and requirements of the user.
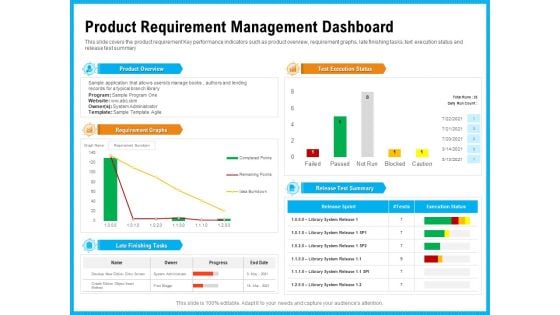
Requirement Gathering Techniques Product Requirement Management Dashboard Sample PDF
This slide covers the product requirement Key performance indicators such as product overview, requirement graphs, late finishing tasks, text execution status and release test summary. Deliver an awe inspiring pitch with this creative requirement gathering techniques product requirement management dashboard sample pdf bundle. Topics like product overview, requirement graphs, late finishing tasks, test execution status, release test summary can be discussed with this completely editable template. It is available for immediate download depending on the needs and requirements of the user.
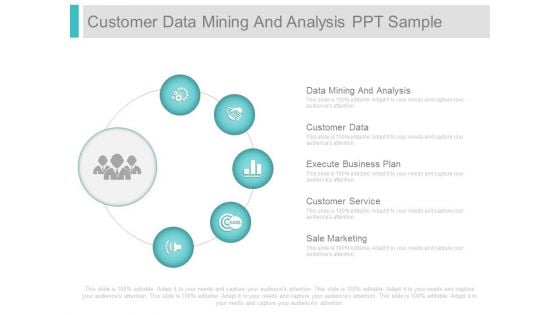
Customer Data Mining And Analysis Ppt Sample
This is a customer data mining and analysis ppt sample. This is a five stage process. The stages in this process are data mining and analysis, customer data, execute business plan, customer service, sale marketing.
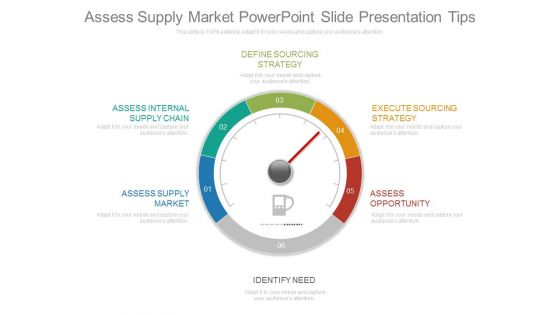
Assess Supply Market Powerpoint Slide Presentation Tips
This is a assess supply market powerpoint slide presentation tips. This is a six stage process. The stages in this process are define sourcing strategy, assess internal supply chain, execute sourcing strategy, assess supply market, assess opportunity, identify need.
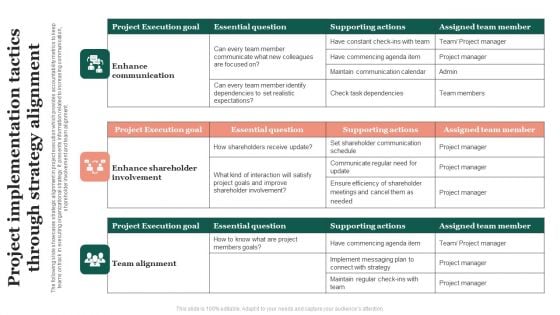
Project Implementation Tactics Through Strategy Alignment Introduction PDF
The following slide showcases strategic alignment in project execution which provides accountability metrics to keep teams on track in executing organizational strategy. It presents information related to increasing communication, shareholder involvement and team alignment. Pitch your topic with ease and precision using this Project Implementation Tactics Through Strategy Alignment Introduction PDF. This layout presents information on Project Execution Goal, Team, Implement. It is also available for immediate download and adjustment. So, changes can be made in the color, design, graphics or any other component to create a unique layout.
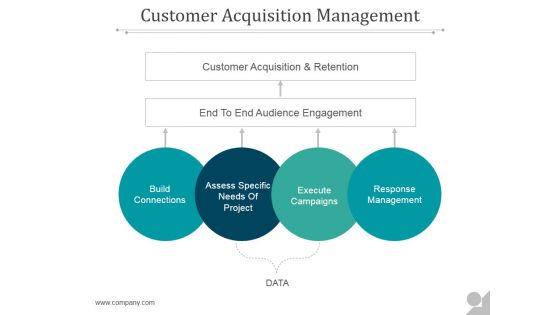
Customer Acquisition Management Ppt PowerPoint Presentation Files
This is a customer acquisition management ppt powerpoint presentation files. This is a four stage process. The stages in this process are build connections, assess specific needs of project, execute campaigns, response management.

Strategic Data Management Template Powerpoint Slide Show
This is a strategic data management template powerpoint slide show. This is a six stage process. The stages in this process are research, analysis, execution and deployment, quality and monitoring, coding, data entry.
Business Meeting Governance Framework With Icons Ppt PowerPoint Presentation Portfolio Templates
Presenting this set of slides with name business meeting governance framework with icons ppt powerpoint presentation portfolio templates. This is a five stage process. The stages in this process are initiate establish the project framework, plan define the metrics, executing execution of governance framework, monitoring and controlling, closing assurance. This is a completely editable PowerPoint presentation and is available for immediate download. Download now and impress your audience.


 Continue with Email

 Home
Home


