Executive Kpi
Monthly Shipping And Inventory Tracking Metrics Tracker Icons PDF
This slide displays the KPI tracker for identifying the shipment, inventory, and fleet maintenance status. It also includes KPIs such as on-time delivery, on-time departure, inventory age, inventory cycle, etc. Showcasing this set of slides titled Monthly Shipping And Inventory Tracking Metrics Tracker Icons PDF. The topics addressed in these templates are Minimum Standard, Level Agreement, Metrics Tracker. All the content presented in this PPT design is completely editable. Download it and make adjustments in color, background, font etc. as per your unique business setting.
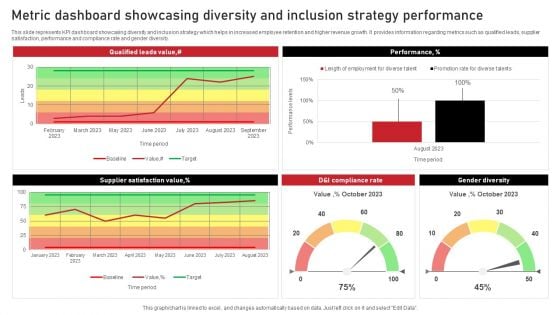
Metric Dashboard Showcasing Diversity And Inclusion Strategy Performance Background PDF
This slide represents KPI dashboard showcasing diversity and inclusion strategy which helps in increased employee retention and higher revenue growth. It provides information regarding metrics such as qualified leads, supplier satisfaction, performance and compliance rate and gender diversity. Showcasing this set of slides titled Metric Dashboard Showcasing Diversity And Inclusion Strategy Performance Background PDF. The topics addressed in these templates are Performance, Gender Diversity, Performance. All the content presented in this PPT design is completely editable. Download it and make adjustments in color, background, font etc. as per your unique business setting.
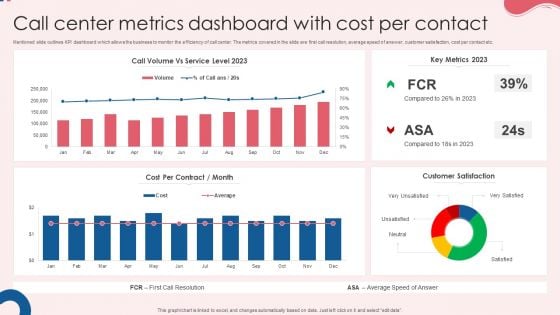
Call Center Metrics Dashboard With Cost Per Contact Rules PDF
Mentioned slide outlines KPI dashboard which allows the business to monitor the efficiency of call center. The metrics covered in the slide are first call resolution, average speed of answer, customer satisfaction, cost per contact etc. Pitch your topic with ease and precision using this Call Center Metrics Dashboard With Cost Per Contact Rules PDF. This layout presents information on Cost Per Contract, Key Metrics, Customer Satisfaction. It is also available for immediate download and adjustment. So, changes can be made in the color, design, graphics or any other component to create a unique layout.
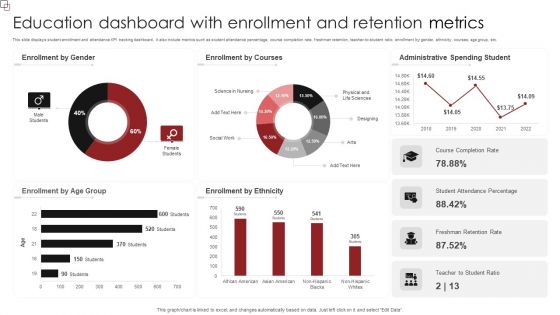
Education Dashboard With Enrollment And Retention Metrics Sample PDF
This slide displays student enrollment and attendance KPI tracking dashboard. It also include metrics such as student attendance percentage, course completion rate, freshman retention, teacher-to-student ratio, enrollment by gender, ethnicity, courses, age group, etc. Pitch your topic with ease and precision using this Education Dashboard With Enrollment And Retention Metrics Sample PDF. This layout presents information on Enrollment Gender, Enrollment Courses, Administrative Spending Student. It is also available for immediate download and adjustment. So, changes can be made in the color, design, graphics or any other component to create a unique layout.

Engineering Performance Metrics Dashboard To Track Pull Requests Background PDF
This slide covers engineering KPI dashboard to track pull request. It involves KPIs such as open time of average pull requests, average comment received, revision rounds, frequency of posting pull requests. Pitch your topic with ease and precision using this Engineering Performance Metrics Dashboard To Track Pull Requests Background PDF. This layout presents information on Dashboard Track Pull Requests, Engineering Performance Metrics. It is also available for immediate download and adjustment. So, changes can be made in the color, design, graphics or any other component to create a unique layout.
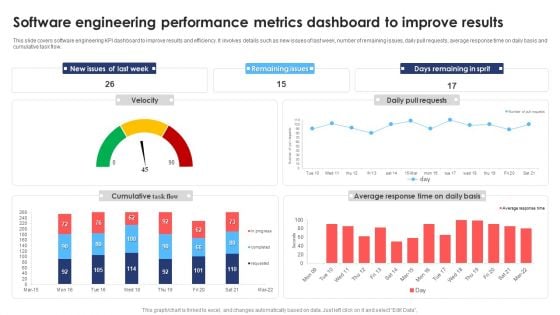
Software Engineering Performance Metrics Dashboard To Improve Results Infographics PDF
This slide covers software engineering KPI dashboard to improve results and efficiency. It involves details such as new issues of last week, number of remaining issues, daily pull requests, average response time on daily basis and cumulative task flow. Pitch your topic with ease and precision using this Software Engineering Performance Metrics Dashboard To Improve Results Infographics PDF. This layout presents information on Software Engineering Performance, Metrics Dashboard Improve Results. It is also available for immediate download and adjustment. So, changes can be made in the color, design, graphics or any other component to create a unique layout.
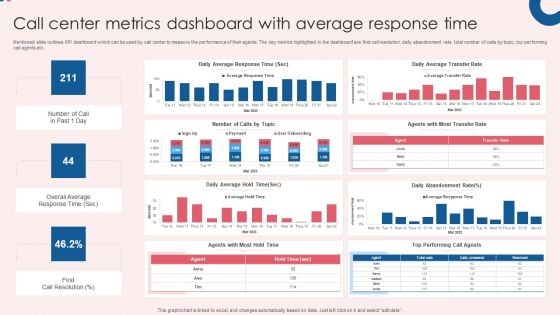
Call Center Metrics Dashboard With Average Response Time Inspiration PDF
Mentioned slide outlines KPI dashboard which can be used by call center to measure the performance of their agents. The key metrics highlighted in the dashboard are first call resolution, daily abandonment rate, total number of calls by topic, top performing call agents etc. Showcasing this set of slides titled Call Center Metrics Dashboard With Average Response Time Inspiration PDF. The topics addressed in these templates are Efficiency, Quality, Activity, Daily Average Response, Daily Average Transfer. All the content presented in this PPT design is completely editable. Download it and make adjustments in color, background, font etc. as per your unique business setting.
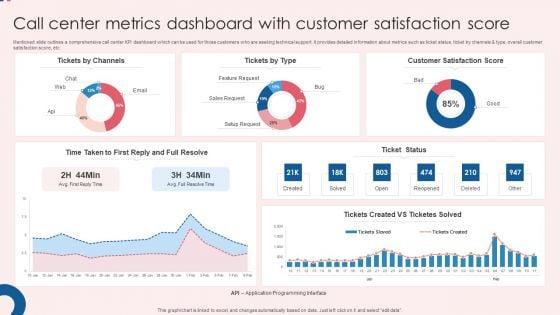
Call Center Metrics Dashboard With Customer Satisfaction Score Ideas PDF
Mentioned slide outlines a comprehensive call center KPI dashboard which can be used for those customers who are seeking technical support. It provides detailed information about metrics such as ticket status, ticket by channels and type, overall customer satisfaction score, etc. Showcasing this set of slides titled Call Center Metrics Dashboard With Customer Satisfaction Score Ideas PDF. The topics addressed in these templates are Customer Satisfaction, Score Ticket Status, Satisfaction Score. All the content presented in this PPT design is completely editable. Download it and make adjustments in color, background, font etc. as per your unique business setting.
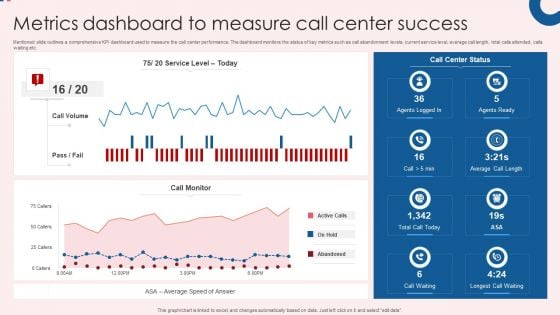
Metrics Dashboard To Measure Call Center Success Themes PDF
Mentioned slide outlines a comprehensive KPI dashboard used to measure the call center performance. The dashboard monitors the status of key metrics such as call abandonment levels, current service level, average call length, total calls attended, calls waiting etc. Showcasing this set of slides titled Metrics Dashboard To Measure Call Center Success Themes PDF. The topics addressed in these templates are Center Success, Call Center Status, Call Monitor. All the content presented in this PPT design is completely editable. Download it and make adjustments in color, background, font etc. as per your unique business setting.

Metrics And Objectives To Measure Employees Performance Clipart PDF
The purpose of this slide is to showcase different KPIs and objectives used to measure employee efficiency. The KPI could be Revenue per employee profit per employee average task completion rate and utilization rate. Showcasing this set of slides titled Metrics And Objectives To Measure Employees Performance Clipart PDF. The topics addressed in these templates are Utilization Rate, Profit Per Employee, Revenue Per Employee. All the content presented in this PPT design is completely editable. Download it and make adjustments in color, background, font etc. as per your unique business setting.
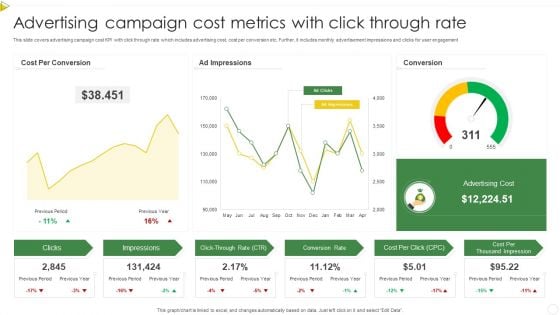
Advertising Campaign Cost Metrics With Click Through Rate Pictures PDF
This slide covers advertising campaign cost KPI with click through rate which includes advertising cost, cost per conversion etc. Further, it includes monthly advertisement impressions and clicks for user engagement. Showcasing this set of slides titled Advertising Campaign Cost Metrics With Click Through Rate Pictures PDF. The topics addressed in these templates are Conversion Rate, Cost Per Click, Advertising Cost. All the content presented in this PPT design is completely editable. Download it and make adjustments in color, background, font etc. as per your unique business setting.
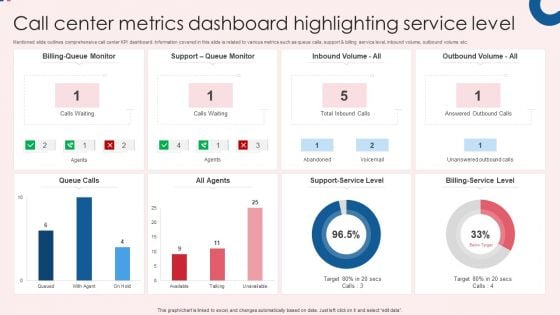
Call Center Metrics Dashboard Highlighting Service Level Infographics PDF
Mentioned slide outlines comprehensive call center KPI dashboard. Information covered in this slide is related to various metrics such as queue calls, support and billing service level, inbound volume, outbound volume etc. Pitch your topic with ease and precision using this Call Center Metrics Dashboard Highlighting Service Level Infographics PDF. This layout presents information on All Agents, Queue Calls, Billing Service Level. It is also available for immediate download and adjustment. So, changes can be made in the color, design, graphics or any other component to create a unique layout.
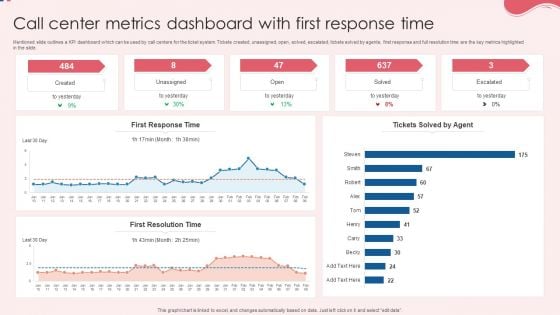
Call Center Metrics Dashboard With First Response Time Background PDF
Mentioned slide outlines a KPI dashboard which can be used by call centers for the ticket system. Tickets created, unassigned, open, solved, escalated, tickets solved by agents, first response and full resolution time are the key metrics highlighted in the slide. Pitch your topic with ease and precision using this Call Center Metrics Dashboard With First Response Time Background PDF. This layout presents information on First Response Time, First Resolution Time, Response Time. It is also available for immediate download and adjustment. So, changes can be made in the color, design, graphics or any other component to create a unique layout.

Marketing Objectives And Metrics With Key Strategies Formats PDF
The purpose of this slide is to showcase different objectives and KPIs of the marketing team. The KPI could be customer lifetime value digital marketing ROI landing page conversion rate and lead to customer ratio. Pitch your topic with ease and precision using this Marketing Objectives And Metrics With Key Strategies Formats PDF. This layout presents information on Key Strategies, Conversion Rate, Customer Lifetime Value. It is also available for immediate download and adjustment. So, changes can be made in the color, design, graphics or any other component to create a unique layout.
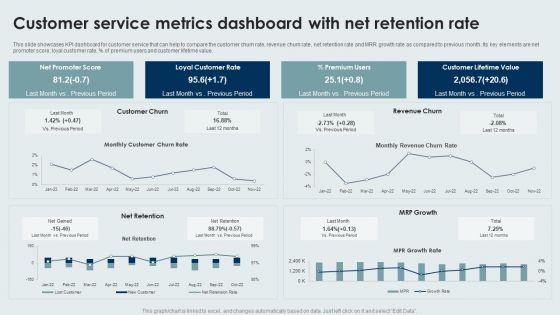
Customer Service Metrics Dashboard With Net Retention Rate Sample PDF
This slide showcases KPI dashboard for customer service that can help to compare the customer churn rate, revenue churn rate, net retention rate and MRR growth rate as compared to previous month. Its key elements are net promoter score, loyal customer rate, percentage of premium users and customer lifetime value. Pitch your topic with ease and precision using this Customer Service Metrics Dashboard With Net Retention Rate Sample PDF. This layout presents information on Loyal Customer Rate, Premium Users, Customer Lifetime Value. It is also available for immediate download and adjustment. So, changes can be made in the color, design, graphics or any other component to create a unique layout.
Shipping Delivery Tracking Metrics Analysis Dashboard Structure PDF
This template illustrates the KPI dashboard for tracking shipment orders. It also includes shipment analysis based on different KPIs such as ongoing delivery, completed delivery, on-time delivery, actual delivery duration, and variance between expected and actual delivery time. Pitch your topic with ease and precision using this Shipping Delivery Tracking Metrics Analysis Dashboard Structure PDF. This layout presents information on Recipient Country, Completed Deliveries, Delivery Duration. It is also available for immediate download and adjustment. So, changes can be made in the color, design, graphics or any other component to create a unique layout.
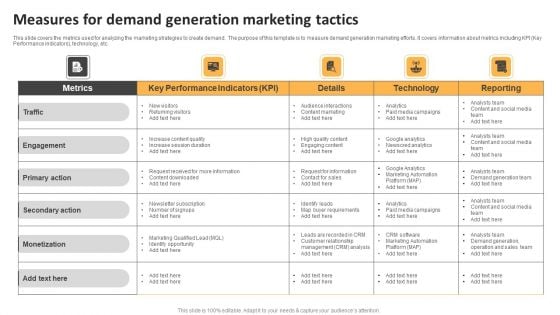
Measures For Demand Generation Marketing Tactics Ppt Slides Outline PDF
This slide covers the metrics used for analyzing the marketing strategies to create demand. The purpose of this template is to measure demand generation marketing efforts. It covers information about metrics including KPI Key Performance indicators, technology, etc. Pitch your topic with ease and precision using this Measures For Demand Generation Marketing Tactics Ppt Slides Outline PDF. This layout presents information on Key Performance Indicators, Details, Technology. It is also available for immediate download and adjustment. So, changes can be made in the color, design, graphics or any other component to create a unique layout.
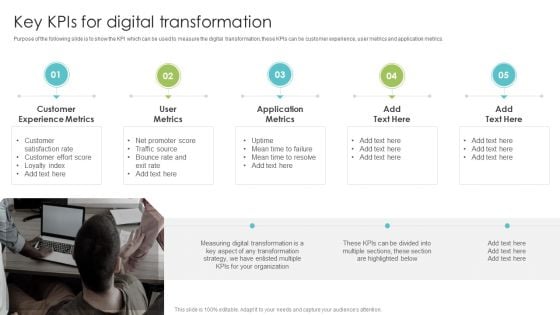
Playbook For Enterprise Transformation Administration Key Kpis For Digital Transformation Sample PDF
Purpose of the following slide is to show the KPI which can be used to measure the digital transformation, these KPIs can be customer experience, user metrics and application metrics. This is a Playbook For Enterprise Transformation Administration Key Kpis For Digital Transformation Sample PDF template with various stages. Focus and dispense information on five stages using this creative set, that comes with editable features. It contains large content boxes to add your information on topics like User Metrics, Application Metrics, Customer Experience Metrics. You can also showcase facts, figures, and other relevant content using this PPT layout. Grab it now.
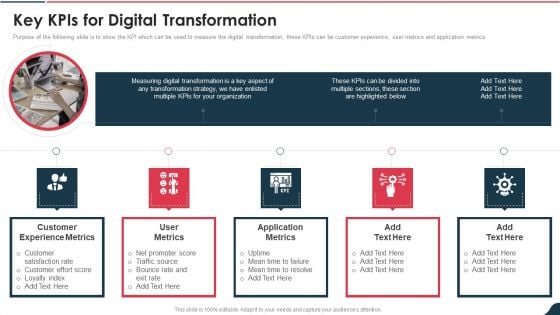
Electronic Playbook Key Kpis For Digital Transformation Infographics PDF
Purpose of the following slide is to show the KPI which can be used to measure the digital transformation, these KPIs can be customer experience, user metrics and application metrics. This is a electronic playbook key kpis for digital transformation infographics pdf template with various stages. Focus and dispense information on five stages using this creative set, that comes with editable features. It contains large content boxes to add your information on topics like customer experience metrics, application metrics, satisfaction rate customer You can also showcase facts, figures, and other relevant content using this PPT layout. Grab it now.
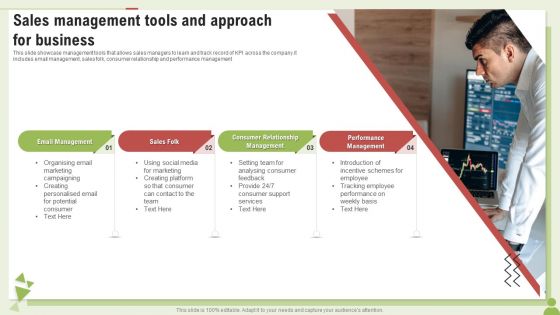
Sales Management Tools And Approach For Business Ppt PowerPoint Presentation Slides Graphics Template PDF
This slide showcase management tools that allows sales managers to learn and track record of KPI across the company.it includes email management, sales folk, consumer relationship and performance management.Presenting Sales Management Tools And Approach For Business Ppt PowerPoint Presentation Slides Graphics Template PDF to dispense important information. This template comprises four stages. It also presents valuable insights into the topics including Consumer Relationship, Performance Management, Sales Folk. This is a completely customizable PowerPoint theme that can be put to use immediately. So, download it and address the topic impactfully.
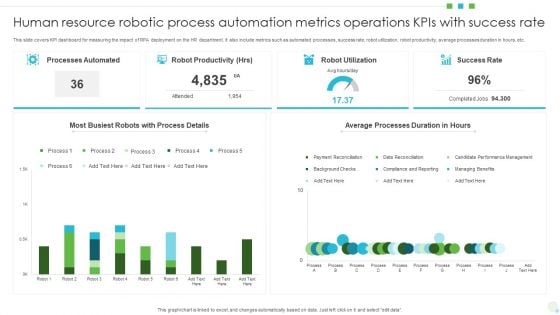
Human Resource Robotic Process Automation Metrics Operations Kpis With Success Rate Themes PDF
This slide covers KPI dashboard for measuring the impact of RPA deployment on the HR department. It also include metrics such as automated processes, success rate, robot utilization, robot productivity, average processes duration in hours, etc. Showcasing this set of slides titled Human Resource Robotic Process Automation Metrics Operations Kpis With Success Rate Themes PDF. The topics addressed in these templates are Processes Automated, Robot Productivity, Robot Utilization. All the content presented in this PPT design is completely editable. Download it and make adjustments in color, background, font etc. as per your unique business setting.
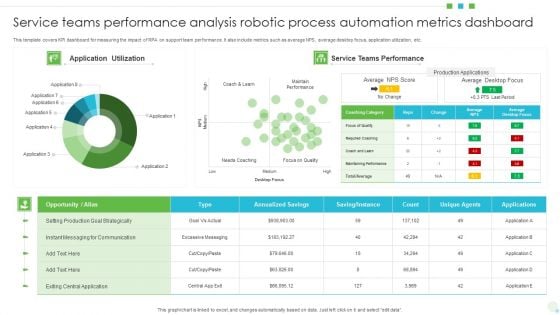
Service Teams Performance Analysis Robotic Process Automation Metrics Dashboard Brochure PDF
This template covers KPI dashboard for measuring the impact of RPA on support team performance. It also include metrics such as average NPS, average desktop focus, application utilization, etc. Showcasing this set of slides titled Service Teams Performance Analysis Robotic Process Automation Metrics Dashboard Brochure PDF. The topics addressed in these templates are Opportunity, Production Goal Strategically, Application Utilization. All the content presented in this PPT design is completely editable. Download it and make adjustments in color, background, font etc. as per your unique business setting.
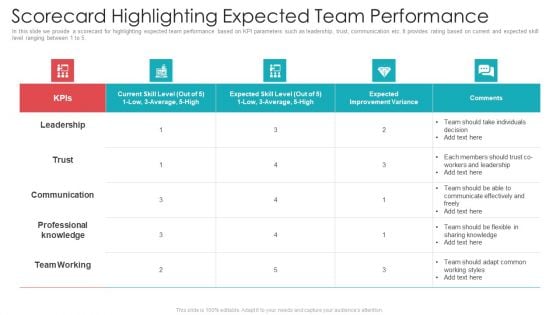
Official Team Collaboration Plan Scorecard Highlighting Expected Team Performance Template PDF
In this slide we provide a scorecard for highlighting expected team performance based on KPI parameters such as leadership, trust, communication etc. It provides rating based on current and expected skill level ranging between 1 to 5. Deliver and pitch your topic in the best possible manner with this official team collaboration plan scorecard highlighting expected team performance template pdf. Use them to share invaluable insights on communication, professional knowledge, team working, leadership, trust and impress your audience. This template can be altered and modified as per your expectations. So, grab it now.

Strategic Business Plan Effective Tools Ogsm Framework Model Converts Strategy Into Action Background PDF
This slide covers the objectives, goals, strategies and measures model of a digital marketing firm. This is a strategic business plan effective tools ogsm framework model converts strategy into action background pdf template with various stages. Focus and dispense information on four stages using this creative set, that comes with editable features. It contains large content boxes to add your information on topics like goals, strategies, kpi measure, tactical actions. You can also showcase facts, figures, and other relevant content using this PPT layout. Grab it now.
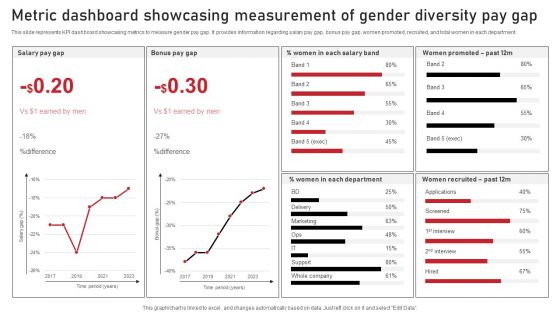
Metric Dashboard Showcasing Measurement Of Gender Diversity Pay Gap Sample PDF
This slide represents KPI dashboard showcasing metrics to measure gender pay gap. It provides information regarding salary pay gap, bonus pay gap, women promoted, recruited, and total women in each department. Pitch your topic with ease and precision using this Metric Dashboard Showcasing Measurement Of Gender Diversity Pay Gap Sample PDF. This layout presents information on Marketing, Screened, Delivery. It is also available for immediate download and adjustment. So, changes can be made in the color, design, graphics or any other component to create a unique layout.
Market Evaluation Of IT Industry Marketing Campaign Dashboard For B2b Marketers Icons PDF
The following slide showcases key performance indicator KPI dashboard that can assist managers to evaluate digital marketing campaign performance. The key metrics mentioned in the slide are click through rate CTR, conversion rate, cost per click CPC, etc. Make sure to capture your audiences attention in your business displays with our gratis customizable Market Evaluation Of IT Industry Marketing Campaign Dashboard For B2b Marketers Icons PDF. These are great for business strategies, office conferences, capital raising or task suggestions. If you desire to acquire more customers for your tech business and ensure they stay satisfied, create your own sales presentation with these plain slides.
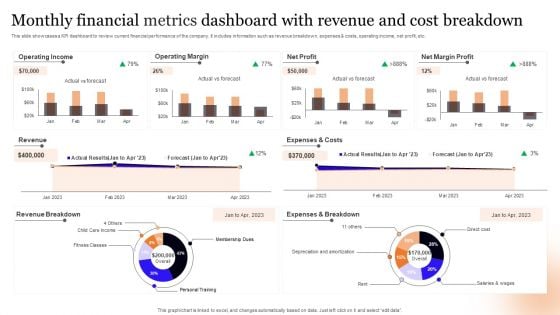
Monthly Financial Metrics Dashboard With Revenue And Cost Breakdown Information PDF
This slide showcases a KPI dashboard to review current financial performance of the company. It includes information such as revenue breakdown, expenses and costs, operating income, net profit, etc. Pitch your topic with ease and precision using this Monthly Financial Metrics Dashboard With Revenue And Cost Breakdown Information PDF. This layout presents information on Operating Income, Operating Margin, Net Profit. It is also available for immediate download and adjustment. So, changes can be made in the color, design, graphics or any other component to create a unique layout.
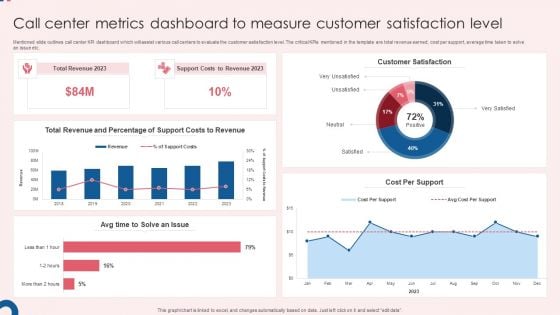
Call Center Metrics Dashboard To Measure Customer Satisfaction Level Slides PDF
Mentioned slide outlines call center KPI dashboard which will assist various call centers to evaluate the customer satisfaction level. The critical KPIs mentioned in the template are total revenue earned, cost per support, average time taken to solve an issue etc. Showcasing this set of slides titled Call Center Metrics Dashboard To Measure Customer Satisfaction Level Slides PDF. The topics addressed in these templates are Total Revenue, Support Costs, Customer Satisfaction. All the content presented in this PPT design is completely editable. Download it and make adjustments in color, background, font etc. as per your unique business setting.
Escalation Steps For Projects Dashboard For Managing Project Issues In The Organization Icons PDF
This slide provides the glimpse about the KPI for managing project issues in the organization wherein focus is on project health, tasks, progress, time, cost and workload. Deliver and pitch your topic in the best possible manner with this escalation steps for projects dashboard for managing project issues in the organization icons pdf. Use them to share invaluable insights on dashboard for managing project issues in the organization and impress your audience. This template can be altered and modified as per your expectations. So, grab it now.
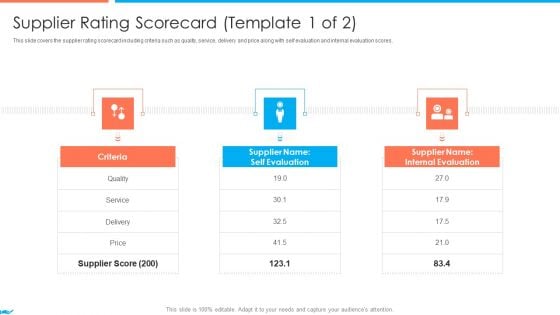
Supplier Association Management Techniques Supplier Rating Scorecard Template Criteria Mockup PDF
This slide covers the supplier rating scorecard including criteria such as quality, service, delivery and price along with self evaluation and internal evaluation scores. This is a supplier association management techniques supplier performance management kpi dashboards guidelines pdf template with various stages. Focus and dispense information on three stages using this creative set, that comes with editable features. It contains large content boxes to add your information on topics like reduction in costs, increased efficiency, increase in profitability. You can also showcase facts, figures, and other relevant content using this PPT layout. Grab it now.
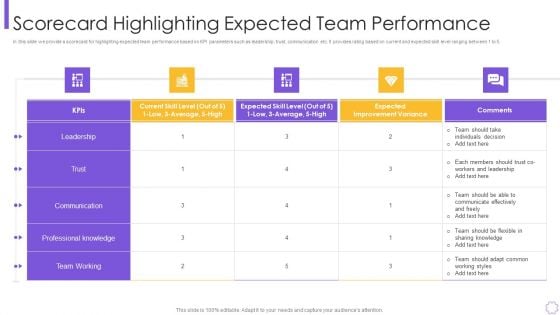
Process Optimization Through Product Life Process Management Techniques Scorecard Rules Portrait PDF
In this slide we provide a scorecard for highlighting expected team performance based on KPI parameters such as leadership, trust, communication etc. It provides rating based on current and expected skill level ranging between 1 to 5.Deliver an awe inspiring pitch with this creative process optimization through product life process management techniques scorecard rules portrait pdf bundle. Topics like professional knowledge, communication, individuals decision can be discussed with this completely editable template. It is available for immediate download depending on the needs and requirements of the user.
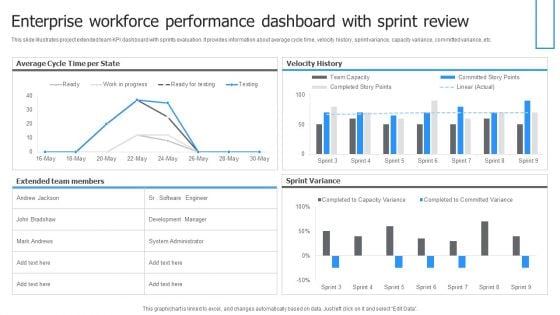
Enterprise Workforce Performance Dashboard With Sprint Review Themes PDF
This slide illustrates project extended team KPI dashboard with sprints evaluation. It provides information about average cycle time, velocity history, sprint variance, capacity variance, committed variance, etc. Showcasing this set of slides titled Enterprise Workforce Performance Dashboard With Sprint Review Themes PDF. The topics addressed in these templates are Velocity History, Sprint Variance, Average Cycle, Time Per State. All the content presented in this PPT design is completely editable. Download it and make adjustments in color, background, font etc. as per your unique business setting.
Business Plan Methods Tools And Templates Set 2 OGSM Framework Model Converts Strategy Into Action Icons PDF
This slide covers the objectives, goals, strategies and measures model of a digital marketing firm. This is a business plan methods tools and templates set 2 ogsm framework model converts strategy into action icons pdf template with various stages. Focus and dispense information on four stages using this creative set, that comes with editable features. It contains large content boxes to add your information on topics like goals, strategies, kpi measure, tactical actions. You can also showcase facts, figures, and other relevant content using this PPT layout. Grab it now.
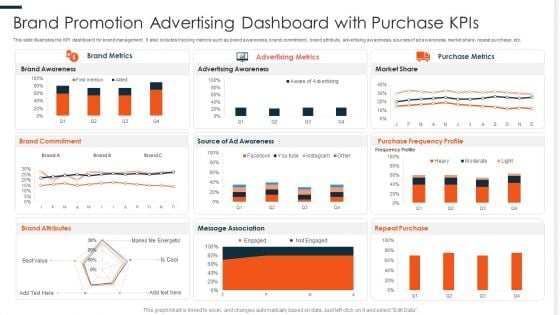
Brand Promotion Advertising Dashboard With Purchase Kpis Ppt PowerPoint Presentation File Format PDF
This slide illustrates the KPI dashboard for brand management. It also includes tracking metrics such as brand awareness, brand commitment, brand attribute, advertising awareness, sources of ad awareness, market share, repeat purchase, etc. Showcasing this set of slides titled Brand Promotion Advertising Dashboard With Purchase Kpis Ppt PowerPoint Presentation File Format PDF. The topics addressed in these templates are Brand Awareness, Advertising Awareness, Purchase Frequency. All the content presented in this PPT design is completely editable. Download it and make adjustments in color, background, font etc. as per your unique business setting.
Advertising New Commodities Through Affect Of Extension Strategies On Brands Icons PDF
This slide showcases affect of key extension strategies on major key performance indicators KPI and market insights. It provides details about lifetime value, audience share, customer retention rate, customer engagement, online promotion, etc. Find a pre-designed and impeccable Advertising New Commodities Through Affect Of Extension Strategies On Brands Icons PDF. The templates can ace your presentation without additional effort. You can download these easy-to-edit presentation templates to make your presentation stand out from others. So, what are you waiting for Download the template from Slidegeeks today and give a unique touch to your presentation.
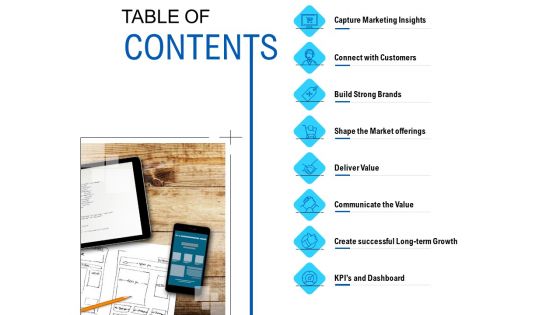
Competition In Market TABLE OF CONTENTS Ppt Portfolio Sample PDF Ppt Slide PDF
This is a competition in market table of contents ppt portfolio sample pdf ppt slide pdf. template with various stages. Focus and dispense information on eight stages using this creative set, that comes with editable features. It contains large content boxes to add your information on topics like capture marketing insights, connect with customers, build strong brands, shape market offerings, deliver value, communicate value, create successful long term growth, kpi s and dashboard. You can also showcase facts, figures, and other relevant content using this PPT layout. Grab it now.
Client Retargeting Strategy Dashboard For Tracking Impact Of Customer Retargeting Professional PDF
This slide covers a KPI dashboard for analyzing consumer retargeting advertisements. It includes metrics such as total clicks before retargeting, after retargeting, top references by share, and top retargeting regions. Take your projects to the next level with our ultimate collection of Client Retargeting Strategy Dashboard For Tracking Impact Of Customer Retargeting Professional PDF. Slidegeeks has designed a range of layouts that are perfect for representing task or activity duration, keeping track of all your deadlines at a glance. Tailor these designs to your exact needs and give them a truly corporate look with your own brand colors theyll make your projects stand out from the rest.

Call Center Kpis Agent Performance Dashboard Clipart PDF
This slide covers contact center agent performance metrics KPI dashboard. It involves metrics such as number of calls, average response time, average hold time, daily average transfer rate and agents with most hold time and transfer rate. Showcasing this set of slides titled Call Center Kpis Agent Performance Dashboard Clipart PDF. The topics addressed in these templates are Transfer Rate, Call Center, Hold Time. All the content presented in this PPT design is completely editable. Download it and make adjustments in color, background, font etc. as per your unique business setting.
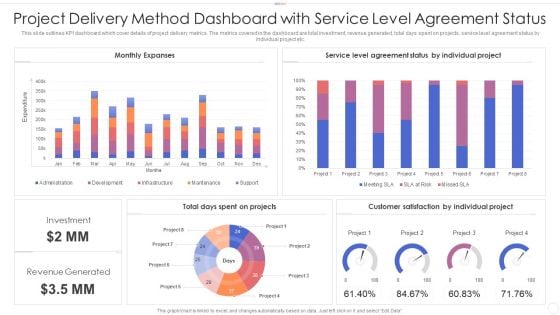
Project Delivery Method Dashboard With Service Level Agreement Status Clipart PDF
This slide outlines KPI dashboard which cover details of project delivery metrics. The metrics covered in the dashboard are total investment, revenue generated, total days spent on projects, service level agreement status by individual project etc. Pitch your topic with ease and precision using this project delivery method dashboard with service level agreement status clipart pdf. This layout presents information on project delivery method dashboard with service level agreement status. It is also available for immediate download and adjustment. So, changes can be made in the color, design, graphics or any other component to create a unique layout.
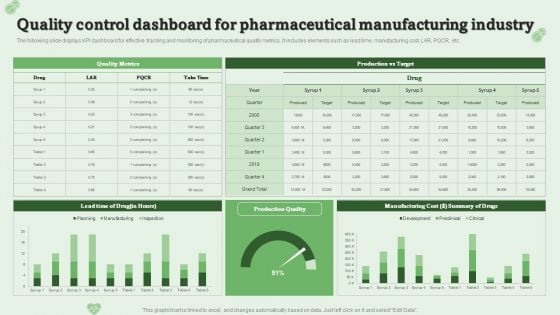
Quality Control Dashboard For Pharmaceutical Manufacturing Industry Ppt PowerPoint Presentation Model Layouts PDF
The following slide displays KPI dashboard for effective tracking and monitoring of pharmaceutical quality metrics. It includes elements such as lead time, manufacturing cost, LAR, PQCR, etc.Pitch your topic with ease and precision using this Quality Control Dashboard For Pharmaceutical Manufacturing Industry Ppt PowerPoint Presentation Model Layouts PDF. This layout presents information on Manufacturing Cost, Summary Drugs, Quality Metrics. It is also available for immediate download and adjustment. So, changes can be made in the color, design, graphics or any other component to create a unique layout.
Consumer Journey Mapping Techniques Dashboard For Tracking Social Media Platforms Introduction PDF
This slide covers the KPI dashboard for analyzing social media channels. It includes metrics such as social media followers, Facebook daily reach, Facebook engaged users and page impressions, etc. Pitch your topic with ease and precision using this Consumer Journey Mapping Techniques Dashboard For Tracking Social Media Platforms Introduction PDF. This layout presents information on Linkedin Key Metrics, Social Media Followers, Awareness. It is also available for immediate download and adjustment. So, changes can be made in the color, design, graphics or any other component to create a unique layout.
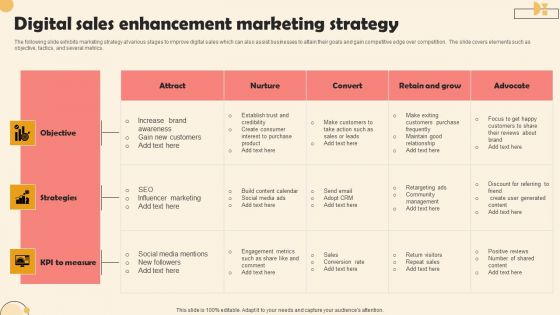
Digital Sales Enhancement Marketing Strategy Inspiration PDF
The following slide exhibits marketing strategy at various stages to improve digital sales which can also assist businesses to attain their goals and gain competitive edge over competition. The slide covers elements such as objective, tactics, and several metrics. Showcasing this set of slides titled Digital Sales Enhancement Marketing Strategy Inspiration PDF. The topics addressed in these templates are Objective, Strategies, KPI Measure. All the content presented in this PPT design is completely editable. Download it and make adjustments in color, background, font etc. as per your unique business setting.
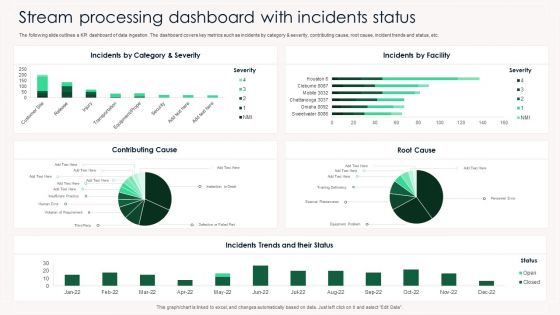
Stream Processing Dashboard With Incidents Status Ppt PowerPoint Presentation Gallery Portrait PDF
The following slide outlines a KPI dashboard of data ingestion. The dashboard covers key metrics such as incidents by category and severity, contributing cause, root cause, incident trends and status, etc. Showcasing this set of slides titled Stream Processing Dashboard With Incidents Status Ppt PowerPoint Presentation Gallery Portrait PDF. The topics addressed in these templates are Incidens, Category And Severity, Incidents By Facility, Contributing Cause. All the content presented in this PPT design is completely editable. Download it and make adjustments in color, background, font etc. as per your unique business setting.
Consumer Journey Mapping Techniques Dashboard For Tracking Digital Content Performance Clipart PDF
This slide covers the KPI dashboard for analyzing online content. It includes metrics such as blog visitors, pageviews, newsletter conversion rate, new signups, new customers, etc. Showcasing this set of slides titled Consumer Journey Mapping Techniques Dashboard For Tracking Digital Content Performance Clipart PDF. The topics addressed in these templates are Purchase Amount, Customers, Tracking Digital Content Performance. All the content presented in this PPT design is completely editable. Download it and make adjustments in color, background, font etc. as per your unique business setting.
Consumer Journey Mapping Techniques Online Ad Campaign Performance Tracking Dashboard Topics PDF
This slide covers the KPI dashboard for measuring digital campaign results. It includes metrics such as Ad cost, clicks, impressions, CTR, cost per click, conversions, conversion rate, cost per click, cost per thousand impressions, etc. Showcasing this set of slides titled Consumer Journey Mapping Techniques Online Ad Campaign Performance Tracking Dashboard Topics PDF. The topics addressed in these templates are Conversation Rate, Cost Per Conversion. All the content presented in this PPT design is completely editable. Download it and make adjustments in color, background, font etc. as per your unique business setting.
Consumer Journey Mapping Techniques Referral Program Performance Tracking Dashboard Formats PDF
This slide covers the KPI dashboard for analyzing referral campaign results. It includes metrics such as total revenue generated, monthly recurring revenue, new customers, clicks, cancelled customers, paying customers, etc. Showcasing this set of slides titled Consumer Journey Mapping Techniques Referral Program Performance Tracking Dashboard Formats PDF. The topics addressed in these templates are Revenue, New Customers, Paying Customers. All the content presented in this PPT design is completely editable. Download it and make adjustments in color, background, font etc. as per your unique business setting.
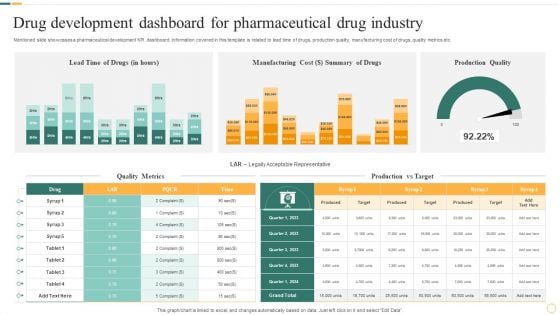
Drug Development Dashboard For Pharmaceutical Drug Industry Portrait PDF
Mentioned slide showcases a pharmaceutical development KPI dashboard. Information covered in this template is related to lead time of drugs, production quality, manufacturing cost of drugs, quality metrics etc. Showcasing this set of slides titled Drug Development Dashboard For Pharmaceutical Drug Industry Portrait PDF. The topics addressed in these templates are Manufacturing Cost, Summary Of Drugs, Production Quality. All the content presented in this PPT design is completely editable. Download it and make adjustments in color, background, font etc. as per your unique business setting.
Google Adwords Strategic Campaign Performance Tracking Dashboard Icons PDF
This slide showcases KPI dashboard for real time tracking of performance metrics for google adwords campaign. It includes elements such as cost interactions, impressions, device, etc. Showcasing this set of slides titled Google Adwords Strategic Campaign Performance Tracking Dashboard Icons PDF. The topics addressed in these templates are Campaign Performance Device, Interaction Rate Cost Device, Daily Cost Device. All the content presented in this PPT design is completely editable. Download it and make adjustments in color, background, font etc. as per your unique business setting.
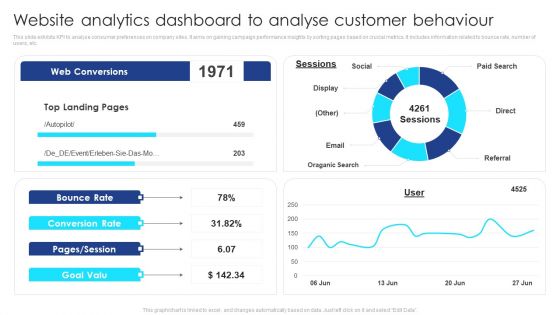
Website Analytics Dashboard To Analyse Customer Behaviour Themes PDF
This slide exhibits KPI to analyse consumer preferences on company sites. It aims on gaining campaign performance insights by sorting pages based on crucial metrics. It includes information related to bounce rate, number of users, etc. Showcasing this set of slides titled Website Analytics Dashboard To Analyse Customer Behaviour Themes PDF. The topics addressed in these templates are Social, Paid Search, Referral, Email, Oraganic Search. All the content presented in this PPT design is completely editable. Download it and make adjustments in color, background, font etc. as per your unique business setting.
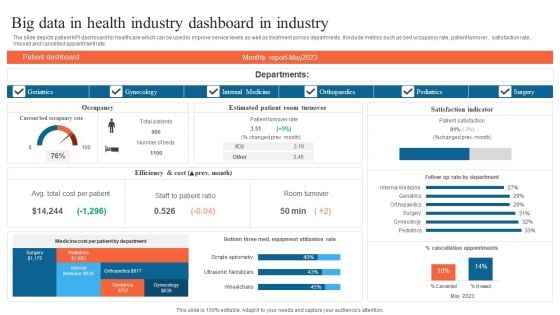
Big Data In Health Industry Dashboard In Industry Summary PDF
The slide depicts patient KPI dashboard for healthcare which can be used to improve service levels as well as treatment across departments. It include metrics such as bed occupancy rate, patient turnover, satisfaction rate, missed and cancelled appointment rate. Showcasing this set of slides titled Big Data In Health Industry Dashboard In Industry Summary PDF. The topics addressed in these templates are Geriatrics, Gynecology, Internal Medicine. All the content presented in this PPT design is completely editable. Download it and make adjustments in color, background, font etc. as per your unique business setting.
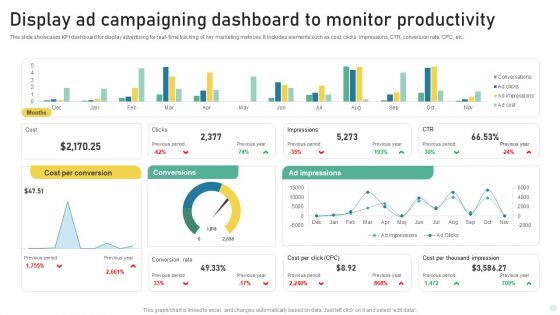
Display Ad Campaigning Dashboard To Monitor Productivity Infographics PDF
This slide showcases KPI dashboard for display advertising for real- time tracking of key marketing metrices, It includes elements such as cost, clicks, impressions, CTR, conversion rate, CPC, etc. Showcasing this set of slides titled Display Ad Campaigning Dashboard To Monitor Productivity Infographics PDF. The topics addressed in these templates are Cost Per Conversion, Conversions, Ad Impressions. All the content presented in this PPT design is completely editable. Download it and make adjustments in color, background, font etc. as per your unique business setting.
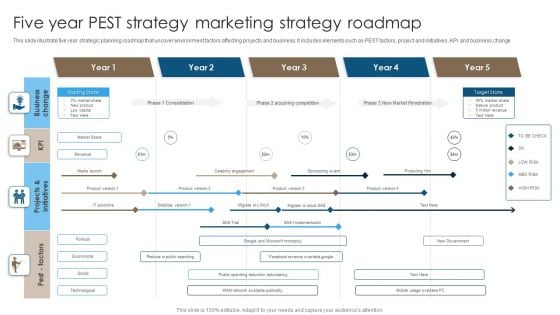
Five Year PEST Strategy Marketing Strategy Roadmap Structure PDF
This slide illustrate five year strategic planning roadmap that uncover environment factors affecting projects and business. It includes elements such as PEST factors, project and initiatives, KPI and business change. Pitch your topic with ease and precision using this Five Year PEST Strategy Marketing Strategy Roadmap Structure PDF. This layout presents information on Acquiring Competition, New Market Penetration, Consolidation. It is also available for immediate download and adjustment. So, changes can be made in the color, design, graphics or any other component to create a unique layout.
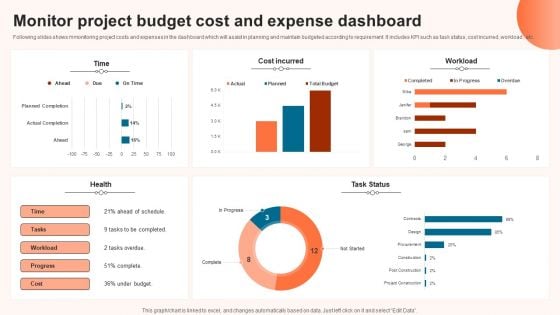
Monitor Project Budget Cost And Expense Dashboard Brochure PDF
Following slides shows mmonitoring project costs and expenses in the dashboard which will assist in planning and maintain budgeted according to requirement. It includes KPI such as task status, cost incurred ,workload , etc. Pitch your topic with ease and precision using this Monitor Project Budget Cost And Expense Dashboard Brochure PDF. This layout presents information on Expense Dashboard, Monitor Project Budget Cost. It is also available for immediate download and adjustment. So, changes can be made in the color, design, graphics or any other component to create a unique layout.
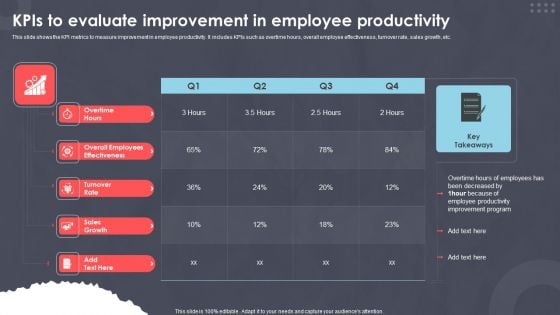
Kpis To Evaluate Improvement In Employee Productivity Ppt PowerPoint Presentation Ideas Styles PDF
This slide shows the KPI metrics to measure improvement in employee productivity. It includes KPIs such as overtime hours, overall employee effectiveness, turnover rate, sales growth, etc.Pitch your topic with ease and precision using this Kpis To Evaluate Improvement In Employee Productivity Ppt PowerPoint Presentation Ideas Styles PDF. This layout presents information on Been Decreased, Employee Productivity, Improvement Program. It is also available for immediate download and adjustment. So, changes can be made in the color, design, graphics or any other component to create a unique layout.
Consumer Journey Mapping Techniques Dashboard For Tracking Customer Service Team Performance Summary PDF
This slide covers the KPI dashboard for analyzing the performance of client support department. It includes metrics such as first call resolution, unresolved calls, average response rate, the best day to call, average time to solve issues, etc. Pitch your topic with ease and precision using this Consumer Journey Mapping Techniques Dashboard For Tracking Customer Service Team Performance Summary PDF. This layout presents information on Dashboard For Tracking Customer, Service Team Performance. It is also available for immediate download and adjustment. So, changes can be made in the color, design, graphics or any other component to create a unique layout.
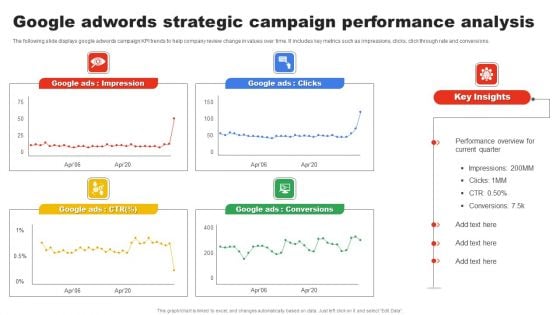
Google Adwords Strategic Campaign Performance Analysis Download PDF
The following slide displays google adwords campaign KPI trends to help company review change in values over time. It includes key metrics such as impressions, clicks, click through rate and conversions. Pitch your topic with ease and precision using this Google Adwords Strategic Campaign Performance Analysis Download PDF. This layout presents information on Google Ads Impression, Google Ads Clicks, Google Ads Conversions. It is also available for immediate download and adjustment. So, changes can be made in the color, design, graphics or any other component to create a unique layout.
Ultimate Guide To Improve Customer Support And Services Dashboard For Tracking Aftersales Customer Sample PDF
This slide covers the KPI dashboard for ticket tracking. It includes metrics such as tickets by month, service level, and details of customer service department agents. If your project calls for a presentation, then Slidegeeks is your go to partner because we have professionally designed, easy to edit templates that are perfect for any presentation. After downloading, you can easily edit Ultimate Guide To Improve Customer Support And Services Dashboard For Tracking Aftersales Customer Sample PDF and make the changes accordingly. You can rearrange slides or fill them with different images. Check out all the handy templates
Dashboard For Tracking Digital Media Outreach Strategy Formats PDF
This slide highlights the KPI dashboard to track progress for digital media and PR relations. The purpose of this slide is to help the manager track the success of digital media and PR strategies employed for increasing brand awareness. Showcasing this set of slides titled Dashboard For Tracking Digital Media Outreach Strategy Formats PDF. The topics addressed in these templates are Social Media Posts, Press Releases Issued, Blogs Published . All the content presented in this PPT design is completely editable. Download it and make adjustments in color, background, font etc. as per your unique business setting.
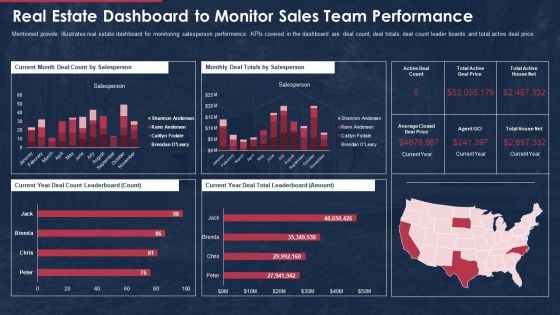
Building Promotional Campaign Real Estate Sales Real Estate Dashboard To Monitor Sales Team Performance Guidelines PDF
This slide portrays property management dashboard with KPIs namely, average days on market, properties for sale, properties for rent, sales vs. target and sales by region. Deliver and pitch your topic in the best possible manner with this building promotional campaign real estate sales real estate dashboard to monitor sales team performance guidelines pdf. Use them to share invaluable insights on property management kpi dashboard and impress your audience. This template can be altered and modified as per your expectations. So, grab it now.
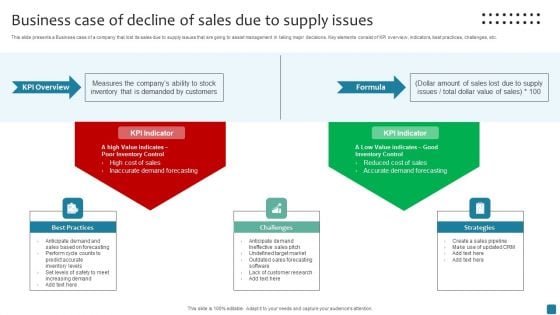
Business Case Of Decline Of Sales Due To Supply Issues Background PDF
This slide presents a Business case of a company that lost its sales due to supply issues that are going to assist management in taking major decisions. Key elements consist of KPI overview, indicators, best practices, challenges, etc. Presenting Business Case Of Decline Of Sales Due To Supply Issues Background PDF to dispense important information. This template comprises three stages. It also presents valuable insights into the topics including Best Practices, Challenges, Strategies. This is a completely customizable PowerPoint theme that can be put to use immediately. So, download it and address the topic impactfully.


 Continue with Email

 Home
Home


