Executive Kpi
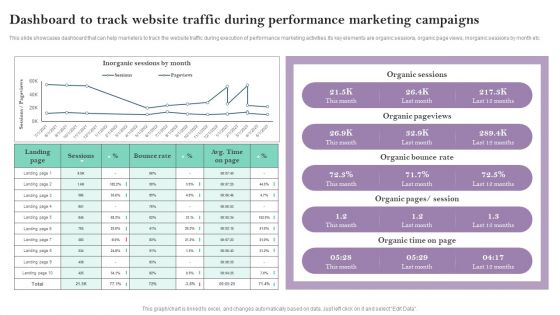
Dashboard To Track Website Traffic During Performance Marketing Campaigns Ppt PowerPoint Presentation File Example File PDF
This slide showcases dashboard that can help marketers to track the website traffic during execution of performance marketing activities.Its key elements are organic sessions, organic page views, inorganic sessions by month etc This modern and well arranged Dashboard To Track Website Traffic During Performance Marketing Campaigns Ppt PowerPoint Presentation File Example File PDF provides lots of creative possibilities. It is very simple to customize and edit with the Powerpoint Software. Just drag and drop your pictures into the shapes. All facets of this template can be edited with Powerpoint no extra software is necessary. Add your own material, put your images in the places assigned for them, adjust the colors, and then you can show your slides to the world, with an animated slide included.
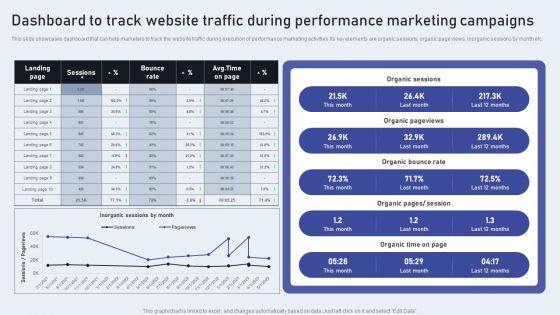
Dashboard To Track Website Traffic During Performance Marketing Campaigns Topics PDF
This slide showcases dashboard that can help marketers to track the website traffic during execution of performance marketing activities.Its key elements are organic sessions, organic page views, inorganic sessions by month etc. Slidegeeks has constructed Dashboard To Track Website Traffic During Performance Marketing Campaigns Topics PDF after conducting extensive research and examination. These presentation templates are constantly being generated and modified based on user preferences and critiques from editors. Here, you will find the most attractive templates for a range of purposes while taking into account ratings and remarks from users regarding the content. This is an excellent jumping-off point to explore our content and will give new users an insight into our top-notch PowerPoint Templates.
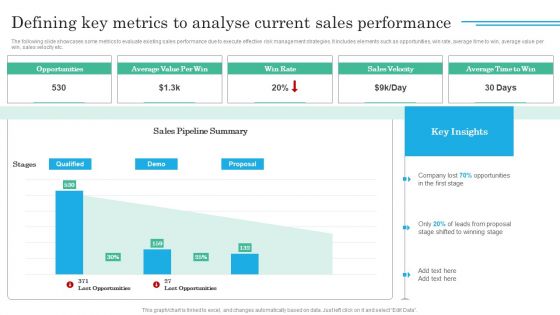
Implementing Sales Volatility Management Techniques Defining Key Metrics To Analyse Current Sales Ideas PDF
The following slide showcases some metrics to evaluate existing sales performance due to execute effective risk management strategies. It includes elements such as opportunities, win rate, average time to win, average value per win, sales velocity etc. Want to ace your presentation in front of a live audience Our Implementing Sales Volatility Management Techniques Defining Key Metrics To Analyse Current Sales Ideas PDF can help you do that by engaging all the users towards you. Slidegeeks experts have put their efforts and expertise into creating these impeccable powerpoint presentations so that you can communicate your ideas clearly. Moreover, all the templates are customizable, and easy to edit and downloadable. Use these for both personal and commercial use.
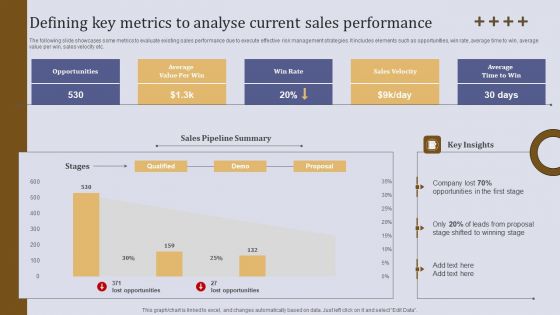
Defining Key Metrics To Analyse Current Sales Performance Ppt Infographics Ideas PDF
The following slide showcases some metrics to evaluate existing sales performance due to execute effective risk management strategies. It includes elements such as opportunities, win rate, average time to win, average value per win, sales velocity etc. Welcome to our selection of the Defining Key Metrics To Analyse Current Sales Performance Ppt Infographics Ideas PDF. These are designed to help you showcase your creativity and bring your sphere to life. Planning and Innovation are essential for any business that is just starting out. This collection contains the designs that you need for your everyday presentations. All of our PowerPoints are 100 percent editable, so you can customize them to suit your needs. This multi purpose template can be used in various situations. Grab these presentation templates today.
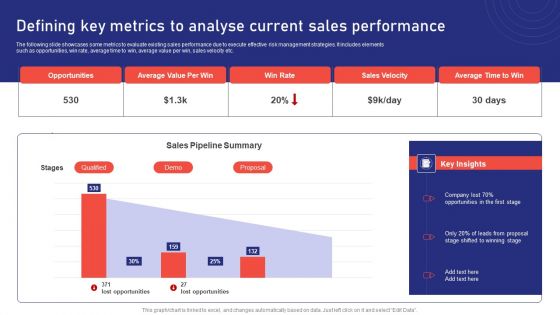
Sales Risk Assessment For Profit Maximization Defining Key Metrics To Analyse Current Sales Performance Pictures PDF
The following slide showcases some metrics to evaluate existing sales performance due to execute effective risk management strategies. It includes elements such as opportunities, win rate, average time to win, average value per win, sales velocity etc. Want to ace your presentation in front of a live audience Our Sales Risk Assessment For Profit Maximization Defining Key Metrics To Analyse Current Sales Performance Pictures PDF can help you do that by engaging all the users towards you. Slidegeeks experts have put their efforts and expertise into creating these impeccable powerpoint presentations so that you can communicate your ideas clearly. Moreover, all the templates are customizable, and easy to edit and downloadable. Use these for both personal and commercial use.
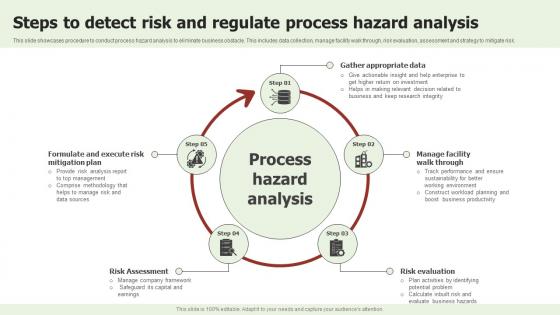
Steps To Detect Risk And Regulate Process Hazard Analysis Introduction Pdf
This slide showcases procedure to conduct process hazard analysis to eliminate business obstacle. This includes data collection, manage facility walk through, risk evaluation, assessment and strategy to mitigate risk. Pitch your topic with ease and precision using this Steps To Detect Risk And Regulate Process Hazard Analysis Introduction Pdf. This layout presents information on Execute Risk, Risk Assessment, Risk Evaluation. It is also available for immediate download and adjustment. So, changes can be made in the color, design, graphics or any other component to create a unique layout. This slide showcases procedure to conduct process hazard analysis to eliminate business obstacle. This includes data collection, manage facility walk through, risk evaluation, assessment and strategy to mitigate risk.
Acquiring Clients Through Search Engine And Native Ads Dashboard To Track Website Traffic During Performance Icons PDF
This slide showcases dashboard that can help marketers to track the website traffic during execution of performance marketing activities. Its key elements are organic sessions, organic page views, inorganic sessions by month etc. Slidegeeks is here to make your presentations a breeze with Acquiring Clients Through Search Engine And Native Ads Dashboard To Track Website Traffic During Performance Icons PDF With our easy to use and customizable templates, you can focus on delivering your ideas rather than worrying about formatting. With a variety of designs to choose from, you are sure to find one that suits your needs. And with animations and unique photos, illustrations, and fonts, you can make your presentation pop. So whether you are giving a sales pitch or presenting to the board, make sure to check out Slidegeeks first.
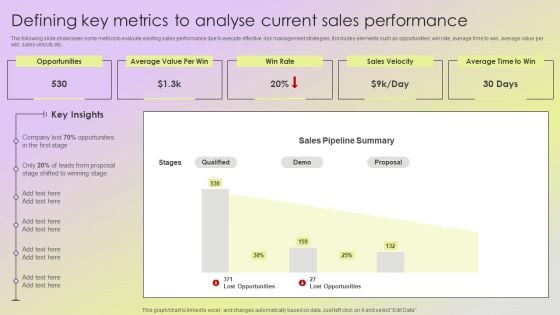
Mitigating Sales Risks With Strategic Action Planning Defining Key Metrics To Analyse Current Sales Performance Slides PDF
The following slide showcases some metrics to evaluate existing sales performance due to execute effective risk management strategies. It includes elements such as opportunities, win rate, average time to win, average value per win, sales velocity etc. This modern and well arranged Mitigating Sales Risks With Strategic Action Planning Defining Key Metrics To Analyse Current Sales Performance Slides PDF provides lots of creative possibilities. It is very simple to customize and edit with the Powerpoint Software. Just drag and drop your pictures into the shapes. All facets of this template can be edited with Powerpoint no extra software is necessary. Add your own material, put your images in the places assigned for them, adjust the colors, and then you can show your slides to the world, with an animated slide included.
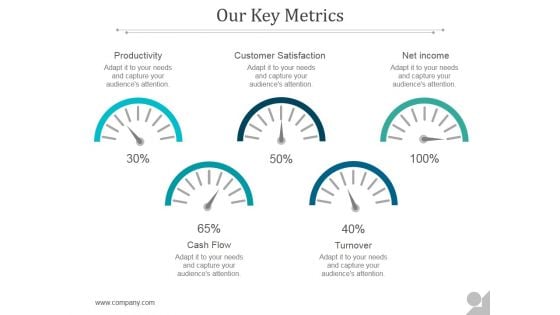
Our Key Metrics Ppt PowerPoint Presentation Examples
This is a our key metrics ppt powerpoint presentation examples. This is a five stage process. The stages in this process are productivity, customer satisfaction, net income, cash flow, turnover.
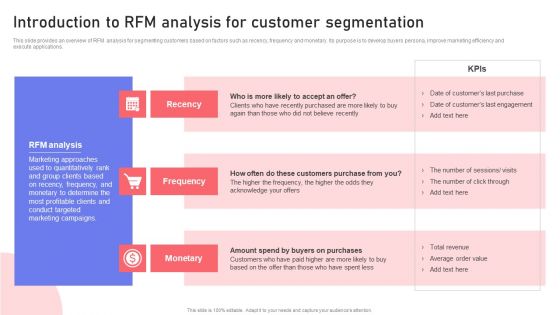
Introduction To RFM Analysis For Customer Segmentation Ppt PowerPoint Presentation File Show PDF
This slide provides an overview of RFM analysis for segmenting customers based on factors such as recency, frequency and monetary. Its purpose is to develop buyers persona, improve marketing efficiency and execute applications. The Introduction To RFM Analysis For Customer Segmentation Ppt PowerPoint Presentation File Show PDF is a compilation of the most recent design trends as a series of slides. It is suitable for any subject or industry presentation, containing attractive visuals and photo spots for businesses to clearly express their messages. This template contains a variety of slides for the user to input data, such as structures to contrast two elements, bullet points, and slides for written information. Slidegeeks is prepared to create an impression.
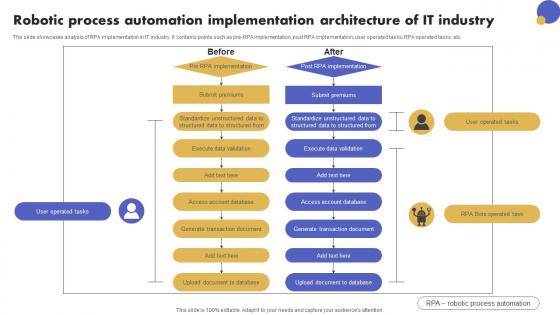
Robotic Process Automation Implementation Architecture Of It Industry Rules Pdf
The slide showcases analysis of RPA implementation in IT industry. It contains points such as pre RPA implementation, post RPA implementation, user operated tasks, RPA operated tasks, etc.Pitch your topic with ease and precision using this Robotic Process Automation Implementation Architecture Of It Industry Rules Pdf This layout presents information on Execute Data Validation, Submit Premiums, Document Database It is also available for immediate download and adjustment. So, changes can be made in the color, design, graphics or any other component to create a unique layout. The slide showcases analysis of RPA implementation in IT industry. It contains points such as pre RPA implementation, post RPA implementation, user operated tasks, RPA operated tasks, etc.

Mitigating Sales Risks With Strategic Action Planning Assessing Impact Of Sales Risk Management Diagrams PDF
The following slide highlights some key performance indicators KPIs to measure the influence of executing sales risk management strategies on revenue performance. It includes elements such as target attainment rate, gross profit, annual growth rate etc. If you are looking for a format to display your unique thoughts, then the professionally designed Mitigating Sales Risks With Strategic Action Planning Assessing Impact Of Sales Risk Management Diagrams PDF is the one for you. You can use it as a Google Slides template or a PowerPoint template. Incorporate impressive visuals, symbols, images, and other charts. Modify or reorganize the text boxes as you desire. Experiment with shade schemes and font pairings. Alter, share or cooperate with other people on your work. Download Mitigating Sales Risks With Strategic Action Planning Assessing Impact Of Sales Risk Management Diagrams PDF and find out how to give a successful presentation. Present a perfect display to your team and make your presentation unforgettable.
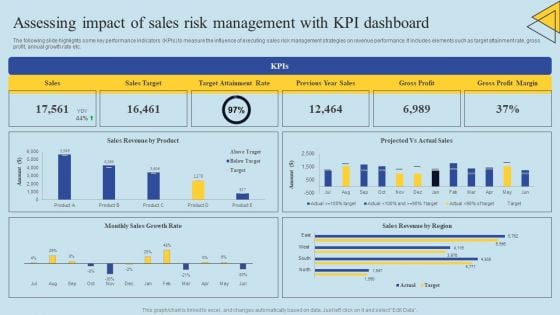
Determining Risks In Sales Administration Procedure Assessing Impact Of Sales Risk Management Sample PDF
The following slide highlights some key performance indicators KPIs to measure the influence of executing sales risk management strategies on revenue performance. It includes elements such as target attainment rate, gross profit, annual growth rate etc. If you are looking for a format to display your unique thoughts, then the professionally designed Determining Risks In Sales Administration Procedure Assessing Impact Of Sales Risk Management Sample PDF is the one for you. You can use it as a Google Slides template or a PowerPoint template. Incorporate impressive visuals, symbols, images, and other charts. Modify or reorganize the text boxes as you desire. Experiment with shade schemes and font pairings. Alter, share or cooperate with other people on your work. Download Determining Risks In Sales Administration Procedure Assessing Impact Of Sales Risk Management Sample PDF and find out how to give a successful presentation. Present a perfect display to your team and make your presentation unforgettable.
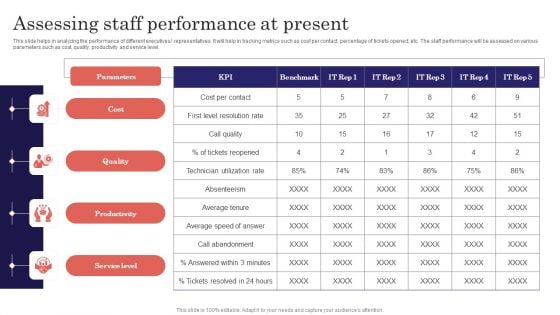
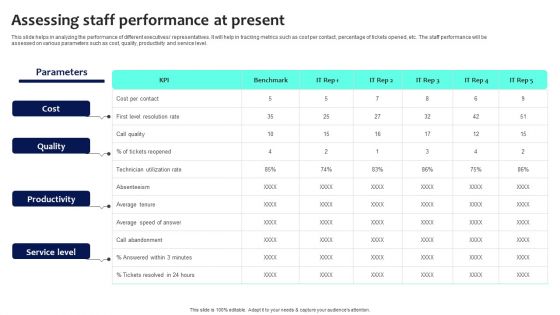
Digitalized Business Checklist Assessing Staff Performance At Present Demonstration PDF
This slide helps in analyzing the performance of different executives or representatives. It will help in tracking metrics such as cost per contact, percentage of tickets opened, etc. The staff performance will be assessed on various parameters such as cost, quality, productivity and service level. Are you in need of a template that can accommodate all of your creative concepts This one is crafted professionally and can be altered to fit any style. Use it with Google Slides or PowerPoint. Include striking photographs, symbols, depictions, and other visuals. Fill, move around, or remove text boxes as desired. Test out color palettes and font mixtures. Edit and save your work, or work with colleagues. Download Digitalized Business Checklist Assessing Staff Performance At Present Demonstration PDF and observe how to make your presentation outstanding. Give an impeccable presentation to your group and make your presentation unforgettable.
Digital Transformation Checklist To Accelerate Innovation In Business Assessing Staff Performance At Present Download PDF
This slide helps in analyzing the performance of different executives representatives. It will help in tracking metrics such as cost per contact, percentage of tickets opened, etc. The staff performance will be assessed on various parameters such as cost, quality, productivity and service level. Are you in need of a template that can accommodate all of your creative concepts This one is crafted professionally and can be altered to fit any style. Use it with Google Slides or PowerPoint. Include striking photographs, symbols, depictions, and other visuals. Fill, move around, or remove text boxes as desired. Test out color palettes and font mixtures. Edit and save your work, or work with colleagues. Download Digital Transformation Checklist To Accelerate Innovation In Business Assessing Staff Performance At Present Download PDF and observe how to make your presentation outstanding. Give an impeccable presentation to your group and make your presentation unforgettable.
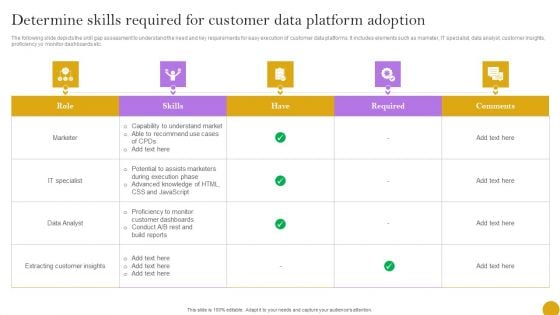
Comprehensive Customer Data Platform Guide Optimizing Promotional Initiatives Determine Skills Required For Customer Introduction PDF
The following slide depicts the skill gap assessment to understand the need and key requirements for easy execution of customer data platforms. It includes elements such as marketer, IT specialist, data analyst, customer insights, proficiency yo monitor dashboards etc. This Comprehensive Customer Data Platform Guide Optimizing Promotional Initiatives Determine Skills Required For Customer Introduction PDF from Slidegeeks makes it easy to present information on your topic with precision. It provides customization options, so you can make changes to the colors, design, graphics, or any other component to create a unique layout. It is also available for immediate download, so you can begin using it right away. Slidegeeks has done good research to ensure that you have everything you need to make your presentation stand out. Make a name out there for a brilliant performance.
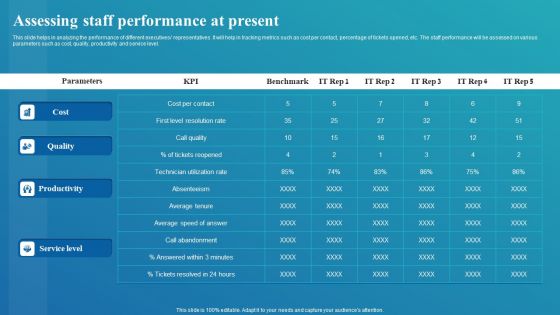
Framework For Digital Transformation And Modernization Assessing Staff Performance At Present Download PDF
This slide helps in analyzing the performance of different executives representatives. It will help in tracking metrics such as cost per contact, percentage of tickets opened, etc. The staff performance will be assessed on various parameters such as cost, quality, productivity and service level. This Framework For Digital Transformation And Modernization Assessing Staff Performance At Present Download PDF from Slidegeeks makes it easy to present information on your topic with precision. It provides customization options, so you can make changes to the colors, design, graphics, or any other component to create a unique layout. It is also available for immediate download, so you can begin using it right away. Slidegeeks has done good research to ensure that you have everything you need to make your presentation stand out. Make a name out there for a brilliant performance.

Digitization Framework For Technology Advancement Assessing Staff Performance At Present Inspiration PDF
This slide helps in analyzing the performance of different executives or representatives. It will help in tracking metrics such as cost per contact, percentage of tickets opened, etc. The staff performance will be assessed on various parameters such as cost, quality, productivity and service level. Here you can discover an assortment of the finest PowerPoint and Google Slides templates. With these templates, you can create presentations for a variety of purposes while simultaneously providing your audience with an eye catching visual experience. Download Digitization Framework For Technology Advancement Assessing Staff Performance At Present Inspiration PDF to deliver an impeccable presentation. These templates will make your job of preparing presentations much quicker, yet still, maintain a high level of quality. Slidegeeks has experienced researchers who prepare these templates and write high quality content for you. Later on, you can personalize the content by editing the Digitization Framework For Technology Advancement Assessing Staff Performance At Present Inspiration PDF.
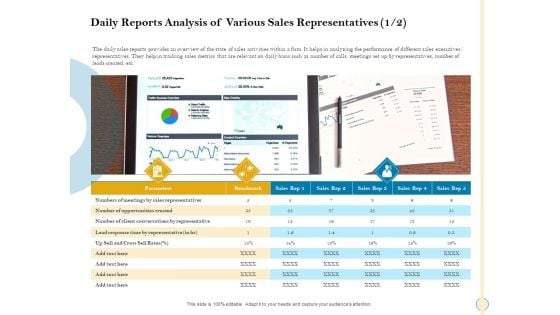
Sales Optimization Best Practices To Close More Deals Daily Reports Analysis Of Various Sales Representatives Client Professional PDF
The daily sales reports provides an overview of the state of sales activities within a firm. It helps in analyzing the performance of different sales executives or representatives. They help in tracking sales metrics that are relevant on daily basis such as number of calls, meetings set up by representatives, number of leads created, etc. This is a sales optimization best practices to close more deals daily reports analysis of various sales representatives client professional pdf template with various stages. Focus and dispense information on three stages using this creative set, that comes with editable features. It contains large content boxes to add your information on topics like cross sell rates, opportunities, sales, representatives, parameters. You can also showcase facts, figures, and other relevant content using this PPT layout. Grab it now.
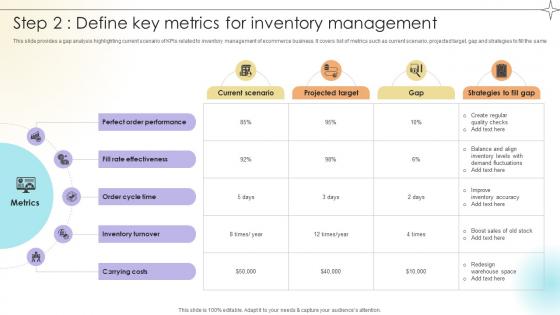
Step 2 Define Key Metrics For Inventory Management Data Analytics SS V
This slide provides a gap analysis highlighting current scenario of KPIs related to inventory management of ecommerce business. It covers list of metrics such as current scenario, projected target, gap and strategies to fill the same.Make sure to capture your audiences attention in your business displays with our gratis customizable Step 2 Define Key Metrics For Inventory Management Data Analytics SS V. These are great for business strategies, office conferences, capital raising or task suggestions. If you desire to acquire more customers for your tech business and ensure they stay satisfied, create your own sales presentation with these plain slides. This slide provides a gap analysis highlighting current scenario of KPIs related to inventory management of ecommerce business. It covers list of metrics such as current scenario, projected target, gap and strategies to fill the same.
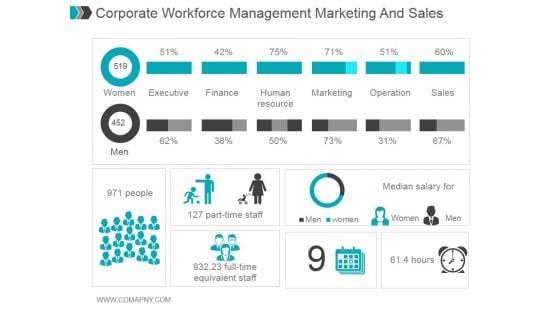
Corporate Workforce Management Marketing And Sales Ppt PowerPoint Presentation Information
This is a corporate workforce management marketing and sales ppt powerpoint presentation information. This is a two stage process. The stages in this process are women, executive, finance, human resource, marketing, operation, sales, median salary for, people, part time staff, full time equivalent staff.
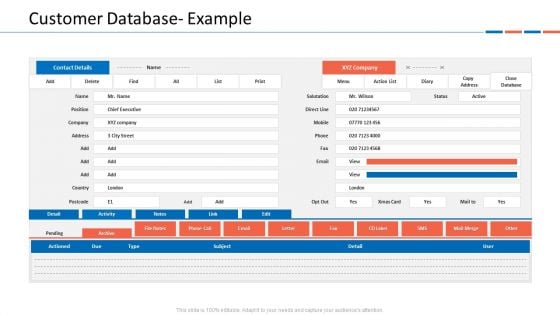
Customer Relationship Management Dashboard Customer Database- Example Themes PDF
Deliver an awe inspiring pitch with this creative customer relationship management dashboard customer database- example themes pdf bundle. Topics like salutation, chief executive, close database, direct line, postcode can be discussed with this completely editable template. It is available for immediate download depending on the needs and requirements of the user.
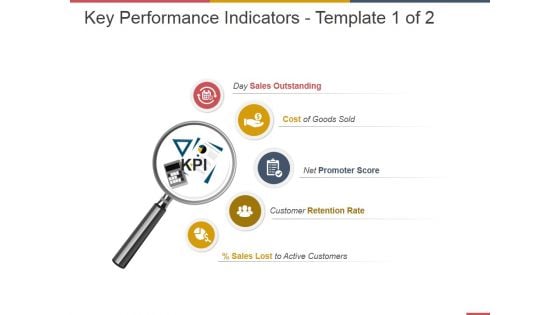
Key Performance Indicators Template 1 Ppt PowerPoint Presentation Portfolio
This is a key performance indicators template 1 ppt powerpoint presentation portfolio. This is a five stage process. The stages in this process are sales outstanding, cost of goods sold, promoter score, retention rate, active customers.
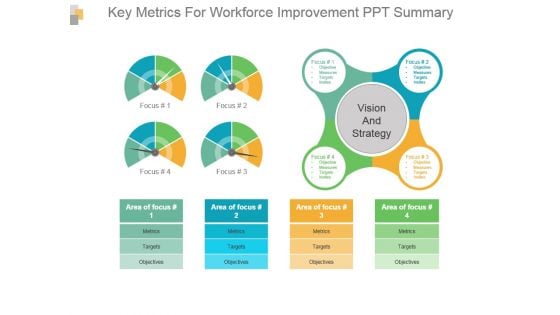
Key Metrics For Workforce Improvement Ppt Summary
This is a key metrics for workforce improvement ppt summary. This is a four stage process. The stages in this process are vision and strategy, metrics, targets, objectives, area of focus.
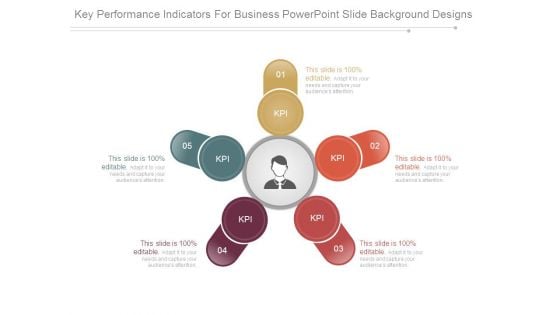
Key Performance Indicators For Business Powerpoint Slide Background Designs
This is a key performance indicators for business powerpoint slide background designs. This is a five stage process. The stages in this process are kpi.
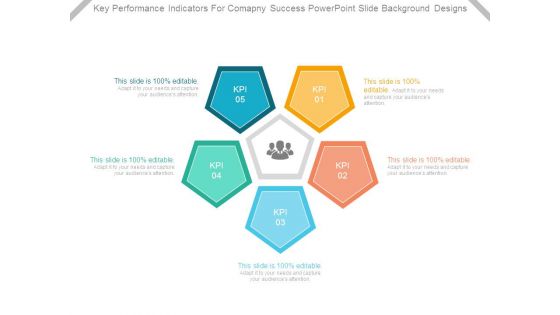
Key Performance Indicators For Company Success Powerpoint Slide Background Designs
This is a key performance indicators for company success powerpoint slide background designs. This is a five stage process. The stages in this process are kpi.
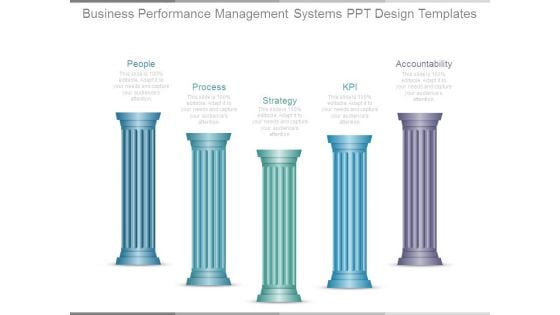
Business Performance Management Systems Ppt Design Templates
This is a business performance management systems ppt design templates. This is a five stage process. The stages in this process are people, process, strategy, kpi, accountability.

Business Analysis Data Charts And Reports Ppt Powerpoint Presentation Ideas Portrait
This is a business analysis data charts and reports ppt powerpoint presentation ideas portrait. This is a three stage process. The stages in this process are business metrics, business kpi, business dashboard.
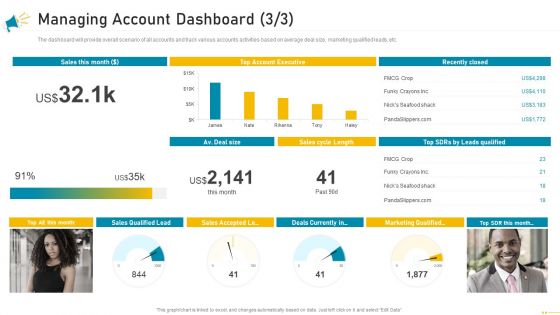
Key Account Marketing Approach Managing Account Dashboard Sales Designs PDF
The dashboard will provide overall scenario of all accounts and track various accounts activities based on average deal size, marketing qualified leads, etc. Deliver and pitch your topic in the best possible manner with this key account marketing approach managing account dashboard sales designs pdf. Use them to share invaluable insights on sales, account executive, marketing and impress your audience. This template can be altered and modified as per your expectations. So, grab it now.
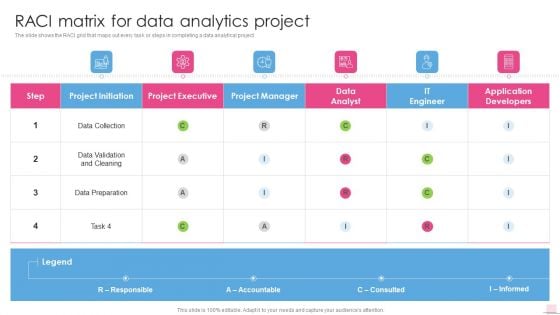
Raci Matrix For Data Analytics Project Business Analysis Modification Toolkit Template PDF
The slide shows the RACI grid that maps out every task or steps in completing a data analytical project.Deliver an awe inspiring pitch with this creative Raci Matrix For Data Analytics Project Business Analysis Modification Toolkit Template PDF bundle. Topics like Project Executive, Project Manager, Data Preparation can be discussed with this completely editable template. It is available for immediate download depending on the needs and requirements of the user.
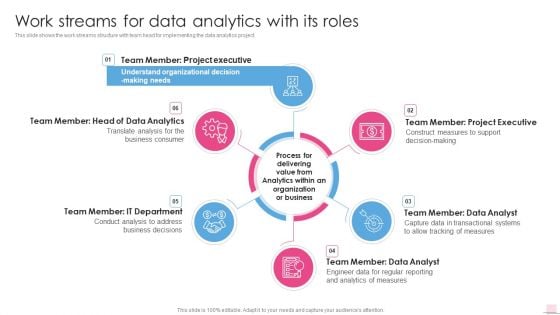
Work Streams For Data Analytics With Its Roles Business Analysis Modification Toolkit Topics PDF
Presenting Work Streams For Data Analytics With Its Roles Business Analysis Modification Toolkit Topics PDF to provide visual cues and insights. Share and navigate important information on six stages that need your due attention. This template can be used to pitch topics like Project Executive, Data Analytics, Organization Business. In addtion, this PPT design contains high resolution images, graphics, etc, that are easily editable and available for immediate download.
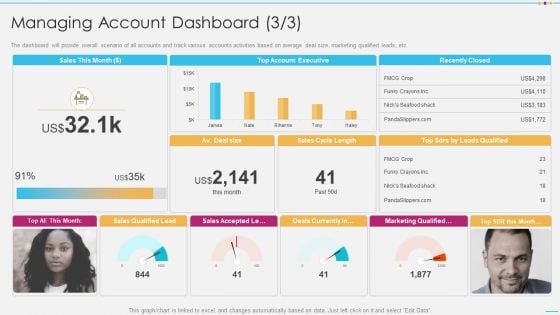
Strategic Account Management By Selling And Advertisement Managing Account Dashboard Summary PDF
The dashboard will provide overall scenario of all accounts and track various accounts activities based on average deal size, marketing qualified leads, etc. Deliver and pitch your topic in the best possible manner with this strategic account management by selling and advertisement managing account dashboard summary pdf. Use them to share invaluable insights on account executive, sales and impress your audience. This template can be altered and modified as per your expectations. So, grab it now.
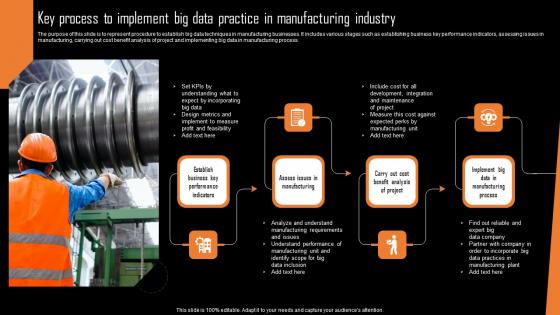
Key Process To Implement Big Data Practice In Manufacturing Industry Diagrams Pdf
The purpose of this slide is to represent procedure to establish big data techniques in manufacturing businesses. It includes various stages such as establishing business key performance indicators, assessing issues in manufacturing, carrying out cost benefit analysis of project and implementing big data in manufacturing process.Showcasing this set of slides titled Key Process To Implement Big Data Practice In Manufacturing Industry Diagrams Pdf The topics addressed in these templates are Expect Incorporating, Understand Performance, Manufacturing Plant All the content presented in this PPT design is completely editable. Download it and make adjustments in color, background, font etc. as per your unique business setting. The purpose of this slide is to represent procedure to establish big data techniques in manufacturing businesses. It includes various stages such as establishing business key performance indicators, assessing issues in manufacturing, carrying out cost benefit analysis of project and implementing big data in manufacturing process.
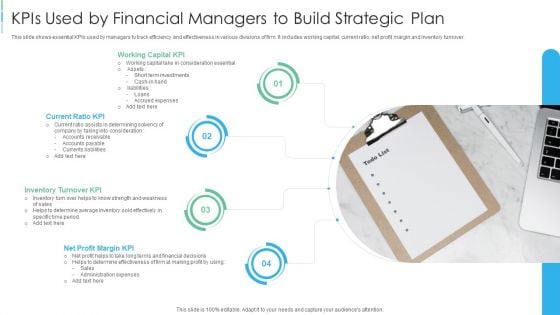
Kpis Used By Financial Managers To Build Strategic Plan Diagrams PDF
This slide shows essential KPIs used by managers to track efficiency and effectiveness in various divisions of firm. It includes working capital, current ratio, net profit margin and inventory turnover.Presenting Kpis Used By Financial Managers To Build Strategic Plan Diagrams PDF to dispense important information. This template comprises four stages. It also presents valuable insights into the topics including Working Capital KPI, Current Ratio KPI, Inventory Turnover KPI. This is a completely customizable PowerPoint theme that can be put to use immediately. So, download it and address the topic impactfully.
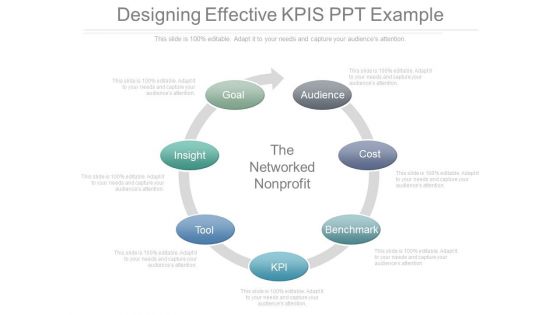
Designing Effective Kpis Ppt Example
This is a designing effective kpis ppt example. This is a seven stage process. The stages in this process are goal, audience, cost, benchmark, kpi, tool, insight, the networked nonprofit.

Financial Kpis For Business Growth Liquidity Efficiency And Solvency Ppt Powerpoint Presentation Summary Gridlines
This is a financial kpis for business growth liquidity efficiency and solvency ppt powerpoint presentation summary gridlines. This is a seven stage process. The stages in this process are dashboard, kpi, metrics.
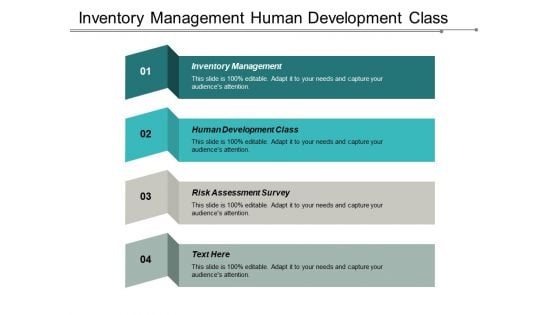
Inventory Management Human Development Class Risk Assessment Survey Ppt PowerPoint Presentation Show Designs
This is a inventory management human development class risk assessment survey ppt powerpoint presentation show designs. This is a four stage process. The stages in this process are inventory management kpi, marketing strategy research, stress management.
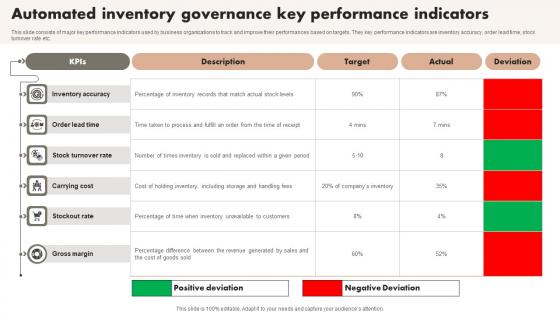
Automated Inventory Governance Key Performance Indicators Information Pdf
This slide consists of major key performance indicators used by business organizations to track and improve their performances based on targets. They key performance indicators are inventory accuracy, order lead time, stock turnover rate etc. Showcasing this set of slides titled Automated Inventory Governance Key Performance Indicators Information Pdf. The topics addressed in these templates are Description, Target, Actual. All the content presented in this PPT design is completely editable. Download it and make adjustments in color, background, font etc. as per your unique business setting. This slide consists of major key performance indicators used by business organizations to track and improve their performances based on targets. They key performance indicators are inventory accuracy, order lead time, stock turnover rate etc.
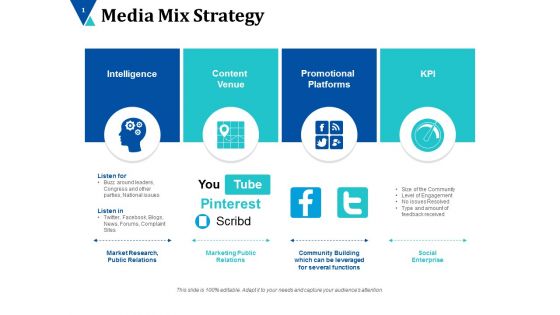
Media Mix Strategy Ppt PowerPoint Presentation Pictures Background Designs
This is a media mix strategy ppt powerpoint presentation pictures background designs. This is a four stage process. The stages in this process are intelligence, content venue, promotional , platforms, kpi, strategy.

Key Performance Indicators Template 2 Ppt PowerPoint Presentation Microsoft
This is a key performance indicators template 2 ppt powerpoint presentation microsoft. This is a four stage process. The stages in this process are business, table, marketing, strategy, data.

Bar Chart With Magnifying Glass For Financial Analysis Ppt Powerpoint Presentation Infographics Designs Download
This is a bar chart with magnifying glass for financial analysis ppt powerpoint presentation infographics designs download. This is a three stage process. The stages in this process are business metrics, business kpi, business dashboard.
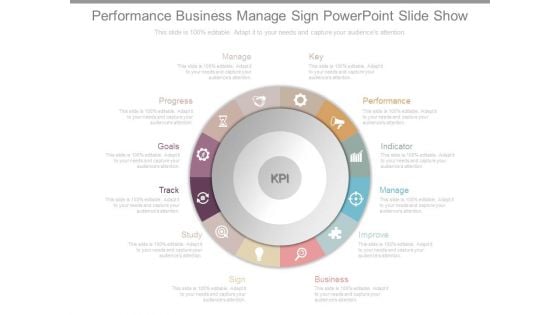
Performance Business Manage Sign Powerpoint Slide Show
This is a performance business manage sign powerpoint slide show. This is a twelve stage process. The stages in this process are key, performance, indicator, manage, improve, business, sign, study, track, goals, progress, manage, kpi.
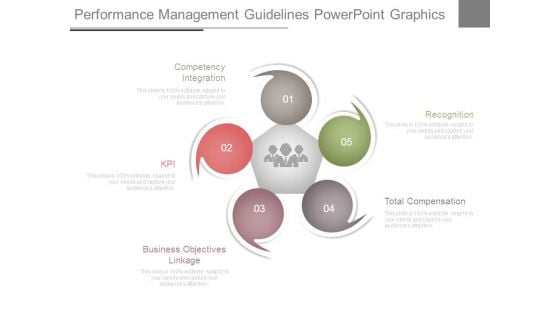
Performance Management Guidelines Powerpoint Graphics
This is a performance management guidelines powerpoint graphics. This is a five stage process. The stages in this process are competency integration, kpi, business objectives linkage, recognition, total compensation.
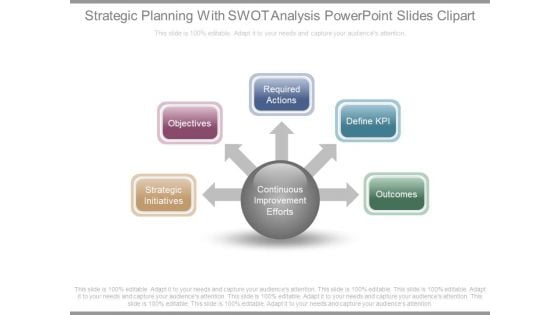
Strategic Planning With Swot Analysis Powerpoint Slides Clipart
This is a strategic planning with swot analysis powerpoint slides clipart. This is a five stage process. The stages in this process are continuous improvement efforts, strategic initiatives, objectives, required actions, define kpi, outcomes.
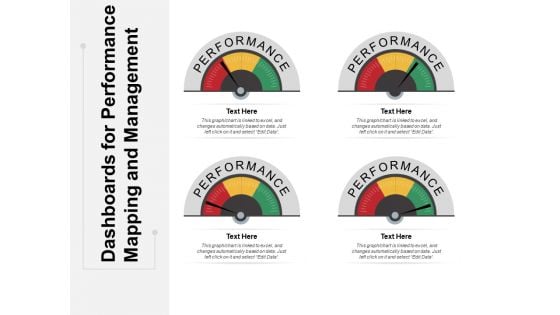
Dashboards For Performance Mapping And Management Ppt PowerPoint Presentation Ideas File Formats
This is a dashboards for performance mapping and management ppt powerpoint presentation ideas file formats. This is a four stage process. The stages in this process are performance dashboard, performance meter, performance kpi.
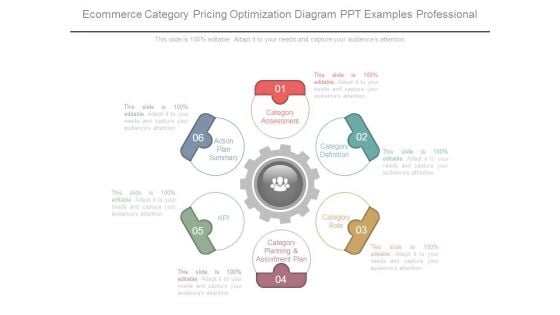
Ecommerce Category Pricing Optimization Diagram Ppt Examples Professional
This is a ecommerce category pricing optimization diagram ppt examples professional. This is a six stage process. The stages in this process are category assessment, category definition, category role, category planning and assortment plan, kpi, action plan summary.
Comparative Analysis Of Digital Security Metrics For Small Businesses Icons Pdf
Pitch your topic with ease and precision using this Comparative Analysis Of Digital Security Metrics For Small Businesses Icons Pdf This layout presents information on Futuristic Approach, Data Driven Decisions, Exposed Assets It is also available for immediate download and adjustment. So, changes can be made in the color, design, graphics or any other component to create a unique layout. This slide showcases the comparative analysis of cybersecurity KPIs for small businesses which helps an organization to carefully choose, select the best metric to track performance. It include details such as goal oriented, actionable, easy to understand, etc.
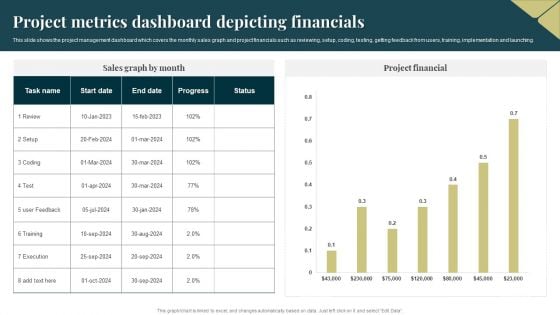
Project Metrics Dashboard Depicting Financials Pictures PDF
This slide shows the project management dashboard which covers the monthly sales graph and project financials such as reviewing, setup, coding, testing, getting feedback from users, training, implementation and launching. Pitch your topic with ease and precision using this Project Metrics Dashboard Depicting Financials Pictures PDF. This layout presents information on Execution, Project Financial. It is also available for immediate download and adjustment. So, changes can be made in the color, design, graphics or any other component to create a unique layout.
Important Kpis For Tracking Cloud Data Intelligence Sample Pdf
This slide covers the top key performance indicators KPIs for tracking data analytics. The purpose of this template is to provide an overview of the KPIs that can help assess the effectiveness, adoption, accuracy, and efficiency of data analytics initiatives. It includes stat driven targets and actionable steps. Pitch your topic with ease and precision using this Important Kpis For Tracking Cloud Data Intelligence Sample Pdf. This layout presents information on Analytics Regularly, Generate Insights, Optimize Workflows. It is also available for immediate download and adjustment. So, changes can be made in the color, design, graphics or any other component to create a unique layout. This slide covers the top key performance indicators KPIs for tracking data analytics. The purpose of this template is to provide an overview of the KPIs that can help assess the effectiveness, adoption, accuracy, and efficiency of data analytics initiatives. It includes stat driven targets and actionable steps.
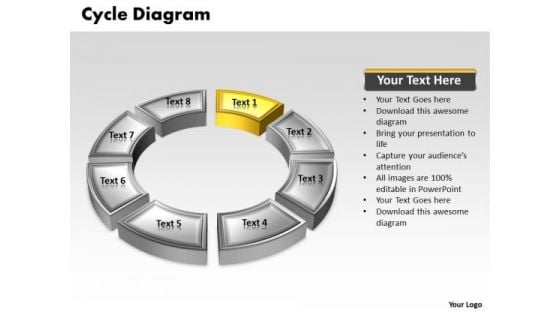
Ppt Yellow Animated Text Cycle Network Diagram PowerPoint Template Templates
PPT yellow animated text cycle network diagram powerpoint template Templates-Use this Circular diagram to show activities that are related to the business plan metrics and monitor the results to determine if the business plan is proceeding as planned.-PPT yellow animated text cycle network diagram powerpoint template Templates-Abstract, Blank, Business, Chart, Circular, Circulation, Cycle, Design, Diagram, Empty, Executive, Icon, Illustration, Management, Model, Numbers, Organization, Procedure, Process Recognize your calling with our Ppt Yellow Animated Text Cycle Network Diagram PowerPoint Template Templates. Download without worries with our money back guaranteee.

Medical Care Organization Management And Statistical Analysis Summary PDF
This slide covers the details related to the healthcare company. The purpose of this template is to define the fact sheet used in the healthcare industry. It covers information about mission, vision, key metrics, revenues, etc. Showcasing this set of slides titled Medical Care Organization Management And Statistical Analysis Summary PDF. The topics addressed in these templates are Executive, Chief Medical Officer, Management. All the content presented in this PPT design is completely editable. Download it and make adjustments in color, background, font etc. as per your unique business setting.

HR Analytics Metrics For Data Driven Decision Summary Pdf
This slide illustrates human resource key performance indicators that help organization to analyze actionable insights for taking effective and date driven decision. It includes KPIs such as recruitment, employee engagement, retention and diversity and inclusion.Pitch your topic with ease and precision using this HR Analytics Metrics For Data Driven Decision Summary Pdf This layout presents information on Estimate Accumulated, Involved Recruitment, Provide Actionable Insight It is also available for immediate download and adjustment. So, changes can be made in the color, design, graphics or any other component to create a unique layout. This slide illustrates human resource key performance indicators that help organization to analyze actionable insights for taking effective and date driven decision. It includes KPIs such as recruitment, employee engagement, retention and diversity and inclusion.
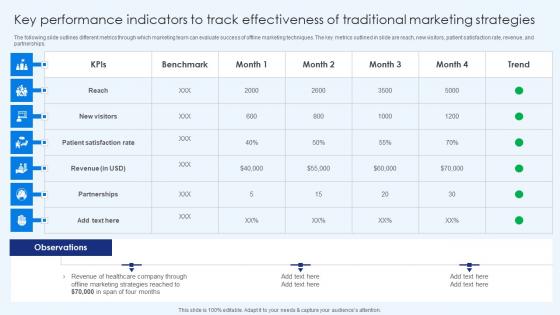
Key Performance Indicators To Track Effectivenes Healthcare Promotion Infographics Pdf
The following slide outlines different metrics through which marketing team can evaluate success of offline marketing techniques. The key metrics outlined in slide are reach, new visitors, patient satisfaction rate, revenue, and partnerships. The Key Performance Indicators To Track Effectivenes Healthcare Promotion Infographics Pdf is a compilation of the most recent design trends as a series of slides. It is suitable for any subject or industry presentation, containing attractive visuals and photo spots for businesses to clearly express their messages. This template contains a variety of slides for the user to input data, such as structures to contrast two elements, bullet points, and slides for written information. Slidegeeks is prepared to create an impression. The following slide outlines different metrics through which marketing team can evaluate success of offline marketing techniques. The key metrics outlined in slide are reach, new visitors, patient satisfaction rate, revenue, and partnerships.
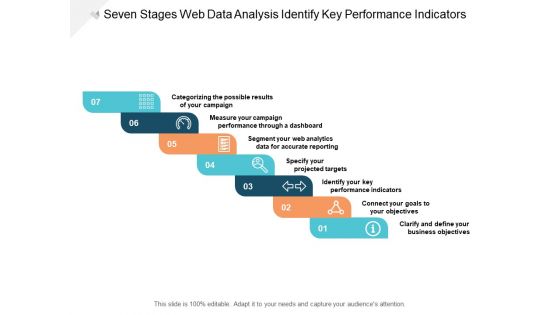
Seven Stages Web Data Analysis Identify Key Performance Indicators Ppt PowerPoint Presentation Infographics Example Topics Cpb
This is a seven stages web data analysis identify key performance indicators ppt powerpoint presentation infographics example topics cpb. This is a seven stage process. The stages in this process are data analysis, analytics architecture, analytics framework.
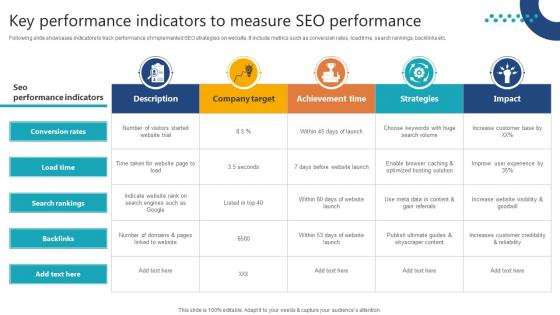
Complete Guide To Launch Key Performance Indicators To Measure SEO Performance
Following slide showcases indicators to track performance of implemented SEO strategies on website. It include metrics such as conversion rates, load time, search rankings, backlinks etc. Welcome to our selection of the Complete Guide To Launch Key Performance Indicators To Measure SEO Performance. These are designed to help you showcase your creativity and bring your sphere to life. Planning and Innovation are essential for any business that is just starting out. This collection contains the designs that you need for your everyday presentations. All of our PowerPoints are 100Percent editable, so you can customize them to suit your needs. This multi-purpose template can be used in various situations. Grab these presentation templates today. Following slide showcases indicators to track performance of implemented SEO strategies on website. It include metrics such as conversion rates, load time, search rankings, backlinks etc.
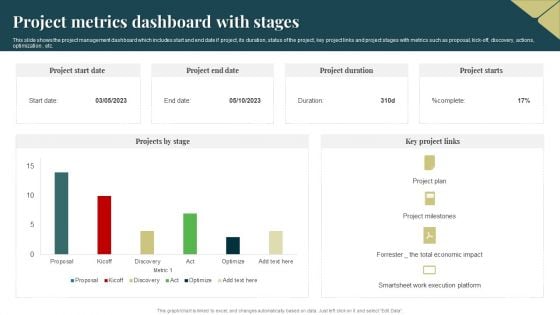
Project Metrics Dashboard With Stages Download PDF
This slide shows the project management dashboard which includes start and end date if project, its duration, status of the project, key project links and project stages with metrics such as proposal, kick off, discovery, actions, optimization , etc. Pitch your topic with ease and precision using this Project Metrics Dashboard With Stages Download PDF. This layout presents information on Economic, Project Plan, Execution. It is also available for immediate download and adjustment. So, changes can be made in the color, design, graphics or any other component to create a unique layout.
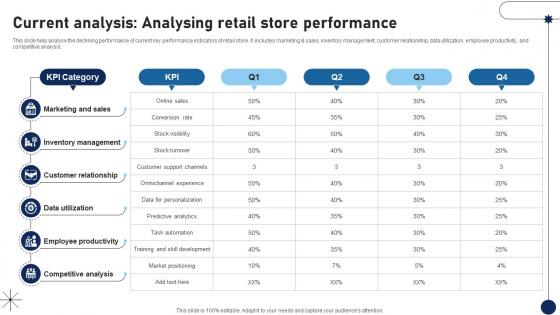
Current Analysis Analysing Retail Store Performance DT SS V
This slide help analyse the declining performance of current key performance indicators of retail store. It includes marketing and sales, inventory management, customer relationship, data utilization, employee productivity, and competitive analysis.Whether you have daily or monthly meetings, a brilliant presentation is necessary. Current Analysis Analysing Retail Store Performance DT SS V can be your best option for delivering a presentation. Represent everything in detail using Current Analysis Analysing Retail Store Performance DT SS V and make yourself stand out in meetings. The template is versatile and follows a structure that will cater to your requirements. All the templates prepared by Slidegeeks are easy to download and edit. Our research experts have taken care of the corporate themes as well. So, give it a try and see the results. This slide help analyse the declining performance of current key performance indicators of retail store. It includes marketing and sales, inventory management, customer relationship, data utilization, employee productivity, and competitive analysis.
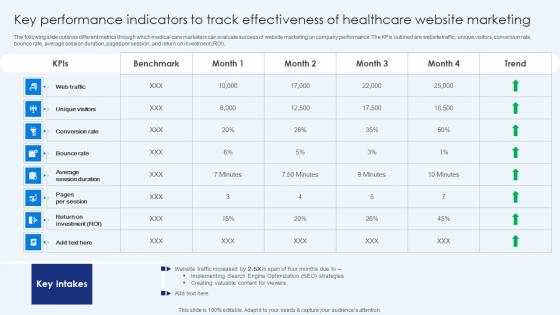
Key Performance Indicators To Track Effectiveness Healthcare Promotion Portrait Pdf
The following slide outlines different metrics through which medical care marketers can evaluate success of website marketing on company performance. The KPIs outlined are website traffic, unique visitors, conversion rate, bounce rate, average session duration, pages per session, and return on investment ROI. Are you searching for a Key Performance Indicators To Track Effectiveness Healthcare Promotion Portrait Pdf that is uncluttered, straightforward, and original Its easy to edit, and you can change the colors to suit your personal or business branding. For a presentation that expresses how much effort you have put in, this template is ideal With all of its features, including tables, diagrams, statistics, and lists, its perfect for a business plan presentation. Make your ideas more appealing with these professional slides. Download Key Performance Indicators To Track Effectiveness Healthcare Promotion Portrait Pdffrom Slidegeeks today. The following slide outlines different metrics through which medical care marketers can evaluate success of website marketing on company performance. The KPIs outlined are website traffic, unique visitors, conversion rate, bounce rate, average session duration, pages per session, and return on investment ROI.
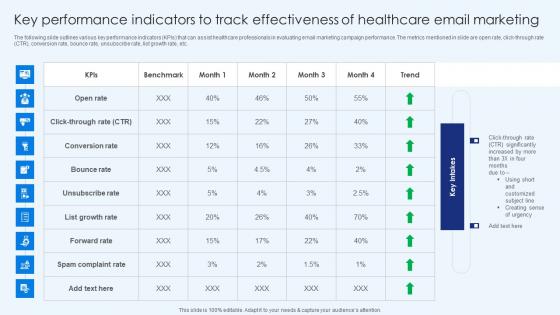
Key Performance Indicators To Track Effectiveness Of Healthcare Promotion Download Pdf
The following slide outlines various key performance indicators KPIs that can assist healthcare professionals in evaluating email marketing campaign performance. The metrics mentioned in slide are open rate, click-through rate CTR, conversion rate, bounce rate, unsubscribe rate, list growth rate, etc. Retrieve professionally designed Key Performance Indicators To Track Effectiveness Of Healthcare Promotion Download Pdf to effectively convey your message and captivate your listeners. Save time by selecting pre-made slideshows that are appropriate for various topics, from business to educational purposes. These themes come in many different styles, from creative to corporate, and all of them are easily adjustable and can be edited quickly. Access them as PowerPoint templates or as Google Slides themes. You do not have to go on a hunt for the perfect presentation because Slidegeeks got you covered from everywhere. The following slide outlines various key performance indicators KPIs that can assist healthcare professionals in evaluating email marketing campaign performance. The metrics mentioned in slide are open rate, click-through rate CTR, conversion rate, bounce rate, unsubscribe rate, list growth rate, etc.
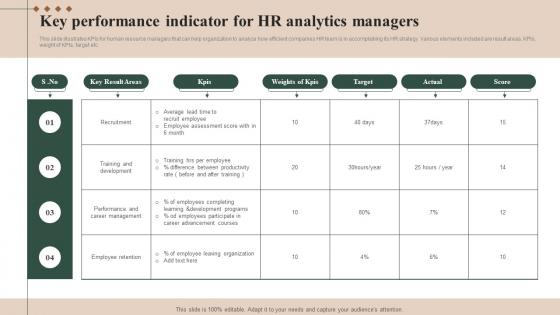
Key Performance Indicator For HR Analytics Managers Brochure Pdf
This slide illustrates KPIs for human resource managers that can help organization to analyze how efficient companies HR team is in accomplishing its HR strategy. Various elements included are result areas, KPIs, weight of KPIs, target etc.Pitch your topic with ease and precision using this Key Performance Indicator For HR Analytics Managers Brochure Pdf This layout presents information on Training Development, Career Management, Employee Retention It is also available for immediate download and adjustment. So, changes can be made in the color, design, graphics or any other component to create a unique layout. This slide illustrates KPIs for human resource managers that can help organization to analyze how efficient companies HR team is in accomplishing its HR strategy. Various elements included are result areas, KPIs, weight of KPIs, target etc.


 Continue with Email

 Home
Home


