Executive Kpi
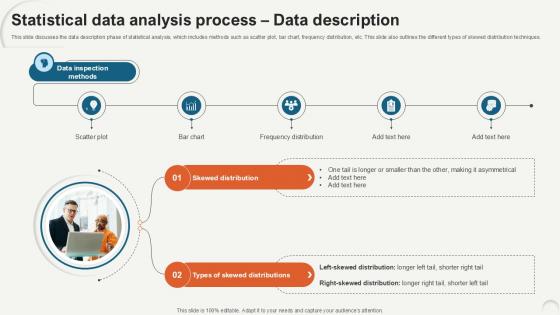
Statistical Data Analysis Process Data Description Ppt Example
This slide discusses the data description phase of statistical analysis, which includes methods such as scatter plot, bar chart, frequency distribution, etc. This slide also outlines the different types of skewed distribution techniques. Create an editable Statistical Data Analysis Process Data Description Ppt Example that communicates your idea and engages your audience. Whether you are presenting a business or an educational presentation, pre-designed presentation templates help save time. Statistical Data Analysis Process Data Description Ppt Example is highly customizable and very easy to edit, covering many different styles from creative to business presentations. Slidegeeks has creative team members who have crafted amazing templates. So, go and get them without any delay. This slide discusses the data description phase of statistical analysis, which includes methods such as scatter plot, bar chart, frequency distribution, etc. This slide also outlines the different types of skewed distribution techniques.
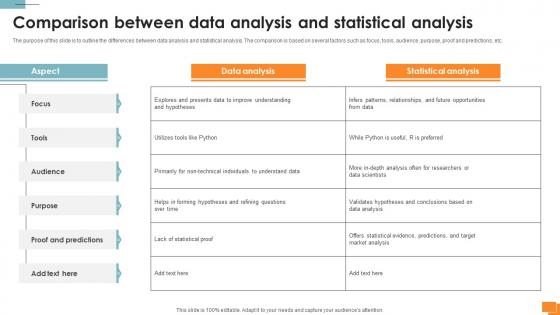
Statistical Tools For Evidence Comparison Between Data Analysis And Statistical Analysis
The purpose of this slide is to outline the differences between data analysis and statistical analysis. The comparison is based on several factors such as focus, tools, audience, purpose, proof and predictions, etc. Find highly impressive Statistical Tools For Evidence Comparison Between Data Analysis And Statistical Analysis on Slidegeeks to deliver a meaningful presentation. You can save an ample amount of time using these presentation templates. No need to worry to prepare everything from scratch because Slidegeeks experts have already done a huge research and work for you. You need to download Statistical Tools For Evidence Comparison Between Data Analysis And Statistical Analysis for your upcoming presentation. All the presentation templates are 100 percent editable and you can change the color and personalize the content accordingly. Download now The purpose of this slide is to outline the differences between data analysis and statistical analysis. The comparison is based on several factors such as focus, tools, audience, purpose, proof and predictions, etc.
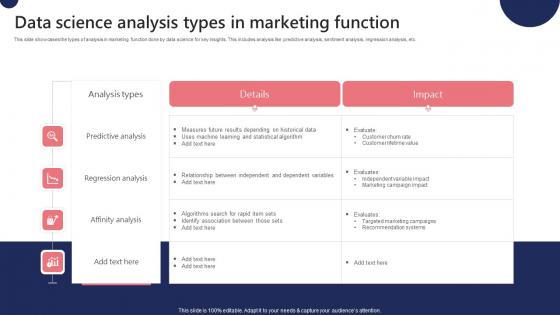
Data Science Analysis Types In Marketing Function Ppt Ideas Designs Download Pdf
This slide showcases the types of analysis in marketing function done by data science for key insights. This includes analysis like predictive analysis, sentiment analysis, regression analysis, etc. Pitch your topic with ease and precision using this Data Science Analysis Types In Marketing Function Ppt Ideas Designs Download Pdf. This layout presents information on Predictive Analysis, Sentiment Analysis, Regression Analysis. It is also available for immediate download and adjustment. So, changes can be made in the color, design, graphics or any other component to create a unique layout. This slide showcases the types of analysis in marketing function done by data science for key insights. This includes analysis like predictive analysis, sentiment analysis, regression analysis, etc.
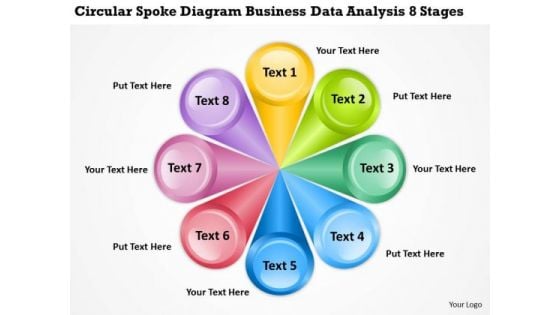
Diagram Business Data Analysis 8 Stages Real Estate Plan Examples PowerPoint Slides
We present our diagram business data analysis 8 stages real estate plan examples PowerPoint Slides.Use our Circle Charts PowerPoint Templates because You will get more than you ever bargained for. Use our Shapes PowerPoint Templates because Our PowerPoint Templates and Slides will help you be quick off the draw. Just enter your specific text and see your points hit home. Download our Business PowerPoint Templates because It can be used to Set your controls for the heart of the sun. Our PowerPoint Templates and Slides will be the propellant to get you there. Download our Signs PowerPoint Templates because you should Whip up a frenzy with our PowerPoint Templates and Slides. They will fuel the excitement of your team. Present our Curves and Lines PowerPoint Templates because Our PowerPoint Templates and Slides are effectively colour coded to prioritise your plans They automatically highlight the sequence of events you desire.Use these PowerPoint slides for presentations relating to diagram, model, business, chart, processes, sales, components, concept, vector, selling, distribution, marketing, abstract, management, illustration, icon, strategy, activities, executive, design, procedure, organization, advertising, conceptual, resource, promotion, editable. The prominent colors used in the PowerPoint template are Yellow, Green, Blue. Lead your argument with our Diagram Business Data Analysis 8 Stages Real Estate Plan Examples PowerPoint Slides. You will come out on top.
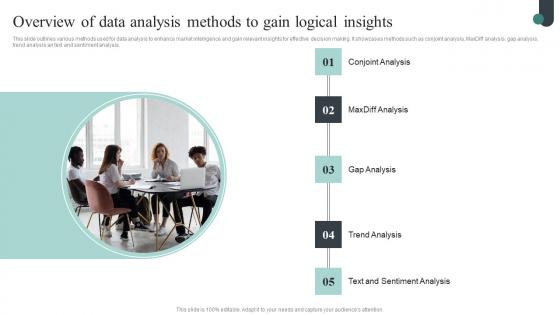
Overview Of Data Analysis Competitive Intelligence Guide To Determine Market Designs Pdf
This slide outlines various methods used for data analysis to enhance market intelligence and gain relevant insights for effective decision making. It showcases methods such as conjoint analysis, MaxDiff analysis, gap analysis, trend analysis an text and sentiment analysis. From laying roadmaps to briefing everything in detail, our templates are perfect for you. You can set the stage with your presentation slides. All you have to do is download these easy-to-edit and customizable templates. Overview Of Data Analysis Competitive Intelligence Guide To Determine Market Designs Pdf will help you deliver an outstanding performance that everyone would remember and praise you for. Do download this presentation today. This slide outlines various methods used for data analysis to enhance market intelligence and gain relevant insights for effective decision making. It showcases methods such as conjoint analysis, MaxDiff analysis, gap analysis, trend analysis an text and sentiment analysis.
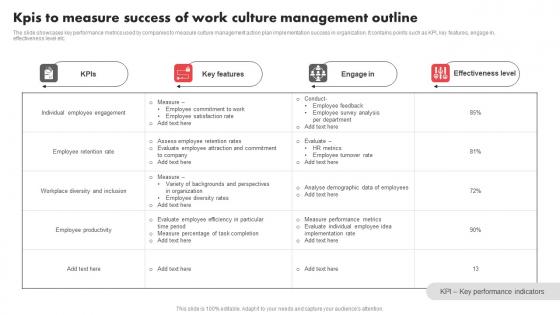
Kpis To Measure Success Of Work Culture Management Outline Diagrams Pdf
The slide showcases key performance metrics used by companies to measure culture management action plan implementation success in organization. It contains points such as KPI, key features, engage in, effectiveness level etc. Pitch your topic with ease and precision using this Kpis To Measure Success Of Work Culture Management Outline Diagrams Pdf. This layout presents information on Individual Employee Engagement, Employee Retention Rate, Workplace Diversity And Inclusion. It is also available for immediate download and adjustment. So, changes can be made in the color, design, graphics or any other component to create a unique layout. The slide showcases key performance metrics used by companies to measure culture management action plan implementation success in organization. It contains points such as KPI, key features, engage in, effectiveness level etc.
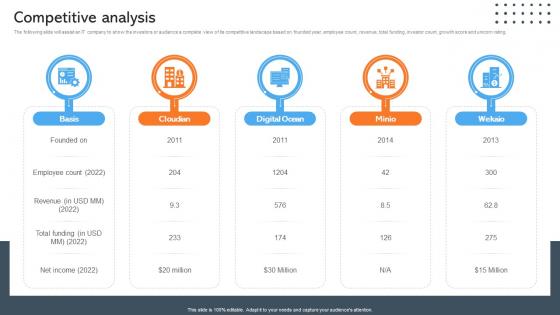
Competitive Analysis Data Management Company Investor Funding Pitch Deck
The following slide will assist an IT company to show the investors or audience a complete view of its competitive landscape based on founded year, employee count, revenue, total funding, investor count, growth score and unicorn rating. Want to ace your presentation in front of a live audience Our Competitive Analysis Data Management Company Investor Funding Pitch Deck can help you do that by engaging all the users towards you. Slidegeeks experts have put their efforts and expertise into creating these impeccable powerpoint presentations so that you can communicate your ideas clearly. Moreover, all the templates are customizable, and easy-to-edit and downloadable. Use these for both personal and commercial use. The following slide will assist an IT company to show the investors or audience a complete view of its competitive landscape based on founded year, employee count, revenue, total funding, investor count, growth score and unicorn rating.
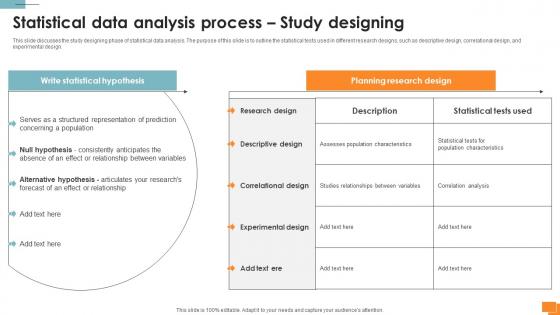
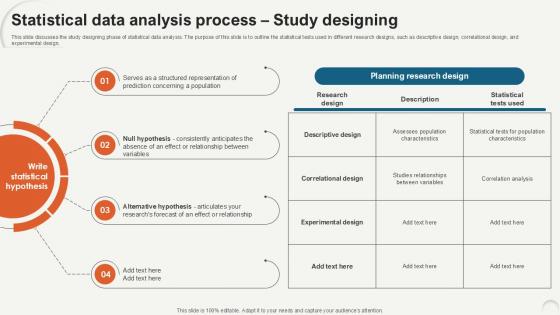
A135 Statistical Tools For Evidence Statistical Data Analysis Process Study Designing
This slide discusses the study designing phase of statistical data analysis. The purpose of this slide is to outline the statistical tests used in different research designs, such as descriptive design, correlational design, and experimental design. Slidegeeks is one of the best resources for PowerPoint templates. You can download easily and regulate A135 Statistical Tools For Evidence Statistical Data Analysis Process Study Designing for your personal presentations from our wonderful collection. A few clicks is all it takes to discover and get the most relevant and appropriate templates. Use our Templates to add a unique zing and appeal to your presentation and meetings. All the slides are easy to edit and you can use them even for advertisement purposes. This slide discusses the study designing phase of statistical data analysis. The purpose of this slide is to outline the statistical tests used in different research designs, such as descriptive design, correlational design, and experimental design.

Current Scenario Analysis Of Big Data Revolutionizing Production IoT Ppt Slide
The following slide showcases current scenario analysis of big data management to assess scope of improvement. It includes KPIs such as data accuracy, downtime reduction, etc. Whether you have daily or monthly meetings, a brilliant presentation is necessary. Current Scenario Analysis Of Big Data Revolutionizing Production IoT Ppt Slide can be your best option for delivering a presentation. Represent everything in detail using Current Scenario Analysis Of Big Data Revolutionizing Production IoT Ppt Slide and make yourself stand out in meetings. The template is versatile and follows a structure that will cater to your requirements. All the templates prepared by Slidegeeks are easy to download and edit. Our research experts have taken care of the corporate themes as well. So, give it a try and see the results. The following slide showcases current scenario analysis of big data management to assess scope of improvement. It includes KPIs such as data accuracy, downtime reduction, etc.
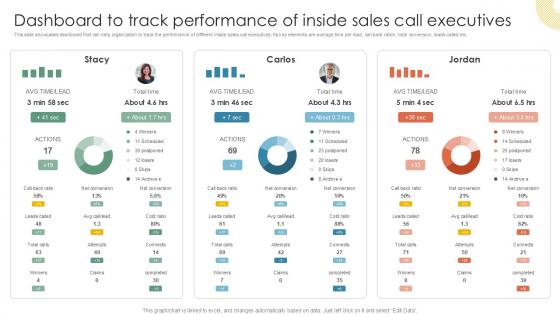
Dashboard To Track Performance Of Inside Vs Outside Sales PPT PowerPoint Strategy SS V
This slide showcases dashboard that can help organization to track the performance of different inside sales call executives. Its key elements are average time per lead, call back ration, total conversion, leads called etc. Do you have an important presentation coming up Are you looking for something that will make your presentation stand out from the rest Look no further than Dashboard To Track Performance Of Inside Vs Outside Sales PPT PowerPoint Strategy SS V. With our professional designs, you can trust that your presentation will pop and make delivering it a smooth process. And with Slidegeeks, you can trust that your presentation will be unique and memorable. So why wait Grab Dashboard To Track Performance Of Inside Vs Outside Sales PPT PowerPoint Strategy SS V today and make your presentation stand out from the rest This slide showcases dashboard that can help organization to track the performance of different inside sales call executives. Its key elements are average time per lead, call back ration, total conversion, leads called etc.
Statistical Data Analysis Process Study Designing Ppt Presentation
This slide discusses the study designing phase of statistical data analysis. The purpose of this slide is to outline the statistical tests used in different research designs, such as descriptive design, correlational design, and experimental design. Do you have to make sure that everyone on your team knows about any specific topic I yes, then you should give Statistical Data Analysis Process Study Designing Ppt Presentation a try. Our experts have put a lot of knowledge and effort into creating this impeccable Statistical Data Analysis Process Study Designing Ppt Presentation. You can use this template for your upcoming presentations, as the slides are perfect to represent even the tiniest detail. You can download these templates from the Slidegeeks website and these are easy to edit. So grab these today This slide discusses the study designing phase of statistical data analysis. The purpose of this slide is to outline the statistical tests used in different research designs, such as descriptive design, correlational design, and experimental design.
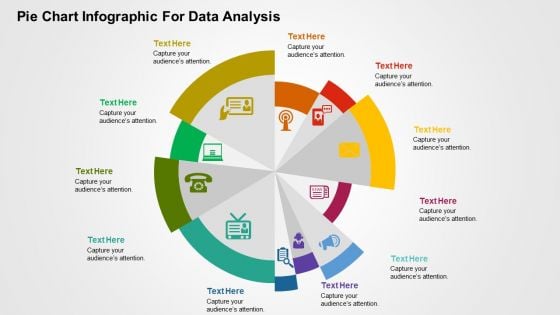
Pie Chart Infographic For Data Analysis PowerPoint Templates
This is one of the most downloaded PowerPoint template. This slide can be used for various purposes and to explain a number of processes. This can be included in your presentation to explain each step of a process and even include its relevance and importance in a single diagram. Using the uneven circular structure of the pie chart, the presenter can also explain random steps or highlight particular steps of process or parts of an organization or business that need special attention of any kind to the audience. Additionally, you can use this slide to show a transformation process or highlight key features of a product.
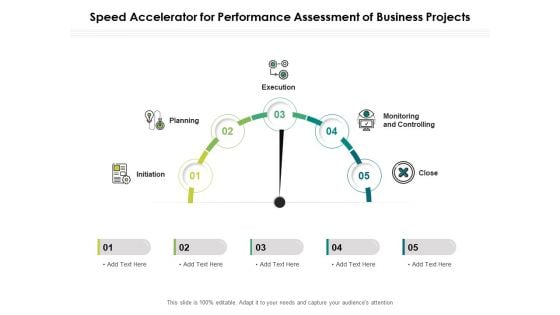
Speed Accelerator For Performance Assessment Of Business Projects Ppt PowerPoint Presentation Show Example Introduction PDF
Presenting this set of slides with name speed accelerator for performance assessment of business projects ppt powerpoint presentation show example introduction pdf. This is a five stage process. The stages in this process are initiation, planning, execution, monitoring and controlling, close. This is a completely editable PowerPoint presentation and is available for immediate download. Download now and impress your audience.
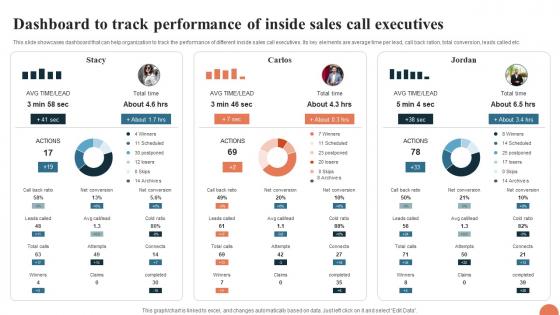
Telesales Strategy For Targeting Large Dashboard To Track Performance Of Inside Sales Strategy SS V
This slide showcases dashboard that can help organization to track the performance of different inside sales call executives. Its key elements are average time per lead, call back ration, total conversion, leads called etc. Retrieve professionally designed Telesales Strategy For Targeting Large Dashboard To Track Performance Of Inside Sales Strategy SS V to effectively convey your message and captivate your listeners. Save time by selecting pre-made slideshows that are appropriate for various topics, from business to educational purposes. These themes come in many different styles, from creative to corporate, and all of them are easily adjustable and can be edited quickly. Access them as PowerPoint templates or as Google Slides themes. You do not have to go on a hunt for the perfect presentation because Slidegeeks got you covered from everywhere. This slide showcases dashboard that can help organization to track the performance of different inside sales call executives. Its key elements are average time per lead, call back ration, total conversion, leads called etc.
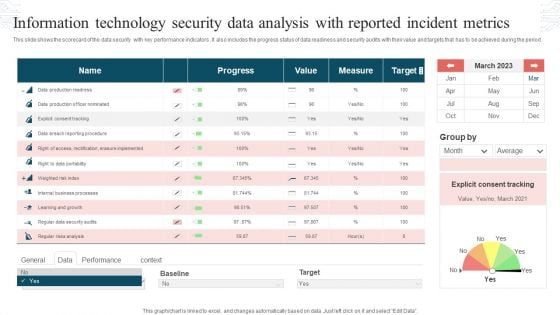
Information Technology Security Data Analysis With Reported Incident Metrics Rules PDF
This slide shows the scorecard of the data security with key performance indicators. It also includes the progress status of data readiness and security audits with their value and targets that has to be achieved during the period. Pitch your topic with ease and precision using this Information Technology Security Data Analysis With Reported Incident Metrics Rules PDF. This layout presents information on Progress, Value, Measure, Target. It is also available for immediate download and adjustment. So, changes can be made in the color, design, graphics or any other component to create a unique layout.
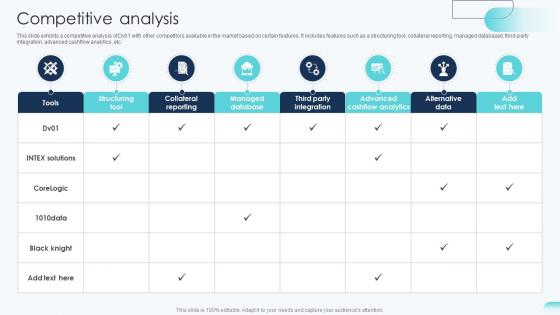
Competitive Analysis Big Data Analytics Investor Funding Elevator Pitch Deck
This slide exhibits a competitive analysis of Dv01 with other competitors available in the market based on certain features. It includes features such as a structuring tool, collateral reporting, managed databased, third-party integration, advanced cashflow analytics, etc. Want to ace your presentation in front of a live audience Our Competitive Analysis Big Data Analytics Investor Funding Elevator Pitch Deck can help you do that by engaging all the users towards you. Slidegeeks experts have put their efforts and expertise into creating these impeccable powerpoint presentations so that you can communicate your ideas clearly. Moreover, all the templates are customizable, and easy-to-edit and downloadable. Use these for both personal and commercial use. This slide exhibits a competitive analysis of Dv01 with other competitors available in the market based on certain features. It includes features such as a structuring tool, collateral reporting, managed databased, third-party integration, advanced cashflow analytics, etc.
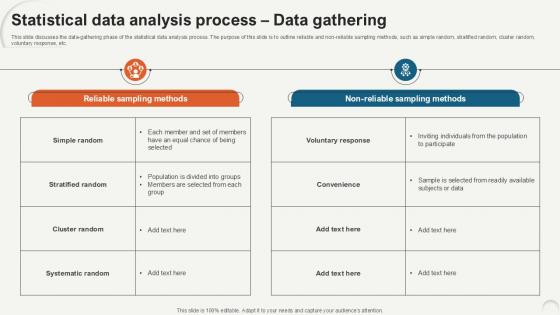
Statistical Data Analysis Process Data Gathering Ppt Example
This slide discusses the data-gathering phase of the statistical data analysis process. The purpose of this slide is to outline reliable and non-reliable sampling methods, such as simple random, stratified random, cluster random, voluntary response, etc. Slidegeeks is one of the best resources for PowerPoint templates. You can download easily and regulate Statistical Data Analysis Process Data Gathering Ppt Example for your personal presentations from our wonderful collection. A few clicks is all it takes to discover and get the most relevant and appropriate templates. Use our Templates to add a unique zing and appeal to your presentation and meetings. All the slides are easy to edit and you can use them even for advertisement purposes. This slide discusses the data-gathering phase of the statistical data analysis process. The purpose of this slide is to outline reliable and non-reliable sampling methods, such as simple random, stratified random, cluster random, voluntary response, etc.
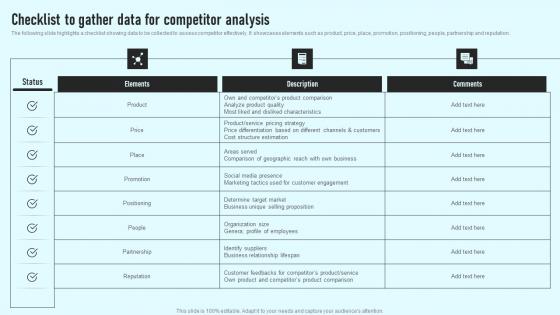
Checklist To Gather Data For Competitor Analysis Comprehensive Guide Designs Pdf
The following slide highlights a checklist showing data to be collected to assess competitor effectively. It showcases elements such as product, price, place, promotion, positioning, people, partnership and reputation. Present like a pro with Checklist To Gather Data For Competitor Analysis Comprehensive Guide Designs Pdf Create beautiful presentations together with your team, using our easy-to-use presentation slides. Share your ideas in real-time and make changes on the fly by downloading our templates. So whether you are in the office, on the go, or in a remote location, you can stay in sync with your team and present your ideas with confidence. With Slidegeeks presentation got a whole lot easier. Grab these presentations today. The following slide highlights a checklist showing data to be collected to assess competitor effectively. It showcases elements such as product, price, place, promotion, positioning, people, partnership and reputation.
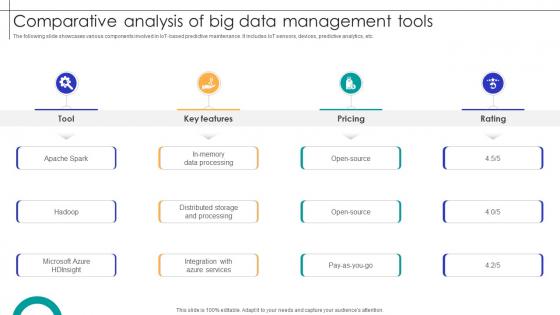
Comparative Analysis Of Big Data Management Tools Streamlining Production Ppt Powerpoint
The following slide showcases various components involved in IoT-based predictive maintenance. It includes IoT sensors, devices, predictive analytics, etc. Are you in need of a template that can accommodate all of your creative concepts This one is crafted professionally and can be altered to fit any style. Use it with Google Slides or PowerPoint. Include striking photographs, symbols, depictions, and other visuals. Fill, move around, or remove text boxes as desired. Test out color palettes and font mixtures. Edit and save your work, or work with colleagues. Download Comparative Analysis Of Big Data Management Tools Streamlining Production Ppt Powerpoint and observe how to make your presentation outstanding. Give an impeccable presentation to your group and make your presentation unforgettable. The following slide showcases various components involved in IoT-based predictive maintenance. It includes IoT sensors, devices, predictive analytics, etc.
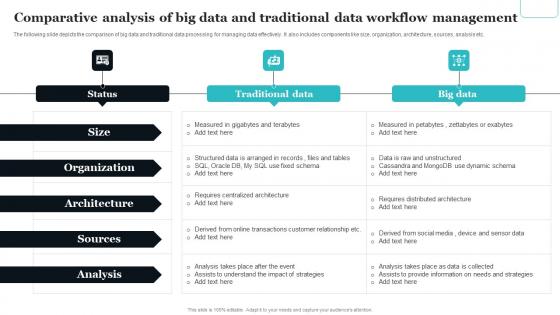
Comparative Analysis Of Big Data And Traditional Data Workflow Management Topics Pdf
The following slide depicts the comparison of big data and traditional data processing for managing data effectively. It also includes components like size, organization, architecture, sources, analysis etc. Showcasing this set of slides titled Comparative Analysis Of Big Data And Traditional Data Workflow Management Topics Pdf The topics addressed in these templates are Organization, Architecture, Sources, Analysis All the content presented in this PPT design is completely editable. Download it and make adjustments in color, background, font etc. as per your unique business setting. The following slide depicts the comparison of big data and traditional data processing for managing data effectively. It also includes components like size, organization, architecture, sources, analysis etc.
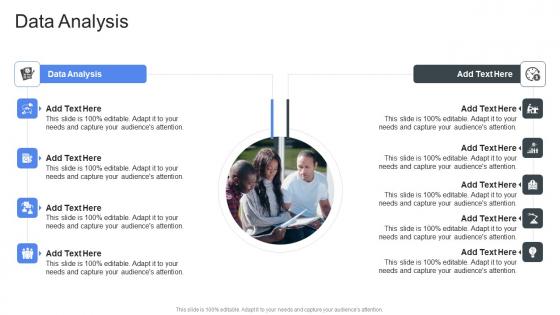
Data Analysis In Powerpoint And Google Slides Cpb
Presenting our innovatively designed set of slides titled Data Analysis In Powerpoint And Google Slides Cpb. This completely editable PowerPoint graphic exhibits Data Analysis that will help you convey the message impactfully. It can be accessed with Google Slides and is available in both standard screen and widescreen aspect ratios. Apart from this, you can download this well structured PowerPoint template design in different formats like PDF, JPG, and PNG. So, click the download button now to gain full access to this PPT design. Our Data Analysis In Powerpoint And Google Slides Cpb are topically designed to provide an attractive backdrop to any subject. Use them to look like a presentation pro.
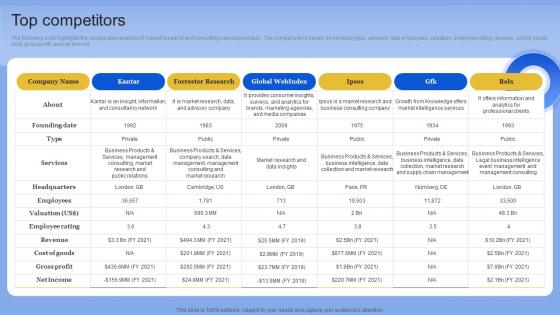
Top Competitors Data Analytics Company Outline Designs PDF
The following slide highlights the comparative analysis of market research and consulting service providers. The comparison is based on company type, services, total employees, valuation, employee rating, revenue, cost of goods sold, gross profit, and net income. Boost your pitch with our creative Top Competitors Data Analytics Company Outline Designs PDF Deliver an awe-inspiring pitch that will mesmerize everyone. Using these presentation templates you will surely catch everyones attention. You can browse the ppts collection on our website. We have researchers who are experts at creating the right content for the templates. So you do not have to invest time in any additional work. Just grab the template now and use them. The following slide highlights the comparative analysis of market research and consulting service providers. The comparison is based on company type, services, total employees, valuation, employee rating, revenue, cost of goods sold, gross profit, and net income
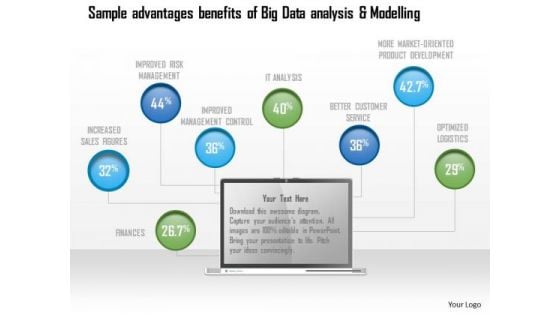
Business Diagram Sample Advantages Benefits Of Big Data Analysis And Modelling Ppt Slide
Explain the concept of sample advantages and benefits of big data analysis with this unique diagram. This slide contains the graphic of data icons. Use this slide to present data analysis and modeling related topics in any presentation.
Text Mining Structure Showcasing Data Analysis Icon Microsoft Pdf
Showcasing this set of slides titled Text Mining Structure Showcasing Data Analysis Icon Microsoft Pdf. The topics addressed in these templates are Text Mining Structure, Showcasing Data Analysis Icon. All the content presented in this PPT design is completely editable. Download it and make adjustments in color, background, font etc. as per your unique business setting. Our Text Mining Structure Showcasing Data Analysis Icon Microsoft Pdf are topically designed to provide an attractive backdrop to any subject. Use them to look like a presentation pro.
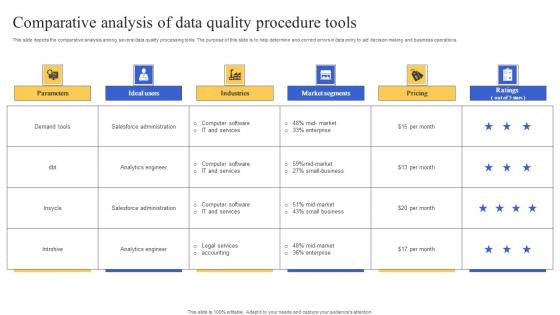
Comparative Analysis Of Data Quality Procedure Tools Mockup Pdf
This slide depicts the comparative analysis among several data quality processing tools. The purpose of this slide is to help determine and correct errors in data entry to aid decision making and business operations. Pitch your topic with ease and precision using this Comparative Analysis Of Data Quality Procedure Tools Mockup Pdf. This layout presents information on Comparative Analysis, Data Quality Procedure Tools, Decision Making, Business Operations. It is also available for immediate download and adjustment. So, changes can be made in the color, design, graphics or any other component to create a unique layout. This slide depicts the comparative analysis among several data quality processing tools. The purpose of this slide is to help determine and correct errors in data entry to aid decision making and business operations.
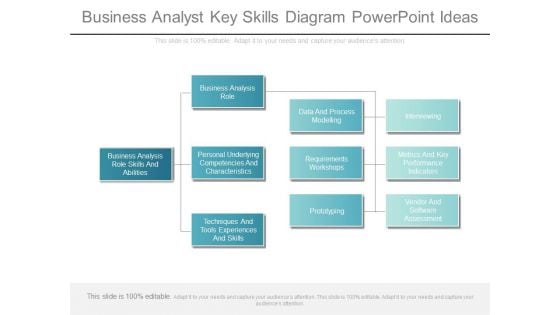
Business Analyst Key Skills Diagram Powerpoint Ideas
This is a business analyst key skills diagram powerpoint ideas. This is a four stage process. The stages in this process are business analysis role skills and abilities, business analysis role, personal underlying competencies and characteristics, techniques and tools experiences and skills, data and process modelling, requirements workshops, prototyping, interviewing, metrics and key performance indicators, vendor and software assessment.
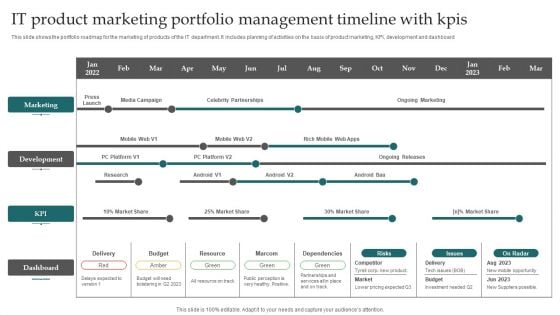
IT Product Marketing Portfolio Management Timeline With Kpis Elements PDF
This slide shows the portfolio roadmap for the marketing of products of the IT department. It includes planning of activities on the basis of product marketing, KPI, development and dashboard. Showcasing this set of slides titled IT Product Marketing Portfolio Management Timeline With Kpis Elements PDF. The topics addressed in these templates are Marketing, Development, Budget. All the content presented in this PPT design is completely editable. Download it and make adjustments in color, background, font etc. as per your unique business setting.

Cost Breakdown Structure Ppt Presentation
This is a cost breakdown structure ppt presentation. This is a five stage process. The stages in this process are process design, needs analysis, concept analysis r, execution, feedback.
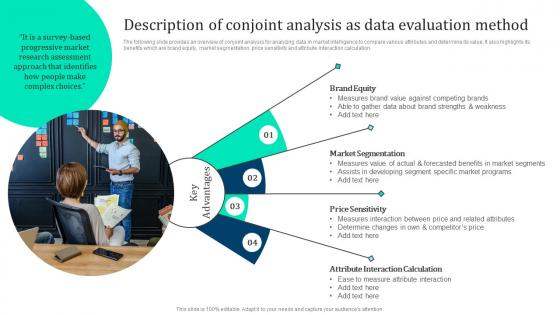
Description Conjoint Analysis Data Marketing Intelligence Guide Data Gathering Microsoft Pdf
The following slide provides an overview of conjoint analysis for analyzing data in market intelligence to compare various attributes and determine its value. It also highlights its benefits which are brand equity, market segmentation, price sensitivity and attribute interaction calculation. Do you have an important presentation coming up Are you looking for something that will make your presentation stand out from the rest Look no further than Description Conjoint Analysis Data Marketing Intelligence Guide Data Gathering Microsoft Pdf. With our professional designs, you can trust that your presentation will pop and make delivering it a smooth process. And with Slidegeeks, you can trust that your presentation will be unique and memorable. So why wait Grab Description Conjoint Analysis Data Marketing Intelligence Guide Data Gathering Microsoft Pdf today and make your presentation stand out from the rest The following slide provides an overview of conjoint analysis for analyzing data in market intelligence to compare various attributes and determine its value. It also highlights its benefits which are brand equity, market segmentation, price sensitivity and attribute interaction calculation.
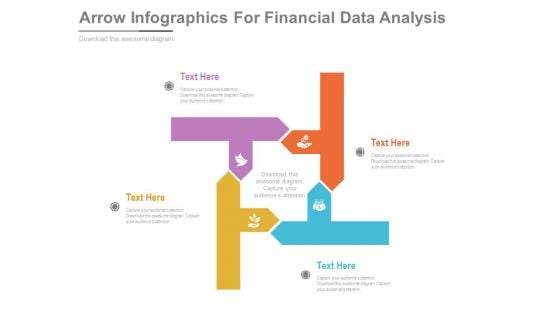
Arrow Infographics For Financial Data Analysis Powerpoint Template
This PowerPoint slide contains diagram of arrows infographic. This professional slide helps to exhibit financial data analysis for business growth. Use this PowerPoint template to make impressive presentations.
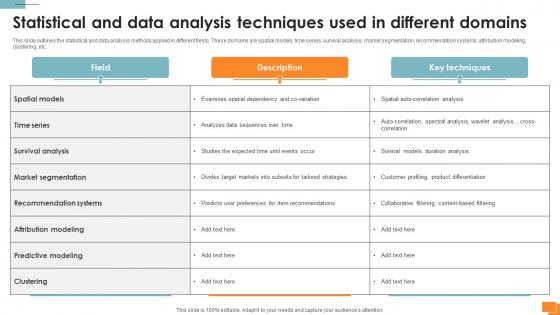
Statistical Tools For Evidence Statistical And Data Analysis Techniques Used
This slide outlines the statistical and data analysis methods applied in different fields. These domains are spatial models, time series, survival analysis, market segmentation, recommendation systems, attribution modeling, clustering, etc. There are so many reasons you need a Statistical Tools For Evidence Statistical And Data Analysis Techniques Used. The first reason is you can not spend time making everything from scratch, Thus, Slidegeeks has made presentation templates for you too. You can easily download these templates from our website easily. This slide outlines the statistical and data analysis methods applied in different fields. These domains are spatial models, time series, survival analysis, market segmentation, recommendation systems, attribution modeling, clustering, etc.
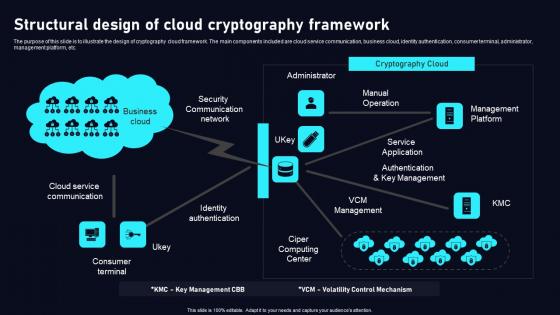
Structural Design Of Cloud Cryptography Cloud Data Security Using Cryptography Themes Pdf
The purpose of this slide is to illustrate the design of cryptography cloud framework. The main components included are cloud service communication, business cloud, identity authentication, consumer terminal, administrator, management platform, etc. If your project calls for a presentation, then Slidegeeks is your go to partner because we have professionally designed, easy to edit templates that are perfect for any presentation. After downloading, you can easily edit Structural Design Of Cloud Cryptography Cloud Data Security Using Cryptography Themes Pdf and make the changes accordingly. You can rearrange slides or fill them with different images. Check out all the handy templates The purpose of this slide is to illustrate the design of cryptography cloud framework. The main components included are cloud service communication, business cloud, identity authentication, consumer terminal, administrator, management platform, etc.
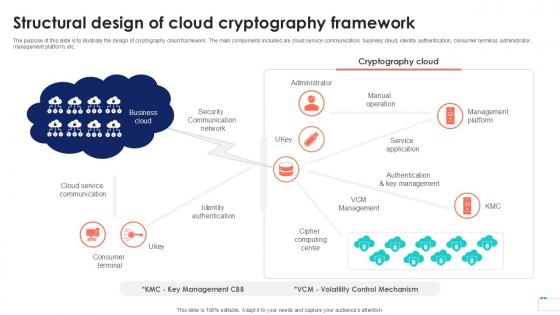
Structural Design Of Cloud Cryptography Data Security In Cloud Computing Ppt Sample
The purpose of this slide is to illustrate the design of cryptography cloud framework. The main components included are cloud service communication, business cloud, identity authentication, consumer terminal, administrator, management platform, etc. From laying roadmaps to briefing everything in detail, our templates are perfect for you. You can set the stage with your presentation slides. All you have to do is download these easy-to-edit and customizable templates. Structural Design Of Cloud Cryptography Data Security In Cloud Computing Ppt Sample will help you deliver an outstanding performance that everyone would remember and praise you for. Do download this presentation today. The purpose of this slide is to illustrate the design of cryptography cloud framework. The main components included are cloud service communication, business cloud, identity authentication, consumer terminal, administrator, management platform, etc.
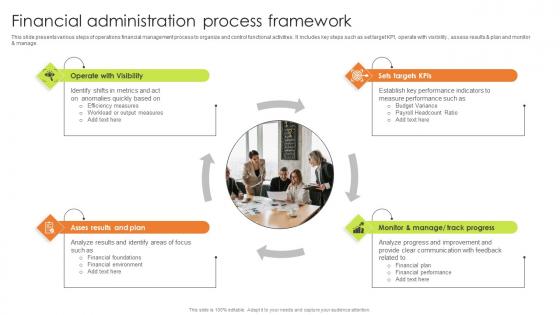
Financial Administration Process Framework Topics Pdf
This slide presents various steps of operations financial management process to organize and control functional activities. It includes key steps such as set target KPI, operate with visibility., assess results and plan and monitor and manage. Pitch your topic with ease and precision using this Financial Administration Process Framework Topics Pdf. This layout presents information on Operate Visibility, Asses Results Plan, Monitor Manage. It is also available for immediate download and adjustment. So, changes can be made in the color, design, graphics or any other component to create a unique layout. This slide presents various steps of operations financial management process to organize and control functional activities. It includes key steps such as set target KPI, operate with visibility., assess results and plan and monitor and manage.
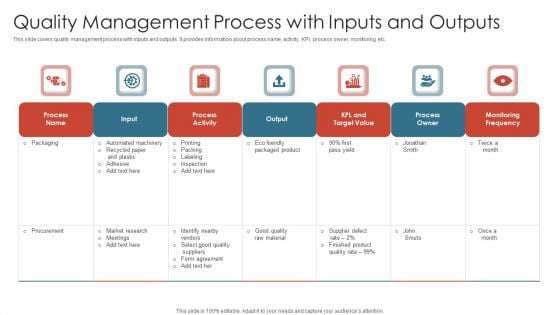
Quality Management Process With Inputs And Outputs Topics PDF
This slide covers quality management process with inputs and outputs. It provides information about process name, activity, KPI, process owner, monitoring, etc. Showcasing this set of slides titled quality management process with inputs and outputs topics pdf. The topics addressed in these templates are output, process owner, monitoring frequency. All the content presented in this PPT design is completely editable. Download it and make adjustments in color, background, font etc. as per your unique business setting.
Statistical Analysis Challenges Data Analytics For Informed Decision Ppt Example
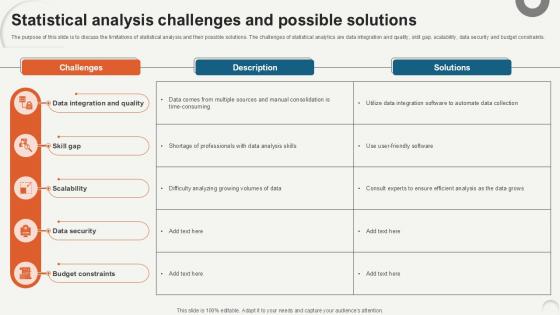
The purpose of this slide is to discuss the limitations of statistical analysis and their possible solutions. The challenges of statistical analytics are data integration and quality, skill gap, scalability, data security and budget constraints. Slidegeeks has constructed Statistical Analysis Challenges Data Analytics For Informed Decision Ppt Example after conducting extensive research and examination. These presentation templates are constantly being generated and modified based on user preferences and critiques from editors. Here, you will find the most attractive templates for a range of purposes while taking into account ratings and remarks from users regarding the content. This is an excellent jumping-off point to explore our content and will give new users an insight into our top-notch PowerPoint Templates. The purpose of this slide is to discuss the limitations of statistical analysis and their possible solutions. The challenges of statistical analytics are data integration and quality, skill gap, scalability, data security and budget constraints.
Comparative Analysis Of Advanced Data Tools Template Pdf
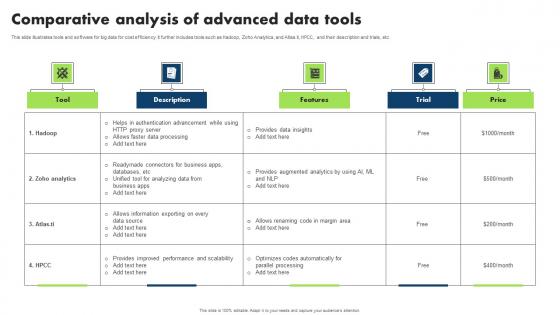
This slide illustrates tools and software for big data for cost efficiency. It further includes tools such as Hadoop, Zoho Analytics, and Atlas.ti, HPCC, and their description and trials, etc Showcasing this set of slides titled Comparative Analysis Of Advanced Data Tools Template Pdf. The topics addressed in these templates are Hadoop, Readymade Connectors Business, Unified Tool Analyzing Data. All the content presented in this PPT design is completely editable. Download it and make adjustments in color, background, font etc. as per your unique business setting. This slide illustrates tools and software for big data for cost efficiency. It further includes tools such as Hadoop, Zoho Analytics, and Atlas.ti, HPCC, and their description and trials, etc
Data Management Presentation Powerpoint Templates
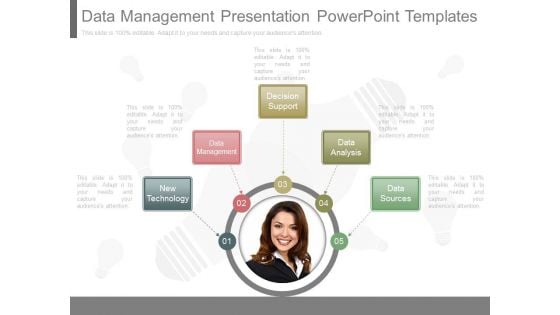
This is a data management presentation powerpoint templates. This is a five stage process. The stages in this process are new technology, data management, decision support, data analysis, data sources.
Budget Plan For Recruitment Data Analysis Interns From Campus Mockup Pdf
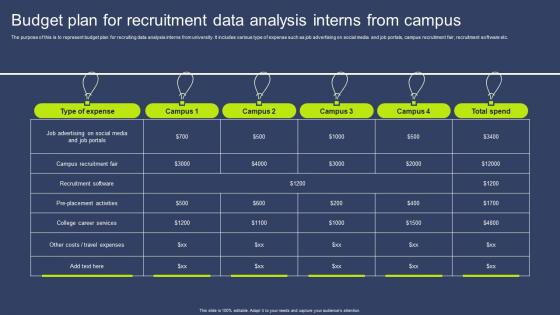
The purpose of this is to represent budget plan for recruiting data analysis interns from university. It includes various type of expense such as job advertising on social media and job portals, campus recruitment fair, recruitment software etc. Pitch your topic with ease and precision using this Budget Plan For Recruitment Data Analysis Interns From Campus Mockup Pdf. This layout presents information on Type Expense, Campus Recruitment Fair, Recruitment Software. It is also available for immediate download and adjustment. So, changes can be made in the color, design, graphics or any other component to create a unique layout. The purpose of this is to represent budget plan for recruiting data analysis interns from university. It includes various type of expense such as job advertising on social media and job portals, campus recruitment fair, recruitment software etc.

Net Promoter Score Data Analysis Ppt Powerpoint Slides
This is a net promoter score data analysis ppt powerpoint slides. This is a ten stage process. The stages in this process are very willing, neutral, not at all willing, promoters, passives, detractors, net promoter score, percentage promoters, minus, percentage detractors.
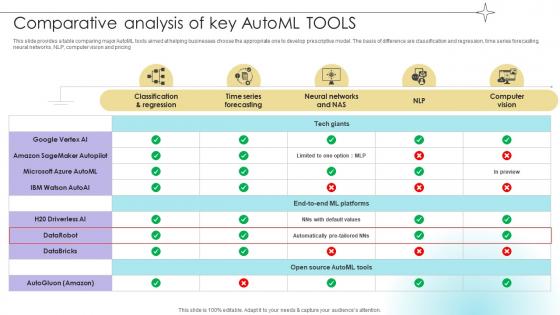
Comparative Analysis Of Key Automl Tools Data Analytics SS V
This slide provides a table comparing major AutoML tools aimed at helping businesses choose the appropriate one to develop prescriptive model. The basis of difference are classification and regression, time series forecasting, neural networks, NLP, computer vision and pricing.The Comparative Analysis Of Key Automl Tools Data Analytics SS V is a compilation of the most recent design trends as a series of slides. It is suitable for any subject or industry presentation, containing attractive visuals and photo spots for businesses to clearly express their messages. This template contains a variety of slides for the user to input data, such as structures to contrast two elements, bullet points, and slides for written information. Slidegeeks is prepared to create an impression. This slide provides a table comparing major AutoML tools aimed at helping businesses choose the appropriate one to develop prescriptive model. The basis of difference are classification and regression, time series forecasting, neural networks, NLP, computer vision and pricing.
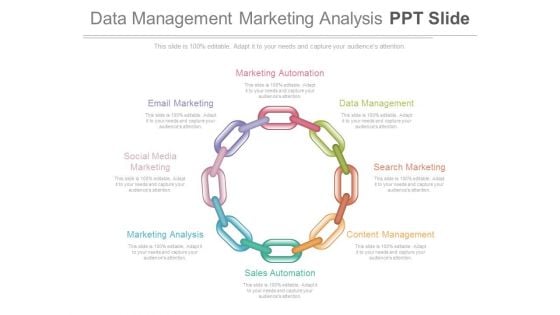
Data Management Marketing Analysis Ppt Slide
This is a data management marketing analysis ppt slide. This is a eight stage process. The stages in this process are marketing, sales, business, success.
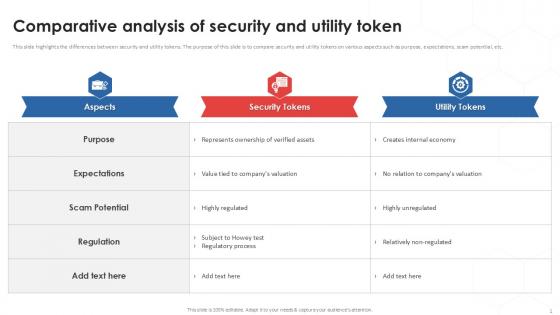
Comparative Analysis Of Tokenization Strategies For Data Security PPT Template
This slide highlights the differences between security and utility tokens. The purpose of this slide is to compare security and utility tokens on various aspects such as purpose, expectations, scam potential, etc. Find a pre-designed and impeccable Comparative Analysis Of Tokenization Strategies For Data Security PPT Template. The templates can ace your presentation without additional effort. You can download these easy-to-edit presentation templates to make your presentation stand out from others. So, what are you waiting for Download the template from Slidegeeks today and give a unique touch to your presentation. This slide highlights the differences between security and utility tokens. The purpose of this slide is to compare security and utility tokens on various aspects such as purpose, expectations, scam potential, etc.
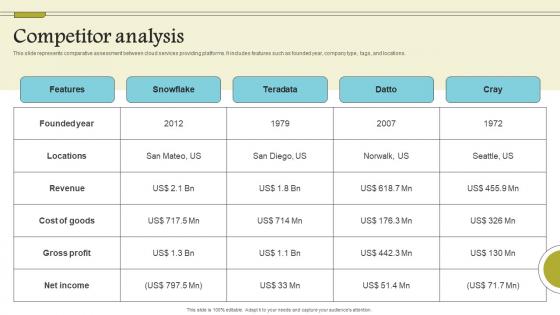
Competitor Analysis Cloud Data Computing Company Fund Raising Topics PDF
This slide represents comparative assessment between cloud services providing platforms. It includes features such as founded year, company type, tags, and locations. Want to ace your presentation in front of a live audience Our Competitor Analysis Cloud Data Computing Company Fund Raising Topics PDF can help you do that by engaging all the users towards you. Slidegeeks experts have put their efforts and expertise into creating these impeccable powerpoint presentations so that you can communicate your ideas clearly. Moreover, all the templates are customizable, and easy-to-edit and downloadable. Use these for both personal and commercial use. This slide represents comparative assessment between cloud services providing platforms. It includes features such as founded year, company type, tags, and locations.
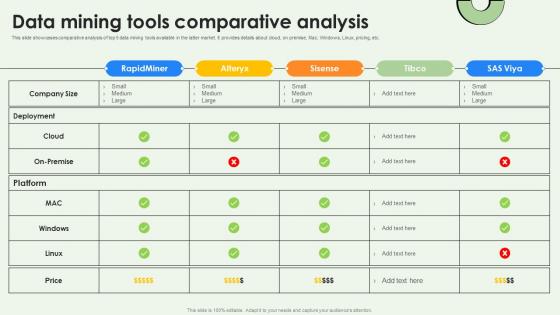
Data Mining Tools Comparative Analysis Data Warehousing And Data Mining Guide AI SS V
This slide showcases comparative analysis of top 5 data mining tools available in the latter market. It provides details about cloud, on premise, Mac, Windows, Linux, pricing, etc. Formulating a presentation can take up a lot of effort and time, so the content and message should always be the primary focus. The visuals of the PowerPoint can enhance the presenters message, so our Data Mining Tools Comparative Analysis Data Warehousing And Data Mining Guide AI SS V was created to help save time. Instead of worrying about the design, the presenter can concentrate on the message while our designers work on creating the ideal templates for whatever situation is needed. Slidegeeks has experts for everything from amazing designs to valuable content, we have put everything into Data Mining Tools Comparative Analysis Data Warehousing And Data Mining Guide AI SS V. This slide showcases comparative analysis of top 5 data mining tools available in the latter market. It provides details about cloud, on premise, Mac, Windows, Linux, pricing, etc.
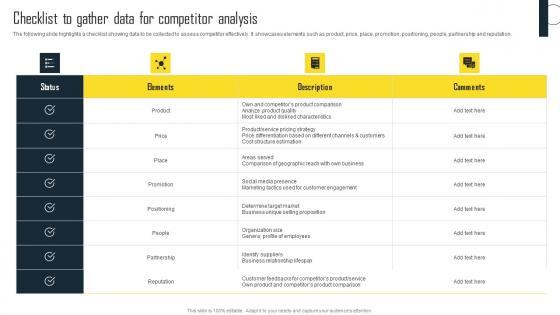
Checklist To Gather Data For Competitor Analysis Efficient Plan For Conducting Competitor Inspiration Pdf
The following slide highlights a checklist showing data to be collected to assess competitor effectively. It showcases elements such as product, price, place, promotion, positioning, people, partnership and reputation. From laying roadmaps to briefing everything in detail, our templates are perfect for you. You can set the stage with your presentation slides. All you have to do is download these easy-to-edit and customizable templates. Checklist To Gather Data For Competitor Analysis Efficient Plan For Conducting Competitor Inspiration Pdf will help you deliver an outstanding performance that everyone would remember and praise you for. Do download this presentation today. The following slide highlights a checklist showing data to be collected to assess competitor effectively. It showcases elements such as product, price, place, promotion, positioning, people, partnership and reputation.
Data Quality Kpis Assessment Metrics Icon Topics PDF
Showcasing this set of slides titled Data Quality Kpis Assessment Metrics Icon Topics PDF. The topics addressed in these templates are Data Quality Kpis, Assessment Metrics Icon. All the content presented in this PPT design is completely editable. Download it and make adjustments in color, background, font etc. as per your unique business setting.
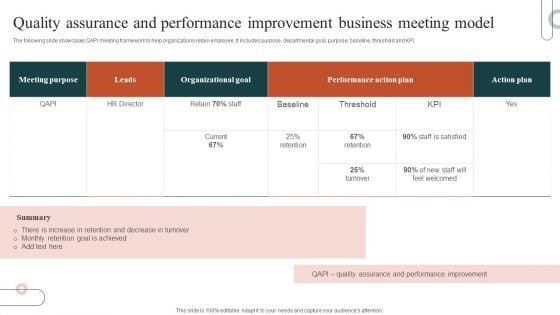
Quality Assurance And Performance Improvement Business Meeting Model Background PDF
The following slide showcases QAPI meeting framework to help organizations retain employee. It includes purpose, departmental goal, purpose, baseline, threshold and KPI. Showcasing this set of slides titled Quality Assurance And Performance Improvement Business Meeting Model Background PDF. The topics addressed in these templates are Organizational Goal, Performance Action Plan, Action Plan. All the content presented in this PPT design is completely editable. Download it and make adjustments in color, background, font etc. as per your unique business setting.

Key Steps To Conduct Heuristic Analysis Data Analytics SS V
This slide outlines major steps to conduct heuristics analysis aimed at helping businesses conduct evaluation and generate meaningful changes. It covers steps such as define analysis scope, end user knowledge, define heuristics, choose reporting style, set up scoring system and analyze.Do you have an important presentation coming up Are you looking for something that will make your presentation stand out from the rest Look no further than Key Steps To Conduct Heuristic Analysis Data Analytics SS V. With our professional designs, you can trust that your presentation will pop and make delivering it a smooth process. And with Slidegeeks, you can trust that your presentation will be unique and memorable. So why wait Grab Key Steps To Conduct Heuristic Analysis Data Analytics SS V today and make your presentation stand out from the rest This slide outlines major steps to conduct heuristics analysis aimed at helping businesses conduct evaluation and generate meaningful changes. It covers steps such as define analysis scope, end user knowledge, define heuristics, choose reporting style, set up scoring system and analyze.
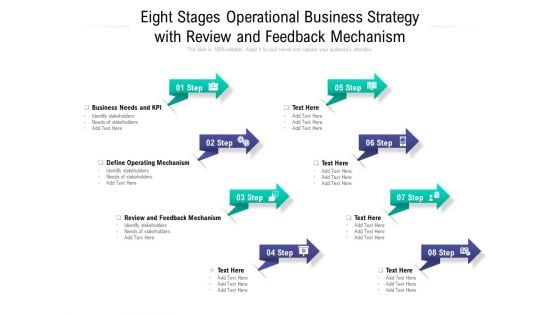
Eight Stages Operational Business Strategy With Review And Feedback Mechanism Ppt PowerPoint Presentation Outline Deck PDF
Presenting this set of slides with name eight stages operational business strategy with review and feedback mechanism ppt powerpoint presentation outline deck pdf. This is a eight stage process. The stages in this process are business needs and kpi, define operating mechanism, review and feedback mechanism. This is a completely editable PowerPoint presentation and is available for immediate download. Download now and impress your audience.
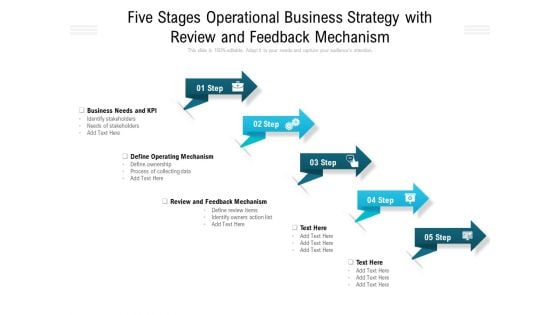
Five Stages Operational Business Strategy With Review And Feedback Mechanism Ppt PowerPoint Presentation Slides Example PDF
Presenting this set of slides with name five stages operational business strategy with review and feedback mechanism ppt powerpoint presentation slides example pdf. This is a five stage process. The stages in this process are business needs and kpi, define operating mechanism, review and feedback mechanism. This is a completely editable PowerPoint presentation and is available for immediate download. Download now and impress your audience.
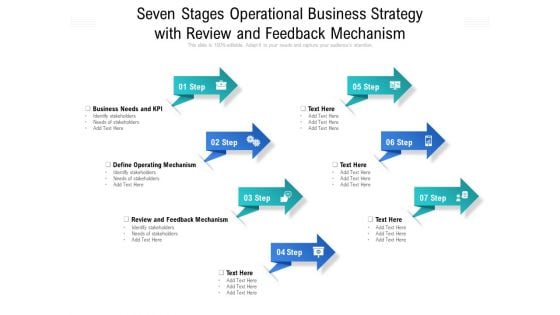
Seven Stages Operational Business Strategy With Review And Feedback Mechanism Ppt PowerPoint Presentation Visual Aids Gallery PDF
Presenting this set of slides with name seven stages operational business strategy with review and feedback mechanism ppt powerpoint presentation visual aids gallery pdf. This is a seven stage process. The stages in this process are business needs and kpi, define operating mechanism, review and feedback mechanism. This is a completely editable PowerPoint presentation and is available for immediate download. Download now and impress your audience.

Six Stages Operational Business Strategy With Review And Feedback Mechanism Ppt PowerPoint Presentation File Slide Portrait PDF
Presenting this set of slides with name six stages operational business strategy with review and feedback mechanism ppt powerpoint presentation file slide portrait pdf. This is a six stage process. The stages in this process are business needs and kpi, define operating mechanism, review and feedback mechanism. This is a completely editable PowerPoint presentation and is available for immediate download. Download now and impress your audience.
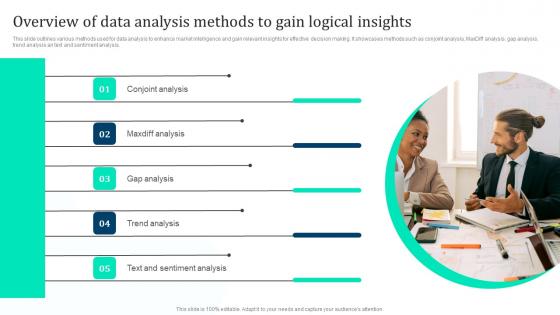
Overview Data Analysis Methods Gain Marketing Intelligence Guide Data Gathering Infographics Pdf
This slide outlines various methods used for data analysis to enhance market intelligence and gain relevant insights for effective decision making. It showcases methods such as conjoint analysis, MaxDiff analysis, gap analysis, trend analysis an text and sentiment analysis. This Overview Data Analysis Methods Gain Marketing Intelligence Guide Data Gathering Infographics Pdf from Slidegeeks makes it easy to present information on your topic with precision. It provides customization options, so you can make changes to the colors, design, graphics, or any other component to create a unique layout. It is also available for immediate download, so you can begin using it right away. Slidegeeks has done good research to ensure that you have everything you need to make your presentation stand out. Make a name out there for a brilliant performance. This slide outlines various methods used for data analysis to enhance market intelligence and gain relevant insights for effective decision making. It showcases methods such as conjoint analysis, MaxDiff analysis, gap analysis, trend analysis an text and sentiment analysis.
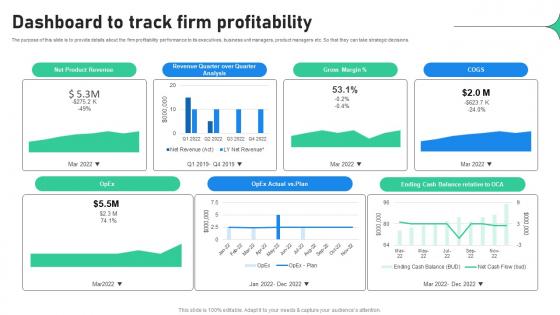
Dashboard To Track Firm Profitability Increasing Profitability Through Better Product
The purpose of this slide is to provide details about the firm profitability performance to its executives, business unit managers, product managers etc. So that they can take strategic decisions. From laying roadmaps to briefing everything in detail, our templates are perfect for you. You can set the stage with your presentation slides. All you have to do is download these easy-to-edit and customizable templates. Dashboard To Track Firm Profitability Increasing Profitability Through Better Product will help you deliver an outstanding performance that everyone would remember and praise you for. Do download this presentation today. The purpose of this slide is to provide details about the firm profitability performance to its executives, business unit managers, product managers etc. So that they can take strategic decisions.
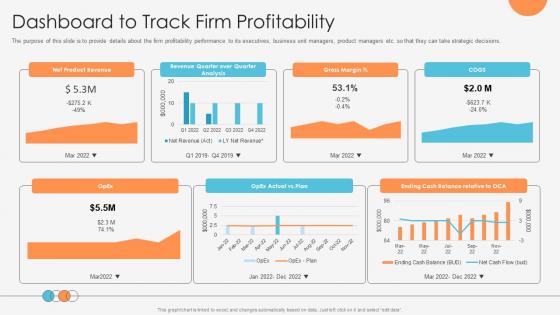
Enhancing Profitability Modelling Dashboard To Track Firm Profitability
The purpose of this slide is to provide details about the firm profitability performance to its executives, business unit managers, product managers etc. so that they can take strategic decisions. From laying roadmaps to briefing everything in detail, our templates are perfect for you. You can set the stage with your presentation slides. All you have to do is download these easy-to-edit and customizable templates. Enhancing Profitability Modelling Dashboard To Track Firm Profitability will help you deliver an outstanding performance that everyone would remember and praise you for. Do download this presentation today. The purpose of this slide is to provide details about the firm profitability performance to its executives, business unit managers, product managers etc. so that they can take strategic decisions.
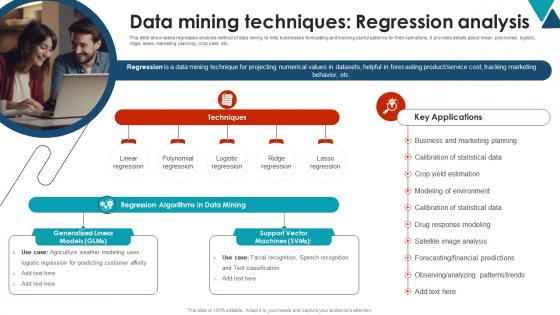
Data Mining Techniques Regression Analysis Using Data Mining Tools To Optimize Processes AI SS V
This slide showcases regression analysis method of data mining to help businesses forecasting and tracking useful patterns for their operations. It provides details about linear, polynomial, logistic, ridge, lasso, marketing planning, crop yield, etc. Presenting this PowerPoint presentation, titled Data Mining Techniques Regression Analysis Using Data Mining Tools To Optimize Processes AI SS V, with topics curated by our researchers after extensive research. This editable presentation is available for immediate download and provides attractive features when used. Download now and captivate your audience. Presenting this Data Mining Techniques Regression Analysis Using Data Mining Tools To Optimize Processes AI SS V. Our researchers have carefully researched and created these slides with all aspects taken into consideration. This is a completely customizable Data Mining Techniques Regression Analysis Using Data Mining Tools To Optimize Processes AI SS V that is available for immediate downloading. Download now and make an impact on your audience. Highlight the attractive features available with our PPTs. This slide showcases regression analysis method of data mining to help businesses forecasting and tracking useful patterns for their operations. It provides details about linear, polynomial, logistic, ridge, lasso, marketing planning, crop yield, etc.
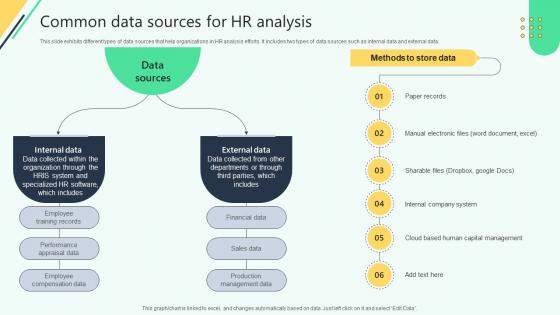
Common Data Sources For Hr Analysis Analysing Hr Data For Effective Decision Making
This slide exhibits different types of data sources that help organizations in HR analysis efforts. It includes two types of data sources such as internal data and external data. From laying roadmaps to briefing everything in detail, our templates are perfect for you. You can set the stage with your presentation slides. All you have to do is download these easy-to-edit and customizable templates. Common Data Sources For Hr Analysis Analysing Hr Data For Effective Decision Making will help you deliver an outstanding performance that everyone would remember and praise you for. Do download this presentation today. This slide exhibits different types of data sources that help organizations in HR analysis efforts. It includes two types of data sources such as internal data and external data.
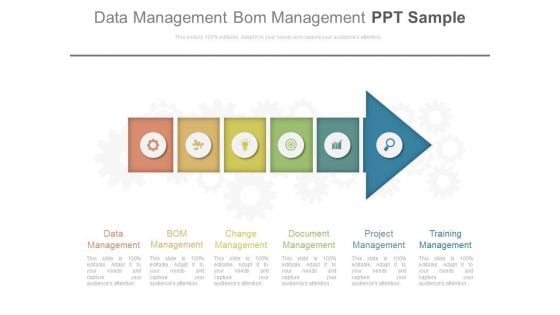
Data Management Bom Management Ppt Sample
This is a data management bom management ppt sample. This is a six stage process. The stages in this process are arrows, business, marketing.
Data Evaluation MaxDiff Analysis Marketing Intelligence Guide Data Gathering Background Pdf
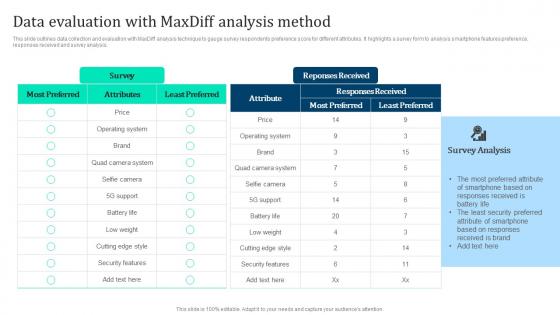
This slide outlines data collection and evaluation with MaxDiff analysis technique to gauge survey respondents preference score for different attributes. It highlights a survey form to analysis smartphone features preference, responses received and survey analysis. Present like a pro with Data Evaluation MaxDiff Analysis Marketing Intelligence Guide Data Gathering Background Pdf Create beautiful presentations together with your team, using our easy to use presentation slides. Share your ideas in real time and make changes on the fly by downloading our templates. So whether you are in the office, on the go, or in a remote location, you can stay in sync with your team and present your ideas with confidence. With Slidegeeks presentation got a whole lot easier. Grab these presentations today. This slide outlines data collection and evaluation with MaxDiff analysis technique to gauge survey respondents preference score for different attributes. It highlights a survey form to analysis smartphone features preference, responses received and survey analysis.


 Continue with Email

 Home
Home


