Finance Chart
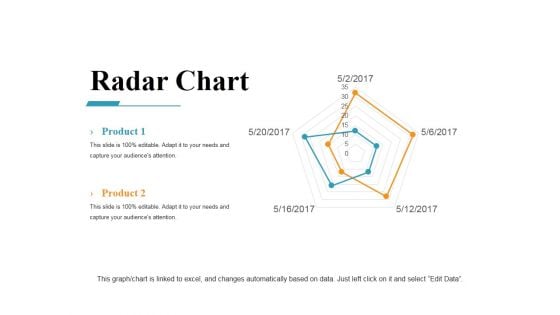
Radar Chart Ppt PowerPoint Presentation Ideas Master Slide
This is a radar chart ppt powerpoint presentation ideas master slide. This is a five stage process. The stages in this process are radar, business, marketing, strategy, finance.
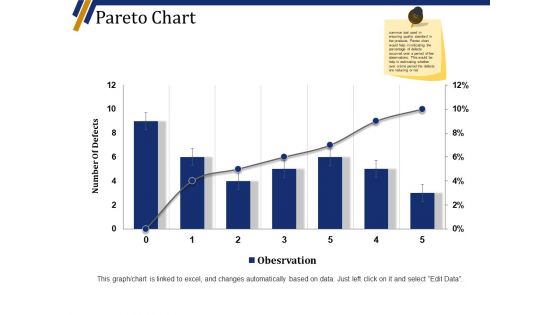
Pareto Chart Ppt PowerPoint Presentation File Infographic Template
This is a pareto chart ppt powerpoint presentation file infographic template. This is a six stage process. The stages in this process are number of defects, business, marketing, graph.
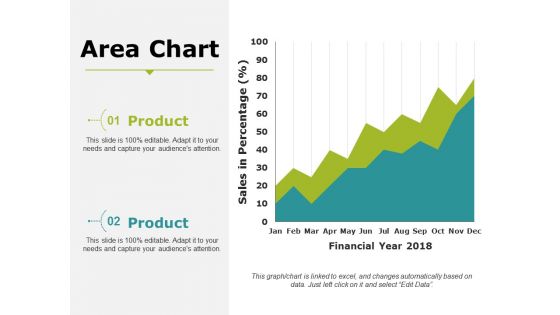
Area Chart Ppt PowerPoint Presentation Infographic Template Portrait
This is a area chart ppt powerpoint presentation infographic template portrait. This is a two stage process. The stages in this process are business, marketing, strategy, planning, finance.
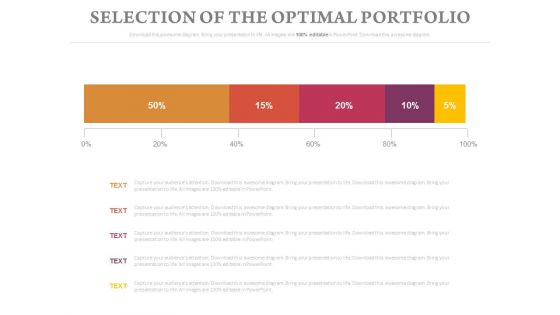
Selection Of The Optimal Portfolio Chart Ppt Slides
This is a selection of the optimal portfolio chart ppt slides. This is a five stage process. The stages in this process are business, finance, marketing.
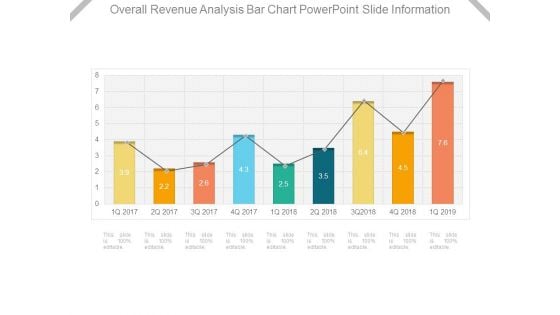
Overall Revenue Analysis Bar Chart Powerpoint Slide Information
This is a overall revenue analysis bar chart powerpoint slide information. This is a nine stage process. The stages in this process are finance, success, business, marketing, percentage.
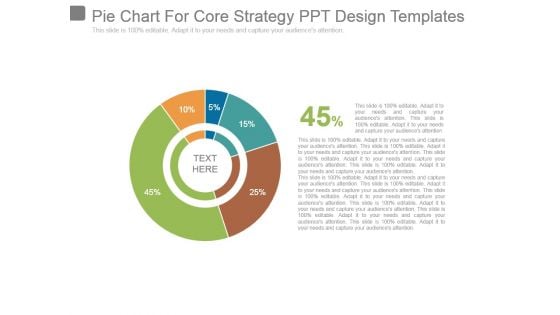
Pie Chart For Core Strategy Ppt Design Templates
This is a pie chart for core strategy ppt design templates. This is a five stage process. The stages in this process are business, marketing, strategy, finance, percentage.
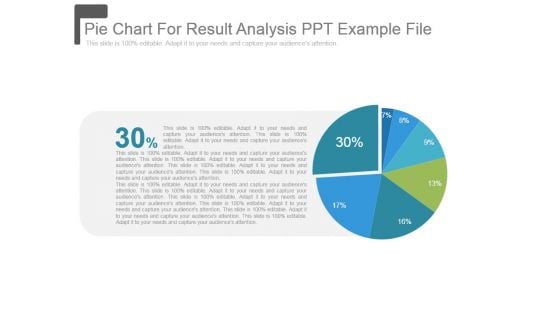
Pie Chart For Result Analysis Ppt Example File
This is a pie chart for result analysis ppt example file. This is a seven stage process. The stages in this process are pie, marketing, strategy, finance, percentage.
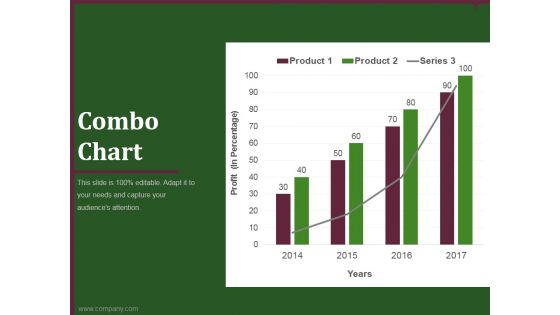
combo chart template 1 ppt powerpoint presentation show
This is a combo chart template 1 ppt powerpoint presentation show. This is a four stage process. The stages in this process are business, marketing, finance, analysis, growth.
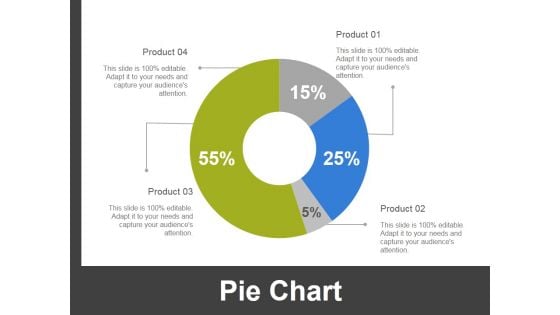
Pie Chart Ppt PowerPoint Presentation Infographic Template Deck
This is a pie chart ppt powerpoint presentation infographic template deck. This is a four stage process. The stages in this process are business, finance, marketing, strategy, analysis.

Area Chart Ppt PowerPoint Presentation Show Graphic Images
This is a area chart ppt powerpoint presentation show graphic images. This is a two stage process. The stages in this process are business, marketing, management, finance, growth.
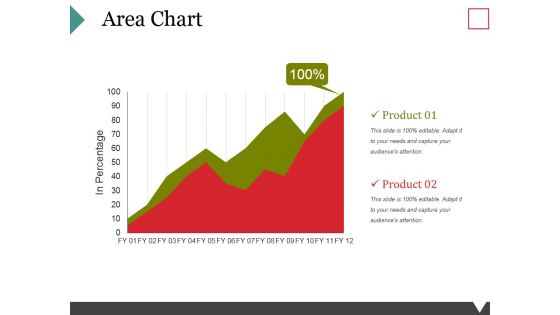
Area Chart Ppt PowerPoint Presentation Gallery Example Topics
This is a area chart ppt powerpoint presentation gallery example topics. This is a two stage process. The stages in this process are product, growth, finance, management, business.
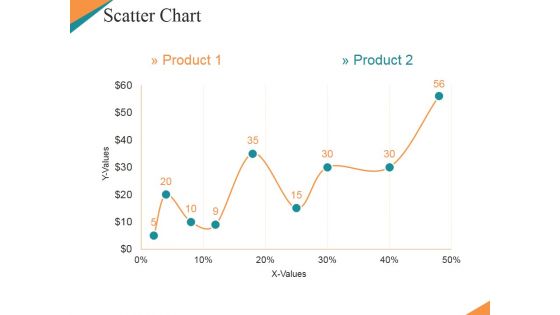
Scatter Chart Ppt PowerPoint Presentation Model Clipart Images
This is a scatter chart ppt powerpoint presentation model clipart images. This is a nine stage process. The stages in this process are finance, management, strategy, marketing, business.
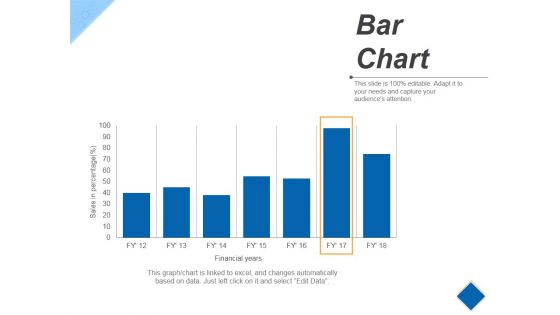
Bar Chart Ppt PowerPoint Presentation Infographic Template Example
This is a bar chart ppt powerpoint presentation infographic template example. This is a seven stage process. The stages in this process are business, finance, marketing, percentage.

Donut Pie Chart Ppt PowerPoint Presentation Professional Templates
This is a donut pie chart ppt powerpoint presentation professional templates. This is a three stage process. The stages in this process are finance, donut, business, marketing, strategy.
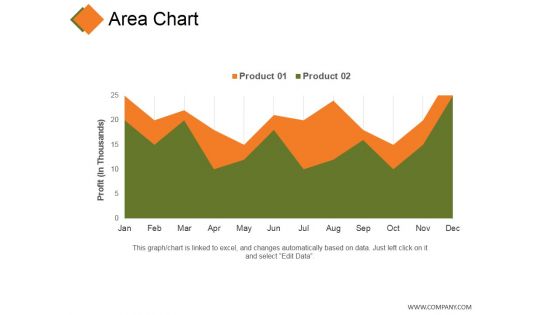
Area Chart Ppt PowerPoint Presentation Gallery Clipart Images
This is a area chart ppt powerpoint presentation gallery clipart images. This is a two stage process. The stages in this process are product, profit, business, finance, marketing.

Donut Pie Chart Ppt PowerPoint Presentation Outline Graphics Example
This is a donut pie chart ppt powerpoint presentation outline graphics example. This is a five stage process. The stages in this process are percentage, finance, donut, business.
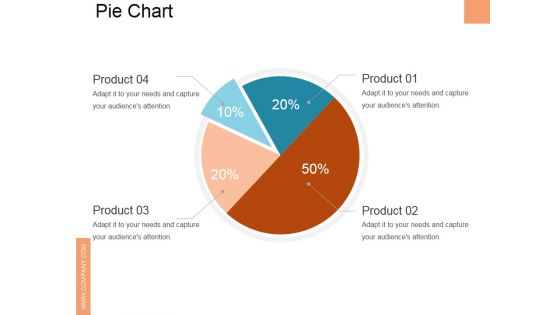
Pie Chart Ppt PowerPoint Presentation Slides Graphics Download
This is a pie chart ppt powerpoint presentation slides graphics download. This is a four stage process. The stages in this process are business, marketing, pie, finance, analysis.
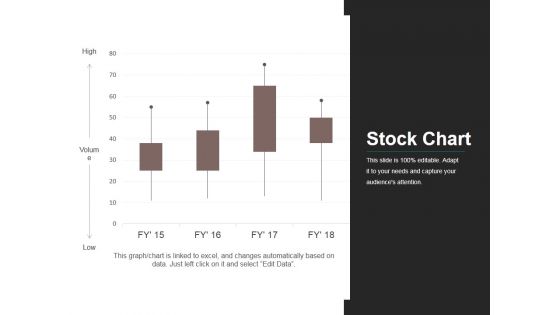
Stock Chart Ppt PowerPoint Presentation Infographic Template Elements
This is a stock chart ppt powerpoint presentation infographic template elements. This is a four stage process. The stages in this process are business, market, stock, finance, analysis.
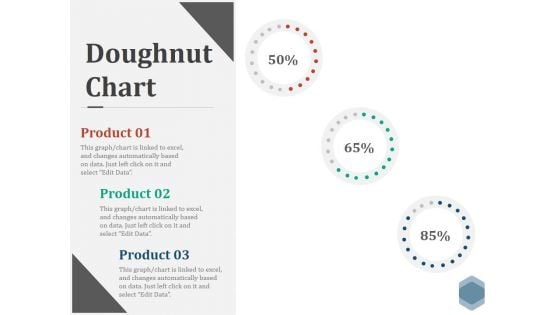
Doughnut Chart Ppt PowerPoint Presentation Visual Aids Files
This is a doughnut chart ppt powerpoint presentation visual aids files. This is a three stage process. The stages in this process are finance, donut, percentage, business, marketing.
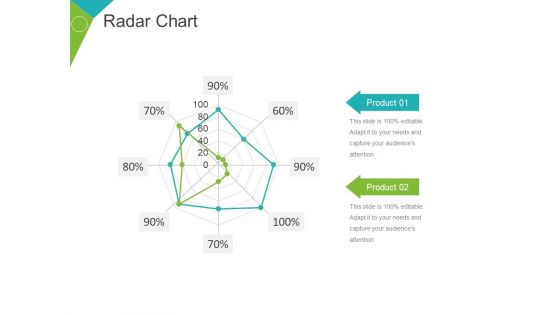
Radar Chart Ppt PowerPoint Presentation Portfolio Design Inspiration
This is a radar chart ppt powerpoint presentation portfolio design inspiration. This is a two stage process. The stages in this process are product, percentage, business, marketing, finance.
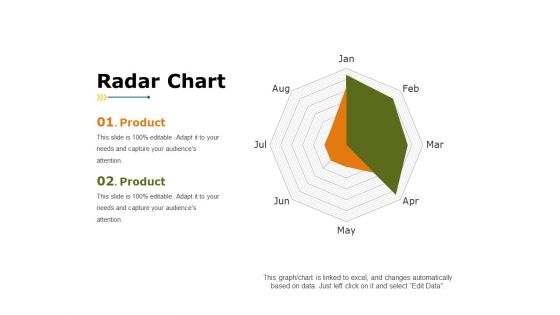
Radar Chart Ppt PowerPoint Presentation Summary Background Designs
This is a radar chart ppt powerpoint presentation summary background designs. This is a two stage process. The stages in this process are product, finance, business, marketing.
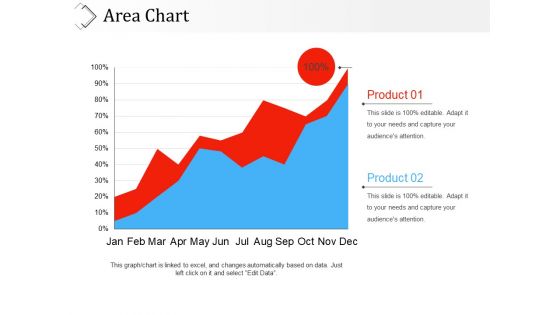
Area Chart Ppt PowerPoint Presentation Model Example Topics
This is a area chart ppt powerpoint presentation model example topics. This is a two stage process. The stages in this process are product, percentage, business, marketing, finance.
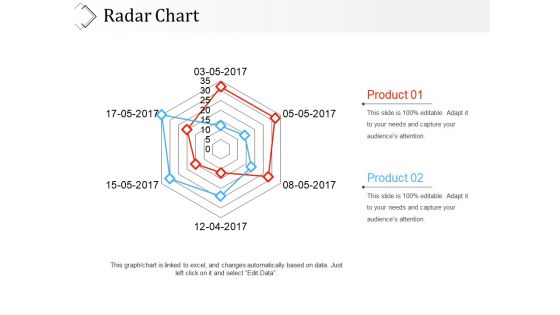
Radar Chart Ppt PowerPoint Presentation File Graphic Tips
This is a radar chart ppt powerpoint presentation file graphic tips. This is a two stage process. The stages in this process are product, finance, marketing, business.
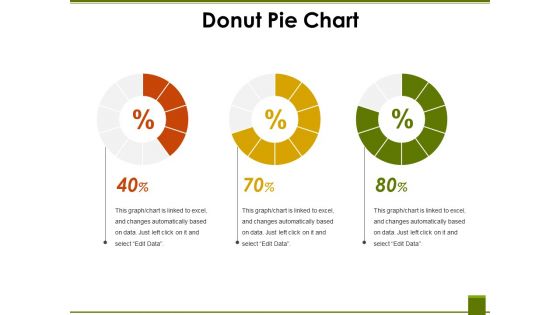
Donut Pie Chart Ppt PowerPoint Presentation File Mockup
This is a donut pie chart ppt powerpoint presentation file mockup. This is a three stage process. The stages in this process are finance, business, percentage, marketing.

Radar Chart Ppt PowerPoint Presentation Summary Slide Portrait
This is a radar chart ppt powerpoint presentation summary slide portrait. This is a two stage process. The stages in this process are product, business, marketing, finance.
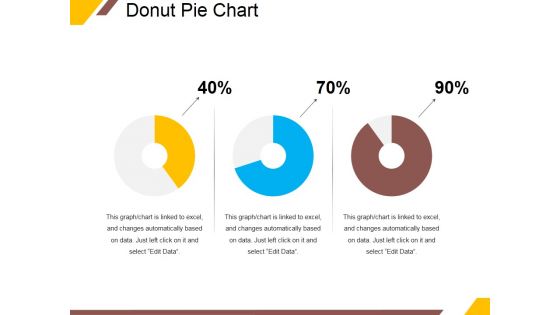
Donut Pie Chart Ppt PowerPoint Presentation Ideas Portrait
This is a donut pie chart ppt powerpoint presentation ideas portrait. This is a three stage process. The stages in this process are percentage, finance, donut, business.
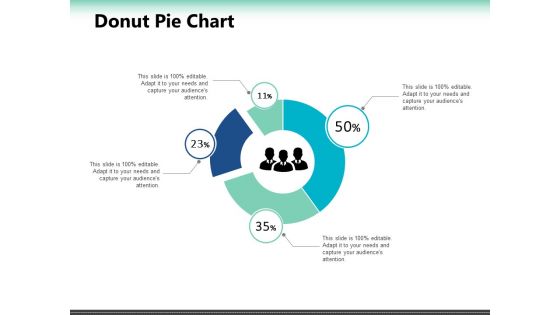
Donut Pie Chart Ppt PowerPoint Presentation Outline Deck
This is a donut pie chart ppt powerpoint presentation outline deck. This is a four stage process. The stages in this process are finance, business, marketing, management, percentage.
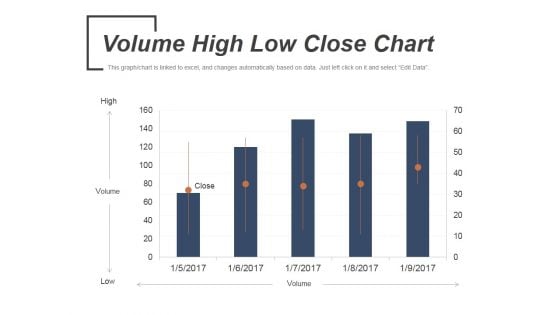
Volume High Low Close Chart Ppt PowerPoint Presentation Slides Portrait
This is a volume high low close chart ppt powerpoint presentation slides portrait. This is a five stage process. The stages in this process are volume, low, high, open, close.
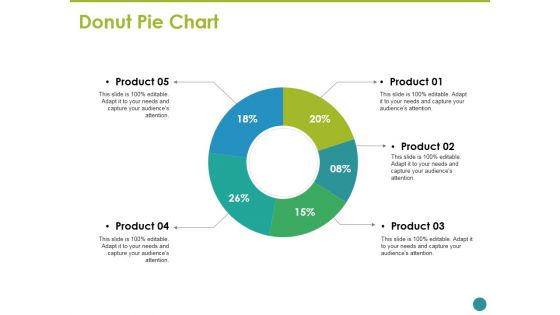
Donut Pie Chart Ppt PowerPoint Presentation Inspiration Graphic Images
This is a donut pie chart ppt powerpoint presentation inspiration graphic images. This is a five stage process. The stages in this process are business, marketing, strategy, planning, donut.
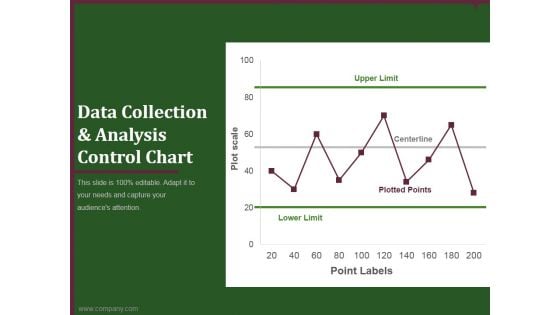
data collection and analysis control chart ppt powerpoint presentation styles
This is a data collection and analysis control chart ppt powerpoint presentation styles. This is a one stage process. The stages in this process are upper limit, centerline, plotted points, lower limit, point labels.
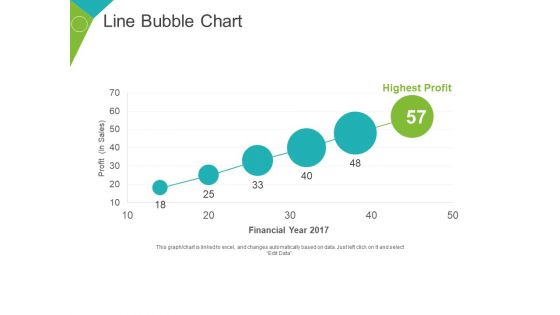
Line Bubble Chart Ppt PowerPoint Presentation Portfolio Slide Portrait
This is a line bubble chart ppt powerpoint presentation portfolio slide portrait. This is a six stage process. The stages in this process are highest profit, financial year, profit in sales, growth, business.
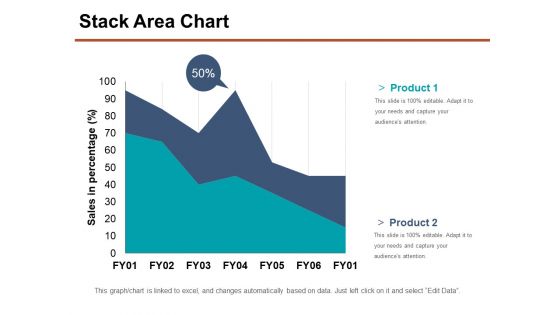
Stack Area Chart Ppt PowerPoint Presentation Show Samples
This is a stack area chart ppt powerpoint presentation show samples. This is a two stage process. The stages in this process are product, sales in percentage, business, marketing, percentage.
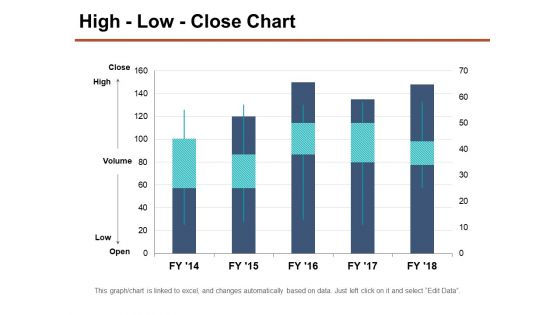
High Low Close Chart Ppt PowerPoint Presentation Layouts Objects
This is a high low close chart ppt powerpoint presentation layouts objects. This is a five stage process. The stages in this process are high, volume, low, business, marketing.
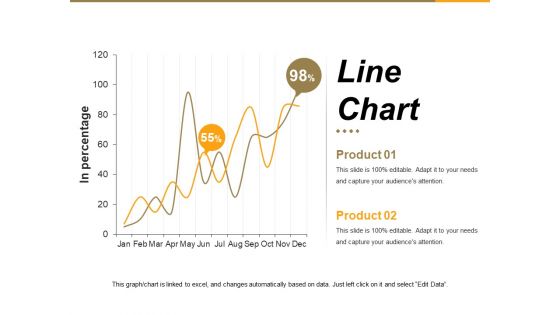
Line Chart Ppt PowerPoint Presentation Summary File Formats
This is a line chart ppt powerpoint presentation summary file formats. This is a two stage process. The stages in this process are in percentage, graph, business, marketing, growth.
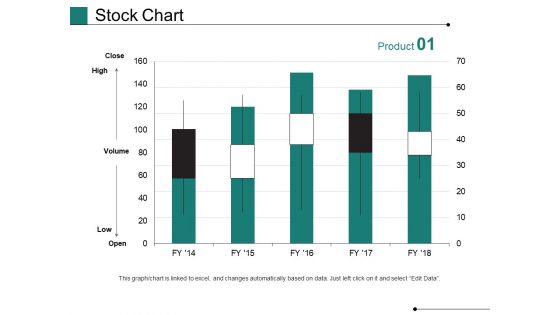
Stock Chart Ppt PowerPoint Presentation Pictures Graphics Design
This is a stock chart ppt powerpoint presentation pictures graphics design. This is a five stage process. The stages in this process are high, volume, low, business, marketing, graph.
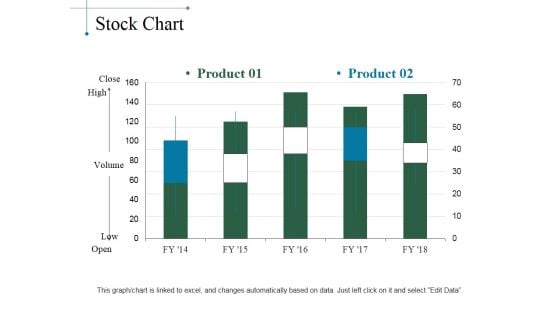
Stock Chart Ppt PowerPoint Presentation Layouts Designs Download
This is a stock chart ppt powerpoint presentation layouts designs download. This is a five stage process. The stages in this process are product, close, high, volume, low, open.
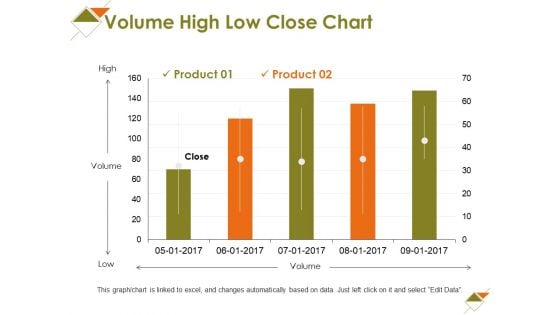
Volume High Low Close Chart Ppt PowerPoint Presentation Slides Styles
This is a volume high low close chart ppt powerpoint presentation slides styles. This is a two stage process. The stages in this process are high, volume, low, business, marketing.
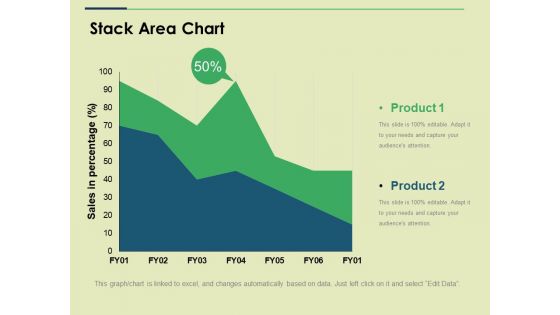
Stack Area Chart Ppt PowerPoint Presentation Show Slide
This is a stack area chart ppt powerpoint presentation show slide. This is a two stage process. The stages in this process are sales in percentage, business, marketing, strategy, graph.
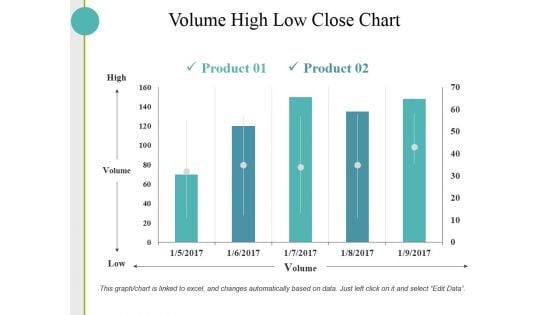
Volume High Low Close Chart Ppt PowerPoint Presentation Inspiration Skills
This is a volume high low close chart ppt powerpoint presentation inspiration skills. This is a two stage process. The stages in this process are high, volume, low, business.
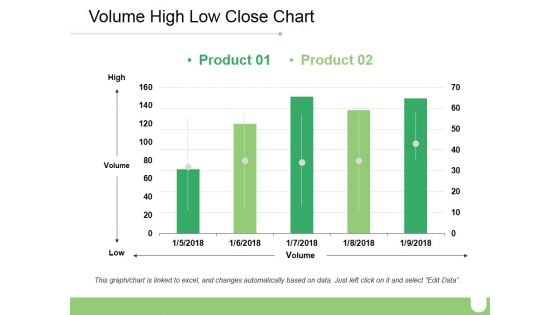
Volume High Low Close Chart Ppt PowerPoint Presentation Inspiration Brochure
This is a volume high low close chart ppt powerpoint presentation inspiration brochure. This is a two stage process. The stages in this process are business, high, volume, low, marketing.
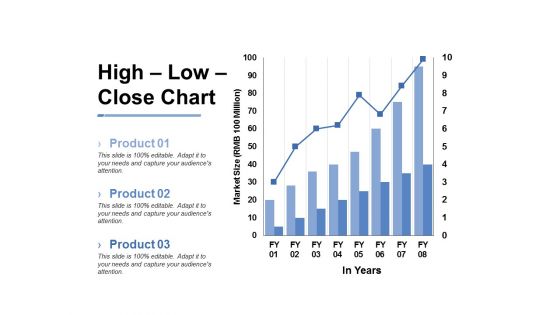
High Low Close Chart Ppt PowerPoint Presentation Inspiration Slide
This is a high low close chart ppt powerpoint presentation inspiration slide. This is a three stage process. The stages in this process are business, marketing, market size, in years, graph.
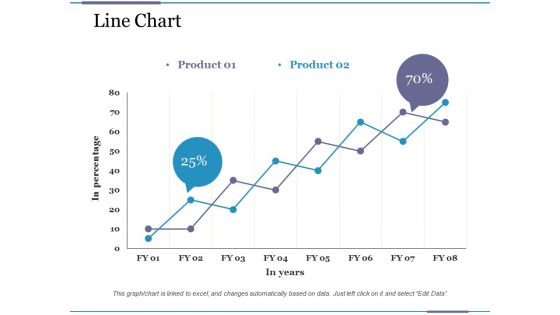
Line Chart Ppt PowerPoint Presentation Pictures File Formats
This is a line chart ppt powerpoint presentation pictures file formats. This is a two stage process. The stages in this process are business, financial, in percentage, in years, graph.
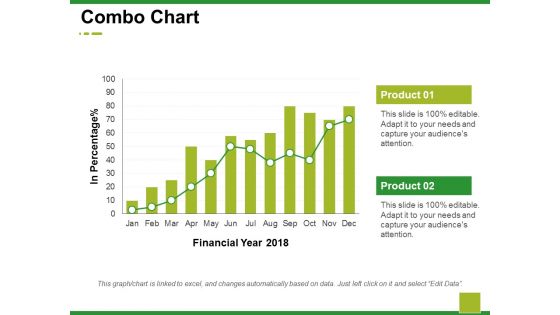
Combo Chart Ppt PowerPoint Presentation Summary Background Images
This is a combo chart ppt powerpoint presentation summary background images. This is a two stage process. The stages in this process are business, marketing, financial year, in percentage, graph.
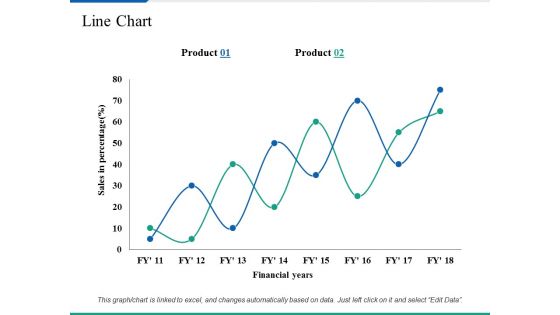
Line Chart Ppt PowerPoint Presentation Summary Clipart Images
This is a line chart ppt powerpoint presentation summary clipart images. This is a two stage process. The stages in this process are business, marketing, sales in percentage, financial years, strategy.
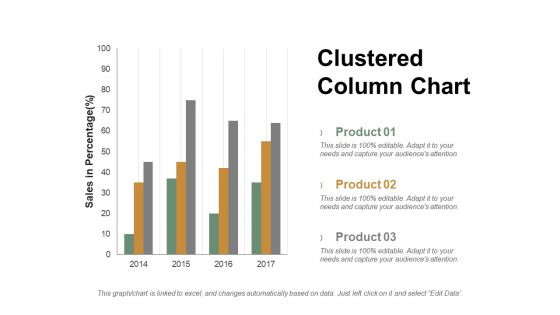
Clustered Column Chart Ppt PowerPoint Presentation Professional Ideas
This is a clustered column chart ppt powerpoint presentation professional ideas. This is a three stage process. The stages in this process are product, sales in percentage, column, years.

Donut Chart Marketing Product Ppt PowerPoint Presentation Slides Background Designs
This is a donut chart marketing product ppt powerpoint presentation slides background designs. This is a three stage process. The stages in this process are business, management, marketing, percentage, product.
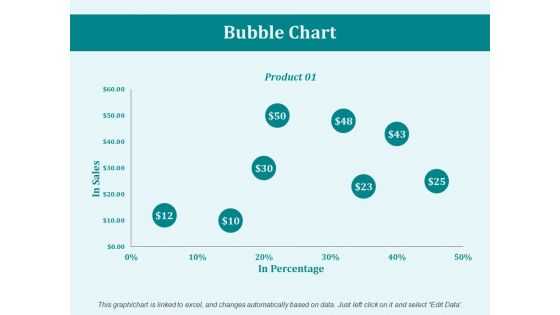
Bubble Chart Product Ppt PowerPoint Presentation Inspiration Design Ideas
This is a bubble chart product ppt powerpoint presentation inspiration design ideas. This is a one stage process. The stages in this process are business, management, marketing, product, percentage.
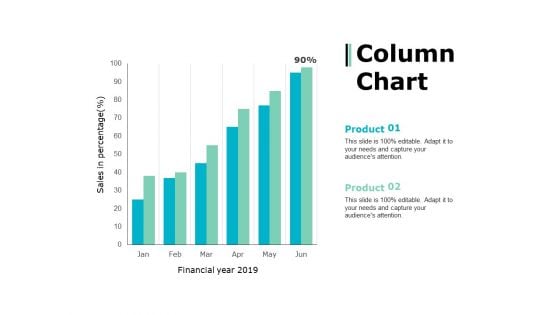
Column Chart Marketing Strategy Ppt PowerPoint Presentation Layouts Slide Portrait
This is a column chart marketing strategy ppt powerpoint presentation layouts slide portrait. This is a two stage process. The stages in this process are percentage, product, business, management, marketing.
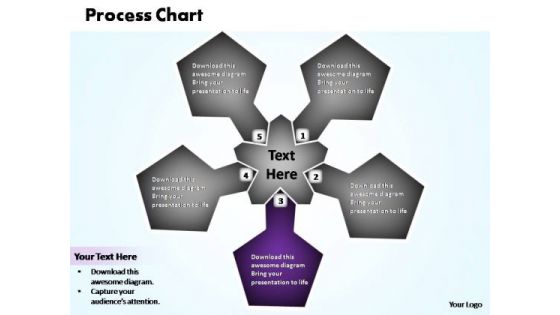
PowerPoint Theme Strategy Business Process Chart Ppt Presentation
This easy to use diagrams can be used for information flow, business process automation, business process re-engineering. Embark upon an epic journey. Chart it out to the last detail on our PowerPoint Theme Strategy Business Process Chart Ppt Presentation.
Email Marketing Performance Chart Ppt PowerPoint Presentation Icon Design Inspiration
This is a email marketing performance chart ppt powerpoint presentation icon design inspiration. This is a nine stage process. The stages in this process are email marketing performance chart, business, marketing, strategy, success.
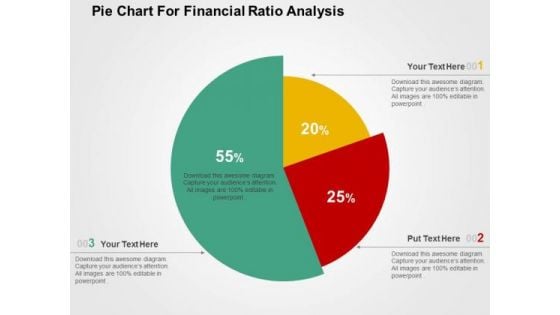
Pie Chart For Financial Ratio Analysis PowerPoint Templates
Create visually amazing presentations with this slide of pie chart. This PPT slide of pie chart for financial ratio analysis. Add this diagram in your presentations to visually support your content.
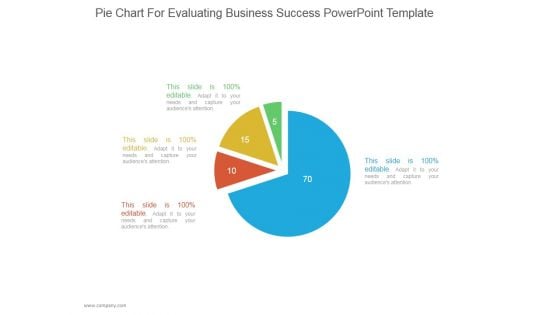
Pie Chart For Evaluating Business Success Ppt PowerPoint Presentation Inspiration
This is a pie chart for evaluating business success ppt powerpoint presentation inspiration. This is a three stage process. The stages in this process are business, strategy, marketing, analysis, pie chart.
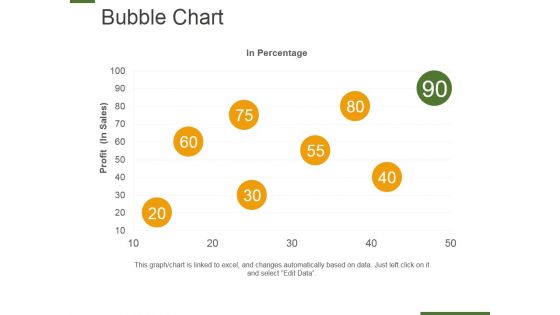
Bubble Chart Ppt PowerPoint Presentation Layouts Design Ideas
This is a bubble chart ppt powerpoint presentation layouts design ideas. This is a eight stage process. The stages in this process are in percentage, profit, bubble chart, business, marketing.

Bubble Chart Ppt PowerPoint Presentation Portfolio Visual Aids
This is a bubble chart ppt powerpoint presentation portfolio visual aids. This is a three stage process. The stages in this process are bubble chart, product, business, marketing, success.
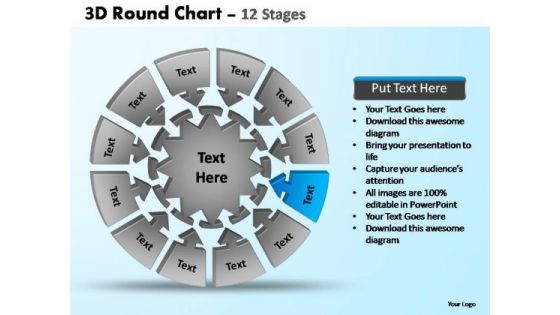
PowerPoint Presentation Designs Leadership Pie Chart With Arrows Ppt Theme
PowerPoint Presentation Designs Leadership Pie Chart with Arrows PPT Theme-These amazing PowerPoint pre-designed slides and PowerPoint templates have been carefully created by our team of experts to help you impress your audience. Our stunning collection of Powerpoint slides are 100% editable and can easily fit in any PowerPoint presentations. By using these animations and graphics in PowerPoint and you can easily make professional presentations. Any text can be entered at any point in the PowerPoint template or slide. Just DOWNLOAD our awesome PowerPoint templates and you are ready to go. Our PowerPoint Presentation Designs Leadership Pie Chart With Arrows Ppt Theme are specially created by professionals. They diligently strive to come up with the right vehicle for your thoughts.

Donut Pie Chart Ppt PowerPoint Presentation File Slideshow
This is a donut pie chart ppt powerpoint presentation file slideshow. This is a four stage process. The stages in this process are business, strategy, analysis, planning, donut pie chart.
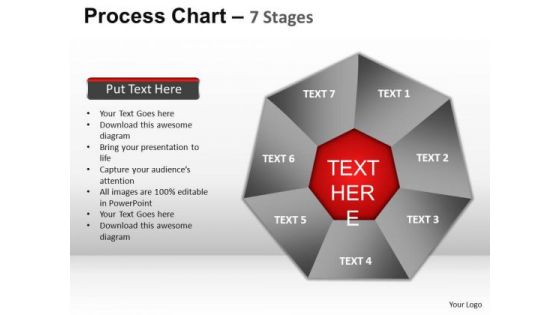
PowerPoint Presentation Designs Company Process Chart Ppt Template
PowerPoint Presentation Designs Company process chart PPT Template-The Circle of Life - a concept emmbedded in our minds and hence easy to comprehend. Life and Business is made up of processes comprising stages that flow from one to another. An excellent graphic to attract the attention of and understanding by your audience to improve earnings.-These amazing PowerPoint pre-designed slides and PowerPoint templates have been carefully created by our team of experts to help you impress your audience. Our stunning collection of Powerpoint slides are 100% editable and can easily fit in any PowerPoint presentations. By using these animations and graphics in PowerPoint and you can easily make professional presentations. Any text can be entered at any point in the PowerPoint template or slide. Just DOWNLOAD our awesome PowerPoint templates and you are ready to go. Institute efficiency with our PowerPoint Presentation Designs Company Process Chart Ppt Template. Download without worries with our money back guaranteee.
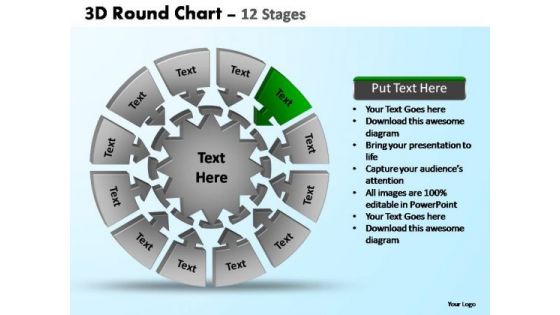
PowerPoint Presentation Diagram Pie Chart With Arrows Ppt Presentation
PowerPoint Presentation Diagram Pie Chart with Arrows PPT Presentation-These amazing PowerPoint pre-designed slides and PowerPoint templates have been carefully created by our team of experts to help you impress your audience. Our stunning collection of Powerpoint slides are 100% editable and can easily fit in any PowerPoint presentations. By using these animations and graphics in PowerPoint and you can easily make professional presentations. Any text can be entered at any point in the PowerPoint template or slide. Just DOWNLOAD our awesome PowerPoint templates and you are ready to go. Our slides are practical and creative. Impress them with our PowerPoint Presentation Diagram Pie Chart With Arrows Ppt Presentation. You'll always stay ahead of the game.
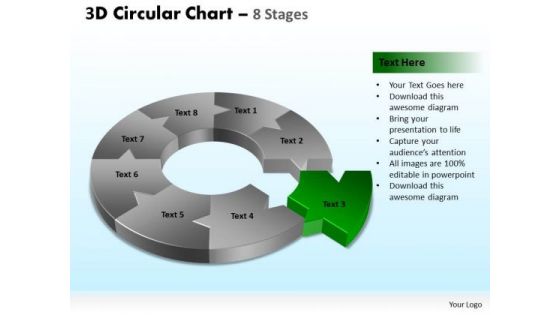
PowerPoint Design Slides Diagram Circular Chart Ppt Designs
PowerPoint Design Slides Diagram circular chart PPT Designs-The Circle of Life - a concept emmbedded in our minds and hence easy to comprehend. Life and Business is made up of processes comprising stages that flow from one to another. An excellent graphic to attract the attention of and understanding by your audience to improve earnings.-These amazing PowerPoint pre-designed slides and PowerPoint templates have been carefully created by our team of experts to help you impress your audience. Our stunning collection of Powerpoint slides are 100% editable and can easily fit in any PowerPoint presentations. By using these animations and graphics in PowerPoint and you can easily make professional presentations. Any text can be entered at any point in the PowerPoint template or slide. Just DOWNLOAD our awesome PowerPoint templates and you are ready to go. Make them smell the coffee with our PowerPoint Design Slides Diagram Circular Chart Ppt Designs. Help them come to the correct conclusion.
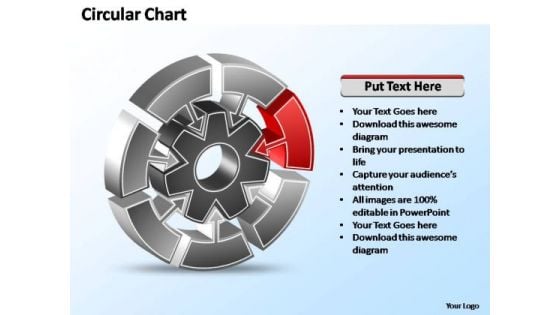
PowerPoint Template Company Interconnected Circular Chart Ppt Slide
Analyze the seven success factors of your business with this circular business chart for Microsoft PowerPoint presentations Our PowerPoint Template Company Interconnected Circular Chart Ppt Slide are great for busy people. They automatically highlight the sequence of events you desire.


 Continue with Email

 Home
Home


