Finance Chart
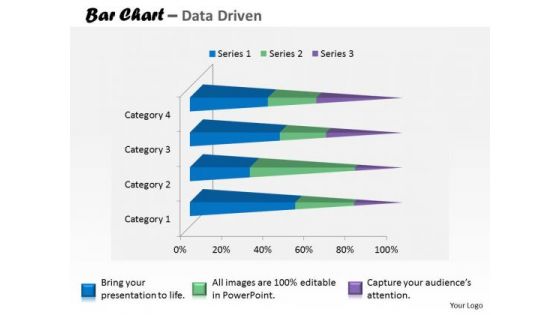
Financial Data Analysis Currency Trading Bar Chart PowerPoint Templates
Put In A Dollop Of Our financial data analysis currency trading bar chart Powerpoint Templates . Give Your Thoughts A Distinctive Flavor.

Microsoft Excel Data Analysis Bar Chart To Handle PowerPoint Templates
Our microsoft excel data analysis bar chart to handle Powerpoint Templates And Your Ideas Make A Great Doubles Pair. Play The Net With Assured Hands.
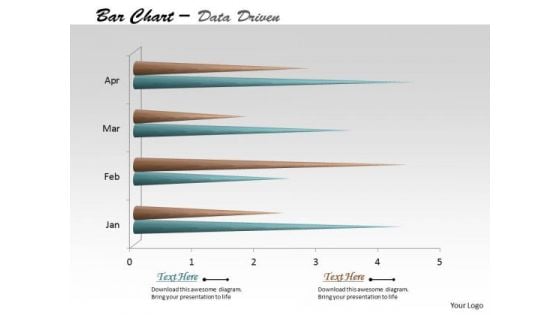
Multivariate Data Analysis Time Based Bar Chart PowerPoint Templates
Edit Your Work With Our multivariate data analysis time based bar chart Powerpoint Templates . They Will Help You Give The Final Form.
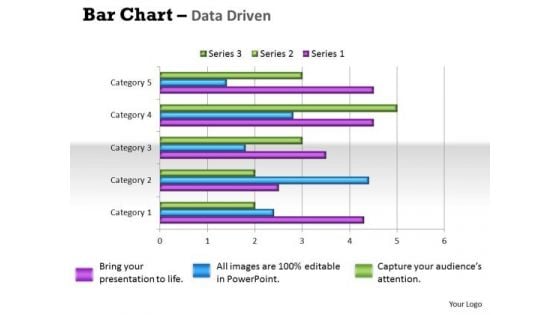
Quantitative Data Analysis Bar Chart For Different Categories PowerPoint Templates
Make Some Dough With Our quantitative data analysis bar chart for different categories Powerpoint Templates . Your Assets Will Rise Significantly.
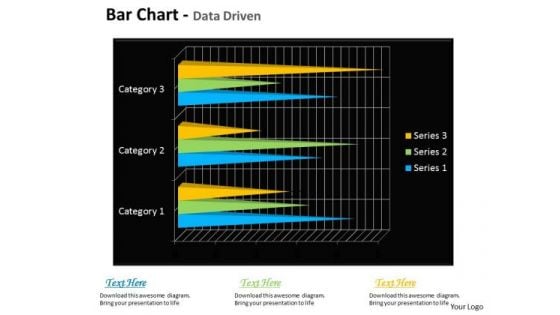
Quantitative Data Analysis Bar Chart For Financial Markets PowerPoint Templates
Draft It Out On Our quantitative data analysis bar chart for financial markets Powerpoint Templates . Give The Final Touches With Your Ideas.
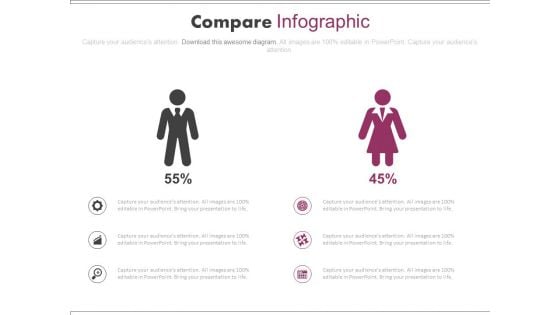
Male Female Employee Skill Assessment Chart Powerpoint Slides
Create visually stunning and define your PPT presentations in a unique and inspiring manner using our above template. It contains male female icons. This business slide helps for male female employee skill assessment. Grab the attention of your team with this eye catching template.
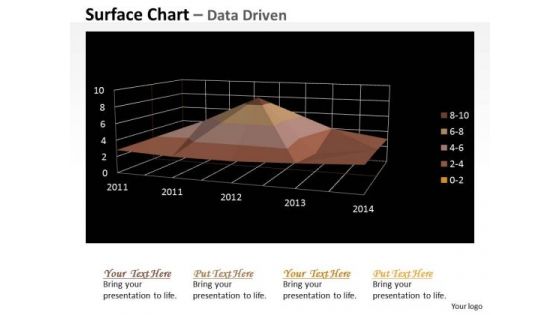
Multivariate Data Analysis Numeric Values Surface Chart PowerPoint Templates
Your Grasp Of Economics Is Well Known. Help Your Audience Comprehend Issues With Our multivariate data analysis numeric values surface chart Powerpoint Templates .
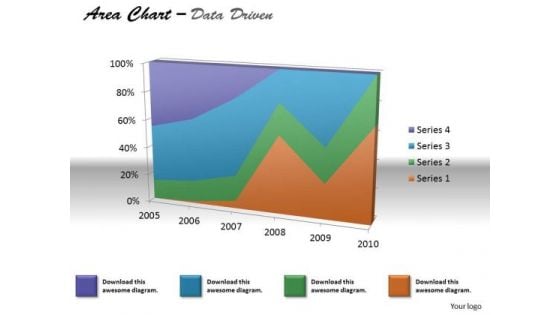
Financial Data Analysis Area Chart For Various Values PowerPoint Templates
Document The Process On Our financial data analysis area chart for various values Powerpoint Templates . Make A Record Of Every Detail.
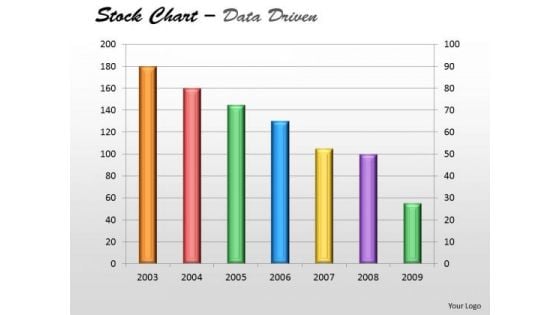
Data Analysis In Excel Of Stock Chart PowerPoint Templates
Plan Your Storyboard With Our data analysis in excel of stock chart Powerpoint Templates . Give An Outline To The Solutions You Have.
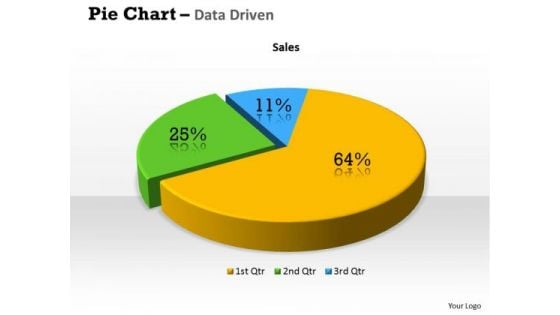
Quantitative Data Analysis 3d Percentage Ratio Pie Chart PowerPoint Templates
Plan Your Storyboard With Our quantitative data analysis 3d percentage ratio pie chart Powerpoint Templates . Give An Outline To The Solutions You Have.
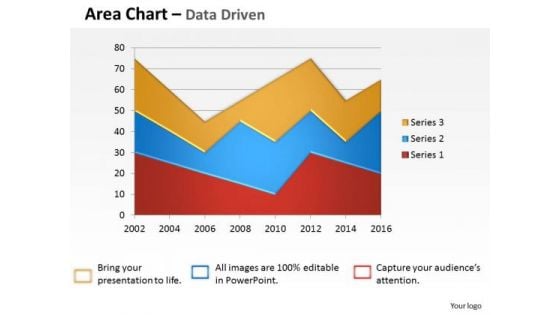
Data Analysis Template Driven Visualization Area Chart PowerPoint Slides Templates
Draw On The Energy Of Our data analysis template driven visualization area chart powerpoint slides Templates . Your Thoughts Will Perk Up.

Business Data Analysis Chart For Case Studies PowerPoint Templates
Get Out Of The Dock With Our business data analysis chart for case studies Powerpoint Templates. Your Mind Will Be Set Free.
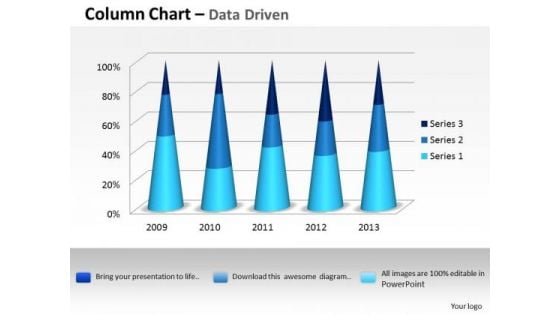
Data Analysis Excel 3d Process Variation Column Chart PowerPoint Templates
Put In A Dollop Of Our data analysis excel 3d process variation column chart Powerpoint Templates. Give Your Thoughts A Distinctive Flavor.
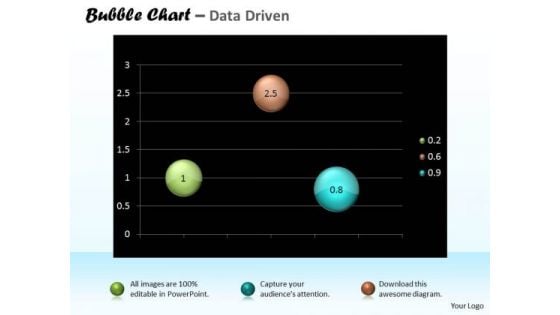
Data Analysis Excel Bubble Chart For Business Tasks PowerPoint Templates
Doll Up Your Thoughts With Our data analysis excel bubble chart for business tasks Powerpoint Templates. They Will Make A Pretty Picture.
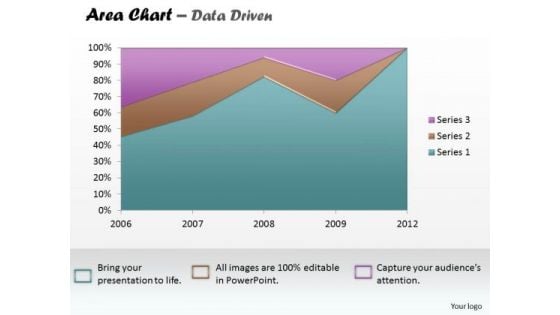
Data Analysis Excel Business Reporting Area Chart PowerPoint Templates
Establish The Dominance Of Your Ideas. Our data analysis excel business reporting area chart Powerpoint Templates Will Put Them On Top.
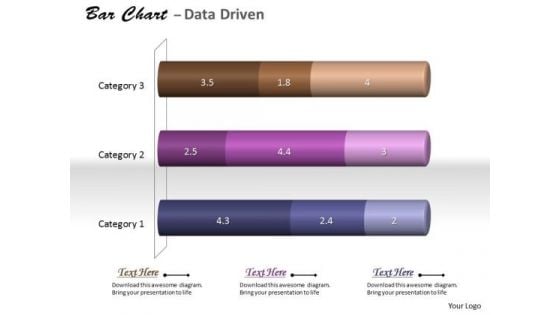
Data Analysis In Excel 3d Classification Of Chart PowerPoint Templates
With Our data analysis in excel 3d classification of chart Powerpoint Templates You Will Be Doubly Sure. They Possess That Stamp Of Authority.
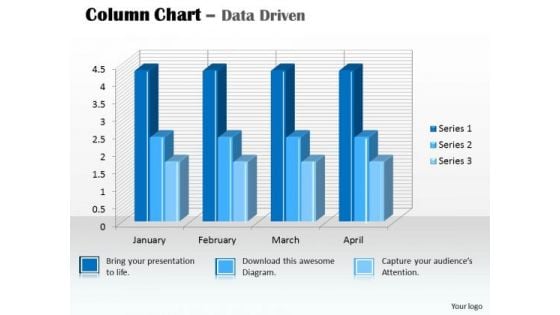
Data Analysis In Excel 3d Column Chart For PowerPoint Templates
Our data analysis in excel 3d column chart for Powerpoint Templates And Your Ideas Make A Great Doubles Pair. Play The Net With Assured Hands.
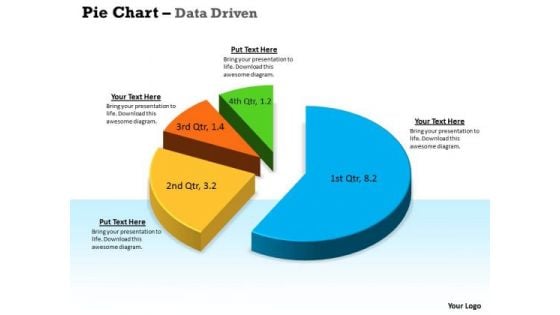
Data Analysis Techniques 3d In Segments Pie Chart PowerPoint Templates
Drink To The Success Of Your Campaign. Our data analysis techniques 3d in segments pie chart Powerpoint Templates Will Raise A Toast.
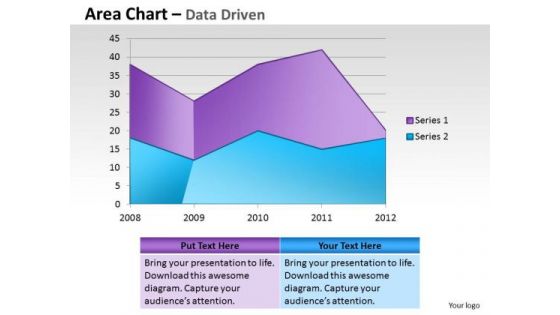
Financial Data Analysis Area Chart For Showing Trends PowerPoint Templates
Document Your Views On Our financial data analysis area chart for showing trends Powerpoint Templates . They Will Create A Strong Impression.
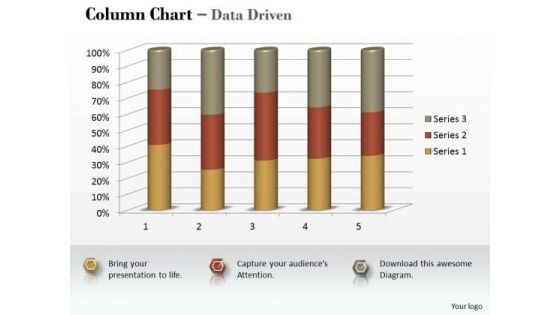
Marketing Data Analysis 3d Statistical Process Column Chart PowerPoint Templates
Be A Donor Of Great Ideas. Display Your Charity On Our marketing data analysis 3d statistical process column chart Powerpoint Templates .
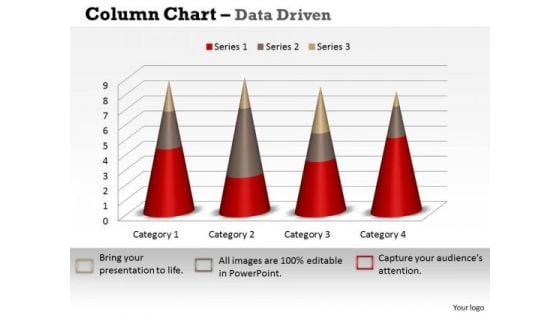
Marketing Data Analysis 3d Statistical Process Control Chart PowerPoint Templates
Open Up Doors That Lead To Success. Our marketing data analysis 3d statistical process control chart Powerpoint Templates Provide The Handles.
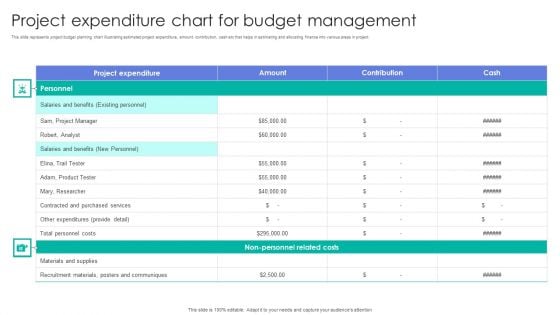
Project Expenditure Chart For Budget Management Graphics PDF
This slide represents project budget planning chart illustrating estimated project expenditure, amount, contribution, cash etc that helps in estimating and allocating finance into various areas in project. Showcasing this set of slides titled Project Expenditure Chart For Budget Management Graphics PDF. The topics addressed in these templates are Materials And Supplies, Recruitment Materials, Costs. All the content presented in this PPT design is completely editable. Download it and make adjustments in color, background, font etc. as per your unique business setting.
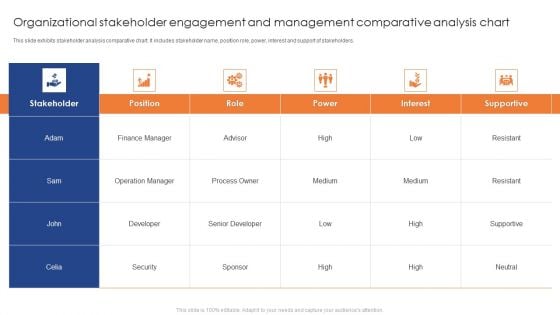
Organizational Stakeholder Engagement And Management Comparative Analysis Chart Professional PDF
This slide exhibits stakeholder analysis comparative chart. It includes stakeholder name, position role, power, interest and support of stakeholders. Showcasing this set of slides titled Organizational Stakeholder Engagement And Management Comparative Analysis Chart Professional PDF. The topics addressed in these templates are Finance Manager, Operation Manager, Developer. All the content presented in this PPT design is completely editable. Download it and make adjustments in color, background, font etc. as per your unique business setting.
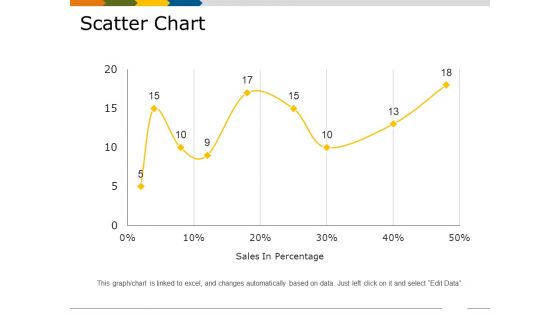
Scatter Chart Template 3 Ppt PowerPoint Presentation Styles Demonstration
This is a scatter chart template 3 ppt powerpoint presentation styles demonstration. This is a one stage process. The stages in this process are sales in percentage, finance, business, marketing, growth.
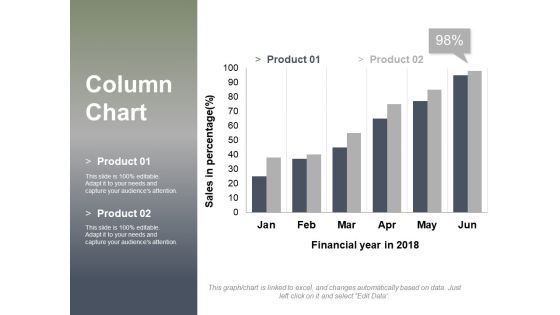
Column Chart Ppt PowerPoint Presentation Layouts Design Inspiration
This is a column chart ppt powerpoint presentation layouts design inspiration. This is a two stage process. The stages in this process are sales in percentage, financial year in, graph, business, finance, marketing.
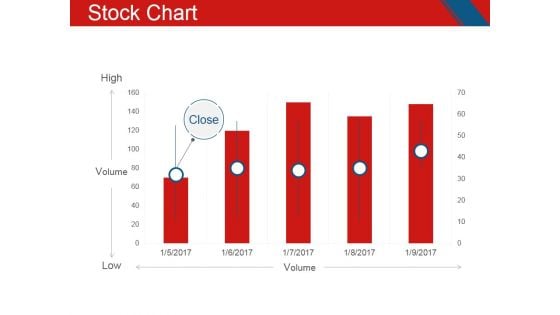
Stock Chart Ppt PowerPoint Presentation Inspiration Graphics Design
This is a stock chart ppt powerpoint presentation inspiration graphics design. This is a five stage process. The stages in this process are high, volume, low.
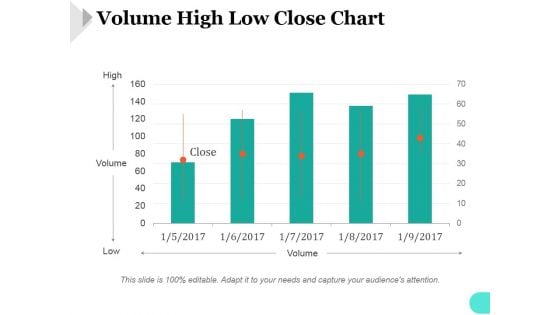
Volume High Low Close Chart Ppt PowerPoint Presentation Show
This is a volume high low close chart ppt powerpoint presentation show. This is a five stage process. The stages in this process are high, volume, low.
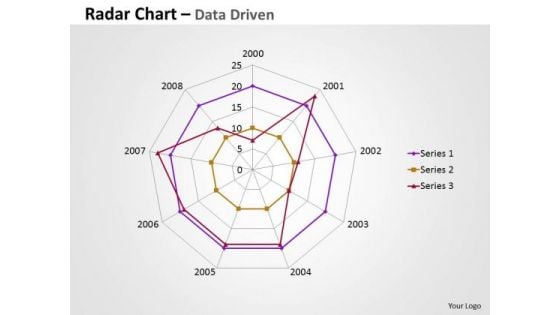
Business Data Analysis Chart Comparing Multiple Entities PowerPoint Templates
Analyze Ailments On Our business data analysis chart comparing multiple entities Powerpoint Templates. Bring Out The Thinking Doctor In You. Dock Your Thoughts With Our Financial Analysis . They Will Launch Them Into Orbit.
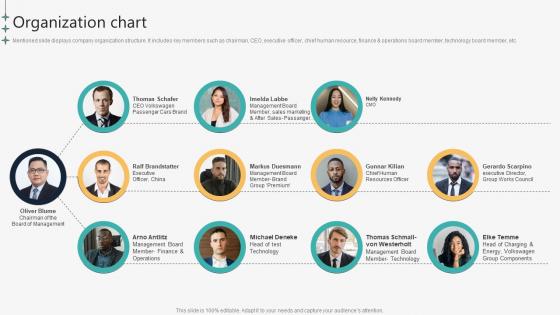
Organization Chart Automotive Manufacturing Company Profile CP SS V
Mentioned slide displays company organization structure. It includes key members such as chairman, CEO, executive officer, chief human resource, finance and operations board member, technology board member, etc.Slidegeeks has constructed Organization Chart Automotive Manufacturing Company Profile CP SS V after conducting extensive research and examination. These presentation templates are constantly being generated and modified based on user preferences and critiques from editors. Here, you will find the most attractive templates for a range of purposes while taking into account ratings and remarks from users regarding the content. This is an excellent jumping-off point to explore our content and will give new users an insight into our top-notch PowerPoint Templates. Mentioned slide displays company organization structure. It includes key members such as chairman, CEO, executive officer, chief human resource, finance and operations board member, technology board member, etc.
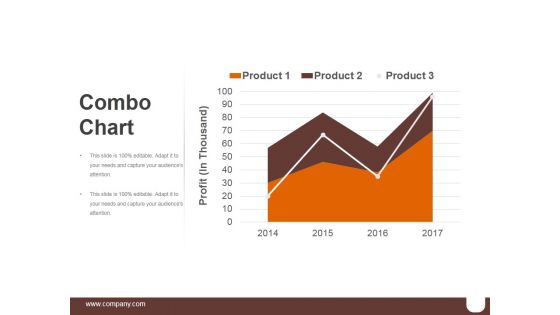
Combo Chart Template 2 Ppt PowerPoint Presentation Graphics
This is a combo chart template 2 ppt powerpoint presentation graphics. This is a three stage process. The stages in this process are business, marketing, finance, growth, management.
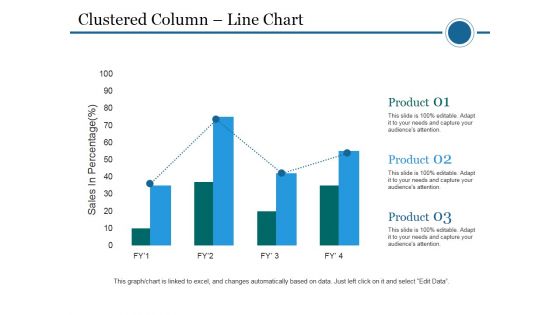
Clustered Column Line Chart Ppt PowerPoint Presentation File Pictures
This is a clustered column line chart ppt powerpoint presentation file pictures. This is a four stage process. The stages in this process are clustered bar, product, planning, business, sales in percentage.
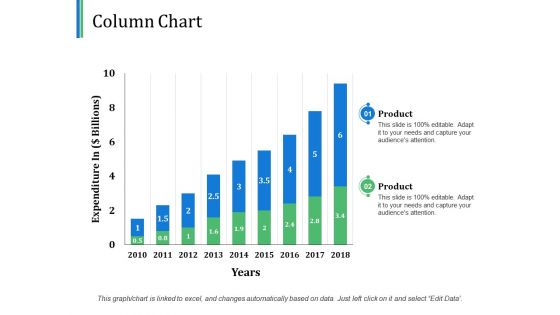
Column Chart Financial Ppt PowerPoint Presentation Outline Design Templates
This is a column chart financial ppt powerpoint presentation outline design templates. This is a two stage process. The stages in this process are financial, business, marketing, planning, strategy.
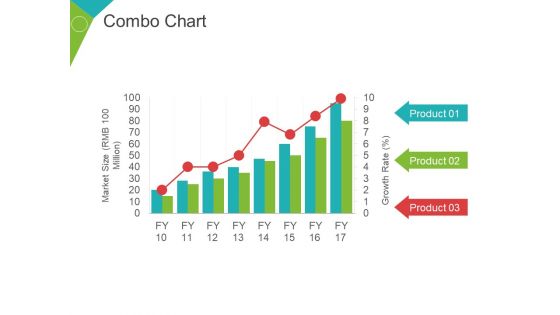
Combo Chart Ppt PowerPoint Presentation Infographic Template Graphic Images
This is a combo chart ppt powerpoint presentation infographic template graphic images. This is a three stage process. The stages in this process are market size, growth rate, percentage, business, marketing.
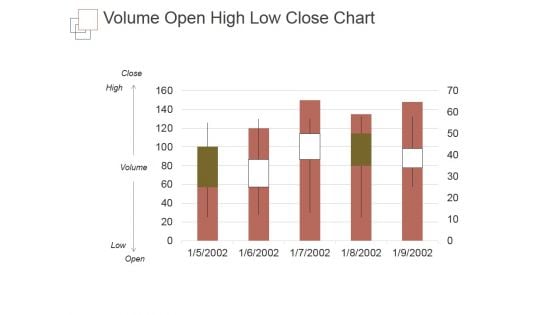
Volume Open High Low Close Chart Ppt PowerPoint Presentation Sample
This is a volume open high low close chart ppt powerpoint presentation sample. This is a five stage process. The stages in this process are close, volume, high, low, open.
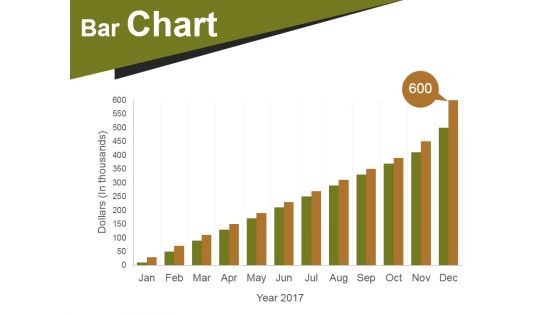
Bar Chart Ppt PowerPoint Presentation Infographics Designs Download
This is a bar chart ppt powerpoint presentation infographics designs download. This is a twelve stage process. The stages in this process are bar chart, business, marketing, strategy, success.
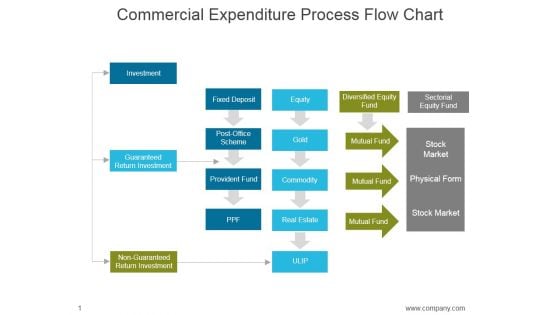
Commercial Expenditure Process Flow Chart Ppt PowerPoint Presentation Microsoft
This is a commercial expenditure process flow chart ppt powerpoint presentation microsoft. This is a four stage process. The stages in this process are investment, guaranteed return investment, non guaranteed return investment, fixed deposit, equity, diversified equity fund, sectorial equity fund, gold.
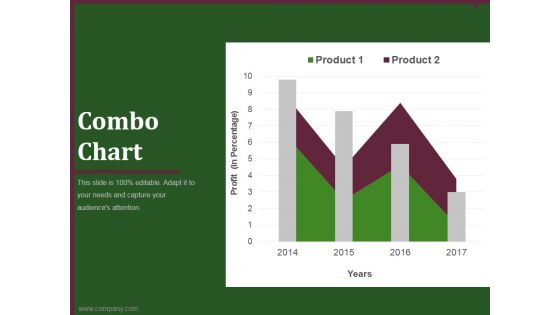
combo chart template 2 ppt powerpoint presentation background images
This is a combo chart template 2 ppt powerpoint presentation background images. This is a four stage process. The stages in this process are business, marketing, finance, timeline, product.
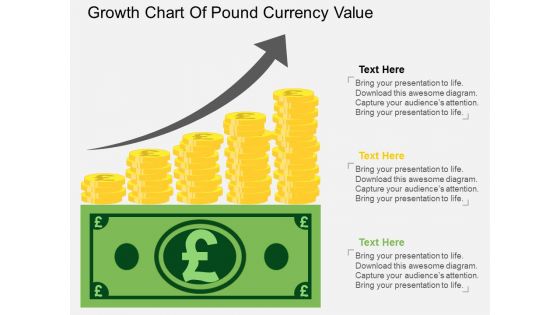
Growth Chart Of Pound Currency Value Powerpoint Template
The above PPT template displays growth chart of Pound currency. This diagram helps to exhibit Pound currency value growth. Adjust the above diagram in your business presentations to visually support your content.
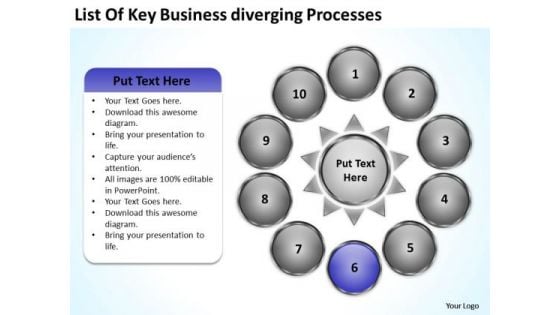
Nine Stages Diverging Factors Flow Chart Circular Network PowerPoint Templates
We present our nine stages diverging factors flow chart Circular Network PowerPoint templates.Use our Ring Charts PowerPoint Templates because they enhance the essence of your viable ideas. Download our Process and Flows PowerPoint Templates because it depicts Rolling along while gathering profits along the way is the aim. Use our Circle charts PowerPoint Templates because you should Emphasise the process of your business or corporate growth. Use our Arrows PowerPoint Templates because by using this slide you can Heighten the anticipation of your audience listing . Download and present our Success PowerPoint Templates because your brain is always churning out ideas like cogs in a wheel.Use these PowerPoint slides for presentations relating to Communication,competition, development, diagram,direction, element, finance, financial,forward, graphic, growth, guide,increase, investment, leader, leadership,management, marketing, motion,moving, organization, path, plan,presentation, price, profit, progress,report, representation, shape, sign. The prominent colors used in the PowerPoint template are Purple, Gray, White. People tell us our nine stages diverging factors flow chart Circular Network PowerPoint templates will save the presenter time. Customers tell us our finance PowerPoint templates and PPT Slides are Romantic. Professionals tell us our nine stages diverging factors flow chart Circular Network PowerPoint templates are topically designed to provide an attractive backdrop to any subject. Presenters tell us our element PowerPoint templates and PPT Slides will make the presenter successul in his career/life. Use our nine stages diverging factors flow chart Circular Network PowerPoint templates are readymade to fit into any presentation structure. Presenters tell us our finance PowerPoint templates and PPT Slides are designed by professionals You will be held in high esteem. Use our Nine Stages Diverging Factors Flow Chart Circular Network PowerPoint Templates as a coat-of-arms.
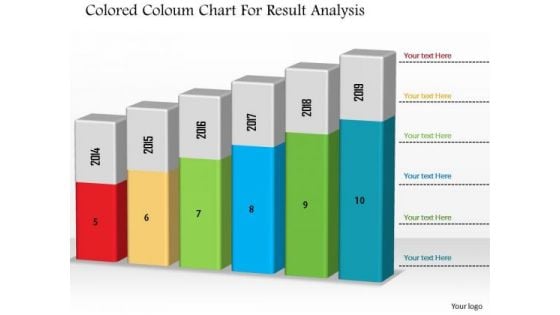
Business Diagram Colored Column Chart For Result Analysis PowerPoint Slide
This Power Point diagram has been designed with graphic of column chart. It contains diagram of bar char depicting annual business progress report. Use this diagram to build professional presentations for your viewers.
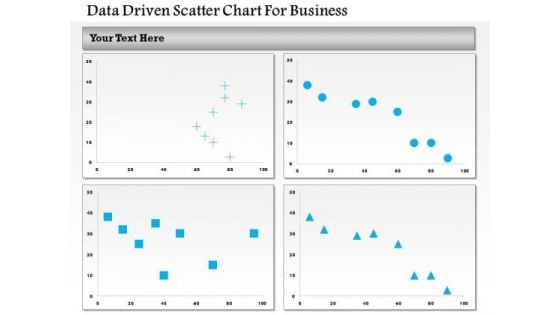
Business Diagram Data Driven Scatter Chart For Business PowerPoint Slide
This business diagram has been designed with four comparative charts. This slide suitable for data representation. You can also use this slide to present business analysis and reports. Use this diagram to present your views in a wonderful manner.
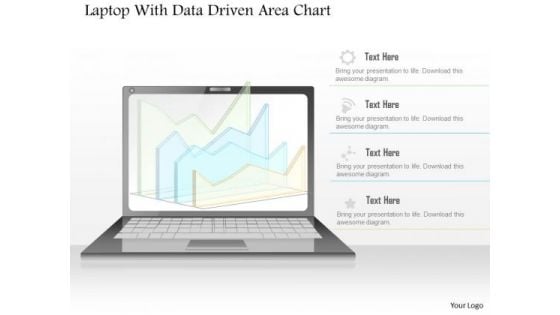
Business Diagram Laptop With Data Driven Area Chart PowerPoint Slide
This diagram has been designed with laptop and data driven area chart. Download this diagram to give your presentations more effective look. It helps in clearly conveying your message to clients and audience.
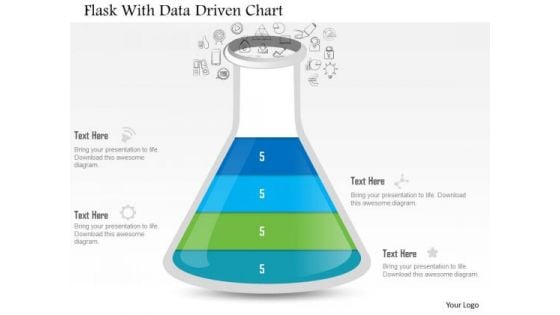
Business Diagram Flask With Data Driven Chart PowerPoint Slide
This data driven diagram has been designed with flask graphics. Download this diagram to give your presentations more effective look. It helps in clearly conveying your message to clients and audience.
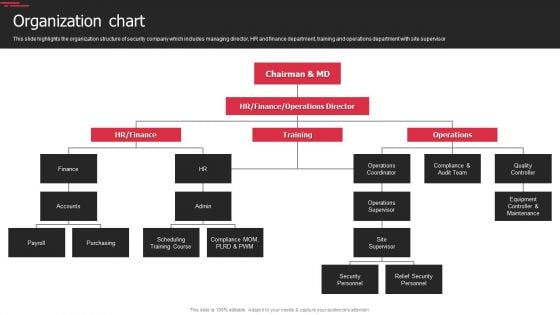
Security Agency Business Profile Organization Chart Topics PDF
This slide highlights the organization structure of security company which includes managing director, HR and finance department, training and operations department with site supervisor. This is a Security Agency Business Profile Organization Chart Topics PDF template with various stages. Focus and dispense information on six stages using this creative set, that comes with editable features. It contains large content boxes to add your information on topics like Operations Supervisor, Security Personnel, Relief Security Personnel. You can also showcase facts, figures, and other relevant content using this PPT layout. Grab it now.
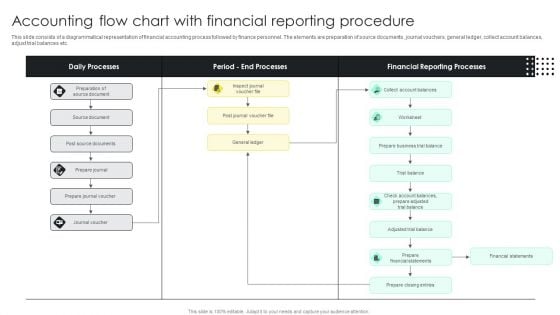
Accounting Flow Chart With Financial Reporting Procedure Clipart PDF
This slide consists of a diagrammatical representation of financial accounting process followed by finance personnel. The elements are preparation of source documents, journal vouchers, general ledger, collect account balances, adjust trial balances etc. Showcasing this set of slides titled Accounting Flow Chart With Financial Reporting Procedure Clipart PDF. The topics addressed in these templates are Source Document, Prepare Journal, Journal Voucher . All the content presented in this PPT design is completely editable. Download it and make adjustments in color, background, font etc. as per your unique business setting.
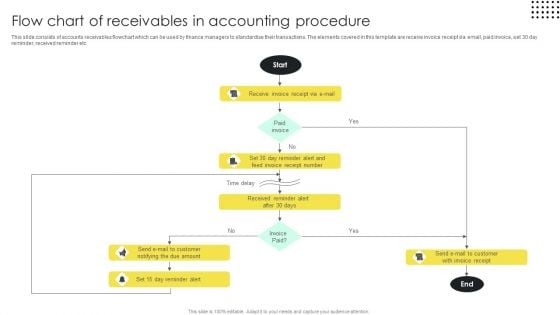
Flow Chart Of Receivables In Accounting Procedure Brochure PDF
This slide consists of accounts receivables flowchart which can be used by finance managers to standardise their transactions. The elements covered in this template are receive invoice receipt via email, paid invoice, set 30 day reminder, received reminder etc. Pitch your topic with ease and precision using this Flow Chart Of Receivables In Accounting Procedure Brochure PDF. This layout presents information on Reminder Alert, Invoice Receipt, Procedure. It is also available for immediate download and adjustment. So, changes can be made in the color, design, graphics or any other component to create a unique layout.
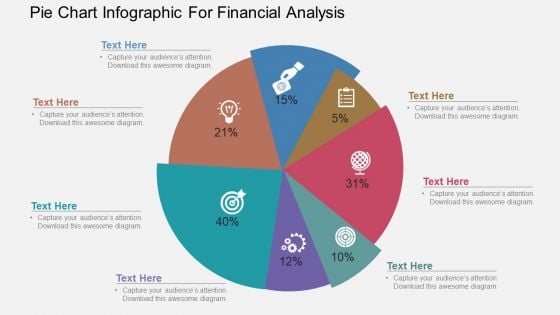
Pie Chart Infographic For Financial Analysis Powerpoint Template
Our above PowerPoint template has been designed with pie chart infographic. This slide is suitable to present financial analysis. Use this business diagram to present your work in a more smart and precise manner.
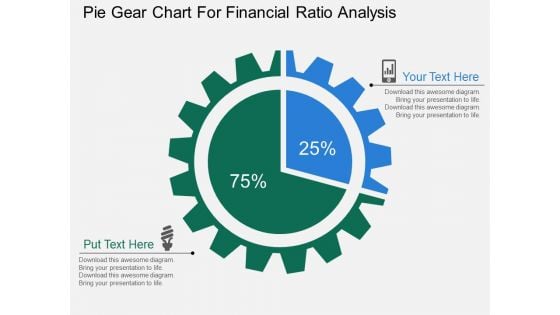
Pie Gear Chart For Financial Ratio Analysis Powerpoint Templates
This PPT slide displays diagram of pie gear chart. This PowerPoint template has been designed to exhibit financial ratio analysis. You can present your opinions using this impressive slide

Colorful Bar Pie Chart Success PowerPoint Templates Ppt Backgrounds For Slides 1212
We present our Colorful Bar Pie Chart Success PowerPoint Templates PPT Backgrounds For Slides 1212.Download our Marketing PowerPoint Templates because networking is an imperative in todays world. You need to access the views of others. Similarly you need to give access to them of your abilities. Download our Finance PowerPoint Templates because you envisage some areas of difficulty in the near future. The overall financial situation could be a source of worry. Download our Pie charts PowerPoint Templates because you have a handle on all the targets, a master of the game, the experienced and consummate juggler. Download and present our Business PowerPoint Templates because maximising sales of your product is the intended destination. Download and present our Success PowerPoint Templates because the choices you make today will determine the future growth of your enterprise.Use these PowerPoint slides for presentations relating to Shiny bar graph and pie chart, business, marketing, finance, pie charts, success. The prominent colors used in the PowerPoint template are Pink, Green, Blue. Customers tell us our Colorful Bar Pie Chart Success PowerPoint Templates PPT Backgrounds For Slides 1212 look good visually. Presenters tell us our business PowerPoint templates and PPT Slides are Appealing. Use our Colorful Bar Pie Chart Success PowerPoint Templates PPT Backgrounds For Slides 1212 are incredible easy to use. PowerPoint presentation experts tell us our marketing PowerPoint templates and PPT Slides are Zippy. Customers tell us our Colorful Bar Pie Chart Success PowerPoint Templates PPT Backgrounds For Slides 1212 are Zippy. Presenters tell us our business PowerPoint templates and PPT Slides are Wonderful. Our Colorful Bar Pie Chart Success PowerPoint Templates Ppt Backgrounds For Slides 1212 are evidently advantageous. The balance will tilt in your favour.
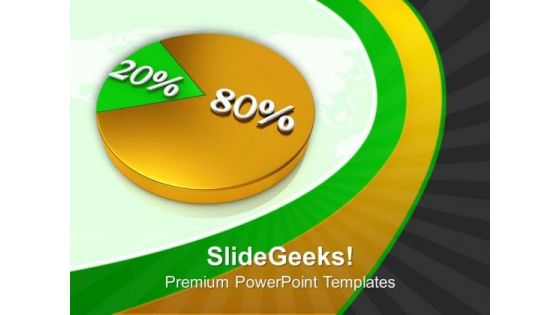
Pie Chart 80 20 Percent Growth PowerPoint Templates Ppt Backgrounds For Slides 0213
We present our Pie Chart 80 20 Percent Growth PowerPoint Templates PPT Backgrounds For Slides 0213.Download and present our Business PowerPoint Templates because It can Conjure up grand ideas with our magical PowerPoint Templates and Slides. Leave everyone awestruck by the end of your presentation. Use our Marketing PowerPoint Templates because You aspire to touch the sky with glory. Let our PowerPoint Templates and Slides provide the fuel for your ascent. Download and present our Finance PowerPoint Templates because You will get more than you ever bargained for. Download our Circle Charts PowerPoint Templates because It can Bubble and burst with your ideas. Present our Success PowerPoint Templates because Timeline crunches are a fact of life. Meet all deadlines using our PowerPoint Templates and Slides.Use these PowerPoint slides for presentations relating to Pie Chart 80 20 Percent, business, marketing, finance, circle charts, success. The prominent colors used in the PowerPoint template are Green, Yellow, White. Achieve high-performance with our Pie Chart 80 20 Percent Growth PowerPoint Templates Ppt Backgrounds For Slides 0213. They will make you look good.
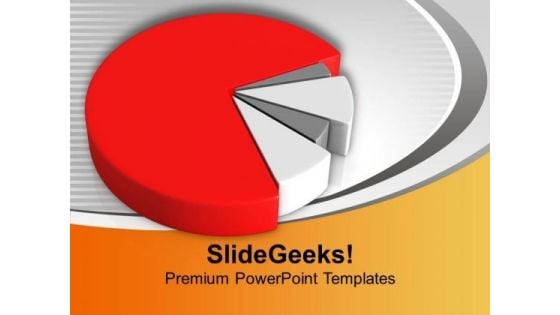
Horizontal Pie Chart For Variation In Values PowerPoint Templates Ppt Backgrounds For Slides 0313
We present our Horizontal Pie Chart For Variation In Values PowerPoint Templates PPT Backgrounds For Slides 0313.Use our Finance PowerPoint Templates because They will Put your wonderful verbal artistry on display. Our PowerPoint Templates and Slides will provide you the necessary glam and glitter. Present our Marketing PowerPoint Templates because You can Double your output with our PowerPoint Templates and Slides. They make beating deadlines a piece of cake. Download and present our Business PowerPoint Templates because Our PowerPoint Templates and Slides come in all colours, shades and hues. They help highlight every nuance of your views. Download our Puzzles or Jigsaws PowerPoint Templates because You can Stir your ideas in the cauldron of our PowerPoint Templates and Slides. Cast a magic spell on your audience. Download our Pie charts PowerPoint Templates because They will Put your wonderful verbal artistry on display. Our PowerPoint Templates and Slides will provide you the necessary glam and glitter.Use these PowerPoint slides for presentations relating to Pie chart, finance, business, marketing, money, pie chart. The prominent colors used in the PowerPoint template are Red, Gray, Black. Use our Horizontal Pie Chart For Variation In Values PowerPoint Templates Ppt Backgrounds For Slides 0313 to brainstorm. You will be amazed at the ideas that emerge.
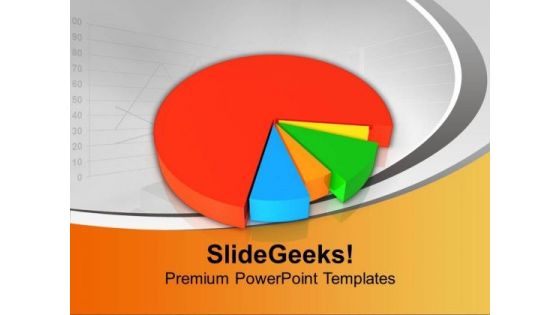
Pie Chart For Marketing And Business PowerPoint Templates Ppt Backgrounds For Slides 0413
We present our Pie Chart For Marketing And Business PowerPoint Templates PPT Backgrounds For Slides 0413.Present our Finance PowerPoint Templates because you should once Tap the ingenuity of our PowerPoint Templates and Slides. They are programmed to succeed. Download and present our Marketing PowerPoint Templates because You can Hit the nail on the head with our PowerPoint Templates and Slides. Embed your ideas in the minds of your audience. Download our Success PowerPoint Templates because Our PowerPoint Templates and Slides will let you Leave a lasting impression to your audiences. They possess an inherent longstanding recall factor. Download and present our Pie chart PowerPoint Templates because Our PowerPoint Templates and Slides will effectively help you save your valuable time. They are readymade to fit into any presentation structure. Use our Business PowerPoint Templates because you can Set pulses racing with our PowerPoint Templates and Slides. They will raise the expectations of your team.Use these PowerPoint slides for presentations relating to Pie chart, finance, marketing, business, success, pie chart. The prominent colors used in the PowerPoint template are Blue, Red, Green. Get comfy with our Pie Chart For Marketing And Business PowerPoint Templates Ppt Backgrounds For Slides 0413. Make your audience feel at ease.
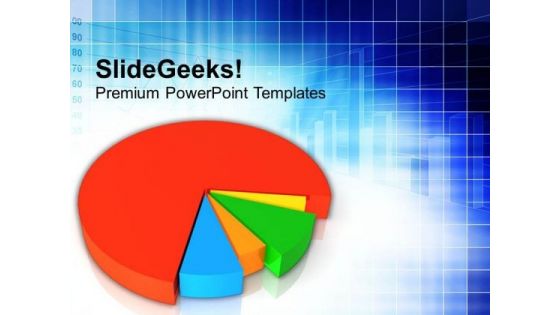
Pie Chart Business Result PowerPoint Templates Ppt Backgrounds For Slides 0413
We present our Pie Chart Business Result PowerPoint Templates PPT Backgrounds For Slides 0413.Download and present our Finance PowerPoint Templates because you should Whip up a frenzy with our PowerPoint Templates and Slides. They will fuel the excitement of your team. Download our Marketing PowerPoint Templates because You can Connect the dots. Fan expectations as the whole picture emerges. Download and present our Success PowerPoint Templates because Our PowerPoint Templates and Slides will embellish your thoughts. See them provide the desired motivation to your team. Use our Pie chart PowerPoint Templates because You have a driving passion to excel in your field. Our PowerPoint Templates and Slides will prove ideal vehicles for your ideas. Download our Business PowerPoint Templates because You have a driving passion to excel in your field. Our PowerPoint Templates and Slides will prove ideal vehicles for your ideas.Use these PowerPoint slides for presentations relating to Pie chart, finance, marketing, business, success, pie chart. The prominent colors used in the PowerPoint template are Blue, Red, Green. Win awards with our Pie Chart Business Result PowerPoint Templates Ppt Backgrounds For Slides 0413. You will come out on top.
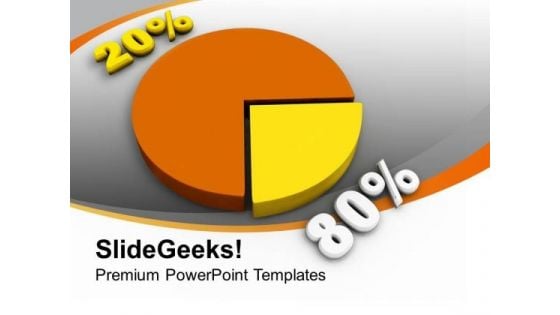
Statistical Pie Chart Financial Business PowerPoint Templates Ppt Backgrounds For Slides 0213
We present our Statistical Pie Chart Financial Business PowerPoint Templates PPT Backgrounds For Slides 0213.Present our Business PowerPoint Templates because You can Channelise the thoughts of your team with our PowerPoint Templates and Slides. Urge them to focus on the goals you have set. Present our Marketing PowerPoint Templates because Our PowerPoint Templates and Slides offer you the needful to organise your thoughts. Use them to list out your views in a logical sequence. Use our Pie charts PowerPoint Templates because It will get your audience in sync. Download our Future PowerPoint Templates because Our PowerPoint Templates and Slides are aesthetically designed to attract attention. We gaurantee that they will grab all the eyeballs you need. Download our Finance PowerPoint Templates because Our PowerPoint Templates and Slides are the chords of your song. String them along and provide the lilt to your views.Use these PowerPoint slides for presentations relating to Business statistics financial success concept, business, marketing, future, finance, pie charts. The prominent colors used in the PowerPoint template are Yellow, Orange, White. Embarrass your brother with our Statistical Pie Chart Financial Business PowerPoint Templates Ppt Backgrounds For Slides 0213. Just download, type and present.
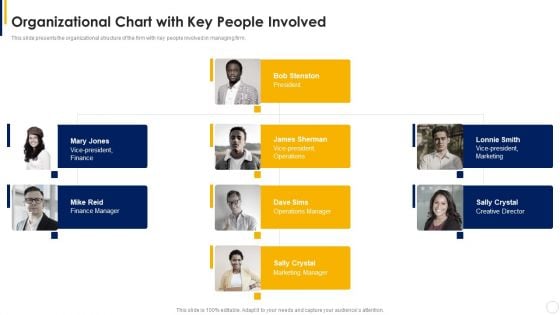
Manual To Develop Strawman Proposal Organizational Chart With Key People Involved Professional PDF
Presenting Manual To Develop Strawman Proposal Organizational Chart With Key People Involved Professional PDF to provide visual cues and insights. Share and navigate important information on three stages that need your due attention. This template can be used to pitch topics like Organizational Chart, Marketing Manager, Finance Manager. In addtion, this PPT design contains high resolution images, graphics, etc, that are easily editable and available for immediate download.
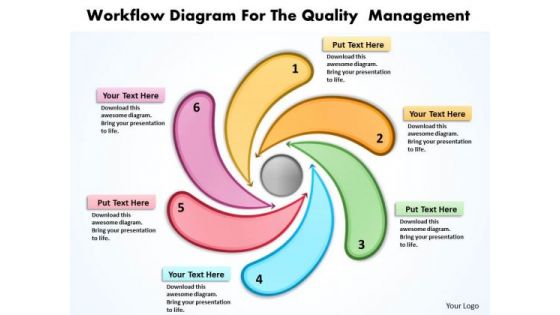
Workflow Diagram For The Quality Management Radial Chart PowerPoint Templates
We present our workflow diagram for the quality management Radial Chart PowerPoint templates.Present our Marketing PowerPoint Templates because Our PowerPoint Templates and Slides will let Your superior ideas hit the target always and everytime. Download and present our Business PowerPoint Templates because infrastructure growth is an obvious requirement of today.inform your group on how exactly this potential is tailor made for you. Download our Shapes PowerPoint Templates because you should Demonstrate how you think out of the box. Use our Finance PowerPoint Templates because you can see clearly through to the bigger bowl ahead. Time your jump to perfection and hit the nail on the head. Use our Symbol PowerPoint Templates because you can see In any endeavour people matter most.Use these PowerPoint slides for presentations relating to Arrow, Art, Business, Chart, Design, Development, Diagram, Flow, Flowchart, Graphic, Gray, Idea, Info, Management, Method, Model, Process, Quality, Rainbow, Research, Sign, Software, Strategy, Success, System, Template, Text, Vector, Work. The prominent colors used in the PowerPoint template are Red, Blue, Yellow. We assure you our workflow diagram for the quality management Radial Chart PowerPoint templates are incredible easy to use. Customers tell us our Flow PowerPoint templates and PPT Slides will make the presenter successul in his career/life. The feedback we get is that our workflow diagram for the quality management Radial Chart PowerPoint templates effectively help you save your valuable time. We assure you our Chart PowerPoint templates and PPT Slides are Splendid. People tell us our workflow diagram for the quality management Radial Chart PowerPoint templates are Classic. We assure you our Diagram PowerPoint templates and PPT Slides are Fabulous. Build their faith with our Workflow Diagram For The Quality Management Radial Chart PowerPoint Templates. They will ally with your cause.
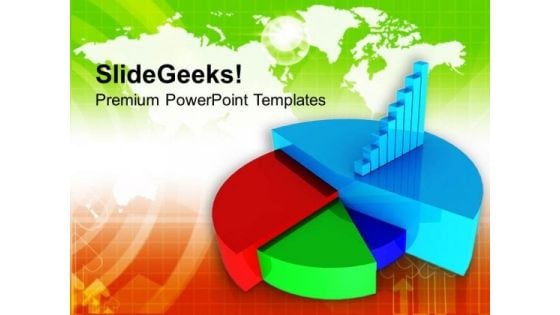
Pie Chart To Do Relative Study Business PowerPoint Templates Ppt Backgrounds For Slides 0313
We present our Pie Chart To Do Relative Study Business PowerPoint Templates PPT Backgrounds For Slides 0313.Present our Finance PowerPoint Templates because Our PowerPoint Templates and Slides will let you Hit the right notes. Watch your audience start singing to your tune. Download and present our Marketing PowerPoint Templates because Our PowerPoint Templates and Slides will generate and maintain the level of interest you desire. They will create the impression you want to imprint on your audience. Use our Business PowerPoint Templates because It will mark the footprints of your journey. Illustrate how they will lead you to your desired destination. Download and present our Circle Charts PowerPoint Templates because you can Break through with our PowerPoint Templates and Slides. Bring down the mental barriers of your audience. Use our Success PowerPoint Templates because Our PowerPoint Templates and Slides are designed to help you succeed. They have all the ingredients you need.Use these PowerPoint slides for presentations relating to Colorful bar and pie success business chart, finance, marketing, business, success, circle charts. The prominent colors used in the PowerPoint template are Blue, Green, Red. Be bold and dramatic with our Pie Chart To Do Relative Study Business PowerPoint Templates Ppt Backgrounds For Slides 0313. State the facts with elan.
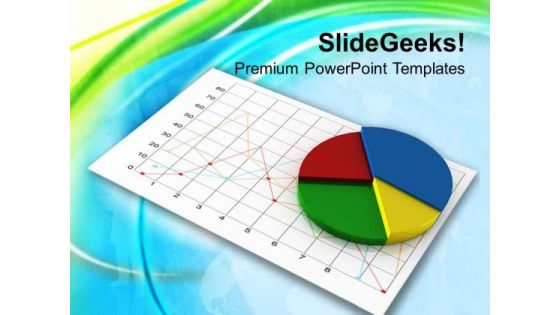
Pie Chart With Business Result PowerPoint Templates Ppt Backgrounds For Slides 0313
We present our Pie Chart With Business Result PowerPoint Templates PPT Backgrounds For Slides 0313.Download and present our Finance PowerPoint Templates because Our PowerPoint Templates and Slides will give good value for money. They also have respect for the value of your time. Download and present our Marketing PowerPoint Templates because Our PowerPoint Templates and Slides will give you great value for your money. Be assured of finding the best projection to highlight your words. Use our Business PowerPoint Templates because Our PowerPoint Templates and Slides will help you be quick off the draw. Just enter your specific text and see your points hit home. Download our Circle Charts PowerPoint Templates because Our PowerPoint Templates and Slides provide you with a vast range of viable options. Select the appropriate ones and just fill in your text. Download and present our Success PowerPoint Templates because you can Add colour to your speech with our PowerPoint Templates and Slides. Your presentation will leave your audience speechless.Use these PowerPoint slides for presentations relating to Pie chart, finance, marketing, business, success, circle charts. The prominent colors used in the PowerPoint template are Blue, Green, Red. Our Pie Chart With Business Result PowerPoint Templates Ppt Backgrounds For Slides 0313 make great allies. They uphold your faith in them.
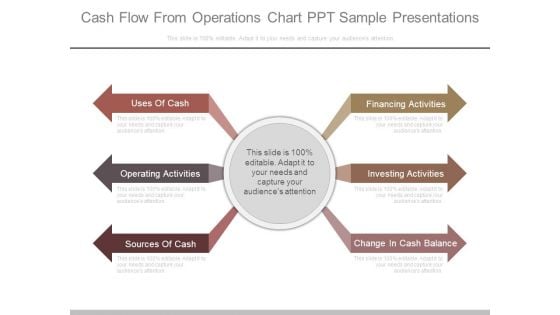
Cash Flow From Operations Chart Ppt Sample Presentations
This is a cash flow from operations chart ppt sample presentations. This is a six stage process. The stages in this process are uses of cash, operating activities, sources of cash, financing activities, investing activities, change in cash balance.
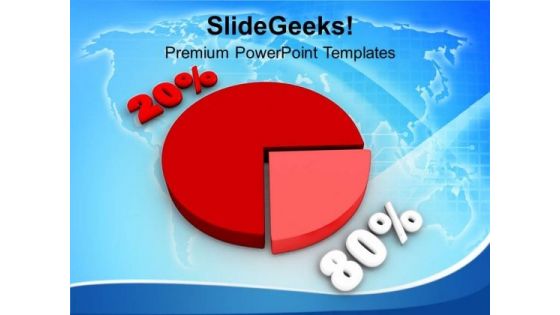
Pie Chart With Percentage 80 20 Growth PowerPoint Templates Ppt Backgrounds For Slides 0213
We present our Pie Chart With Percentage 80 20 Growth PowerPoint Templates PPT Backgrounds For Slides 0213.Use our Business PowerPoint Templates because Our PowerPoint Templates and Slides will embellish your thoughts. See them provide the desired motivation to your team. Present our Marketing PowerPoint Templates because You canTake a leap off the starting blocks with our PowerPoint Templates and Slides. They will put you ahead of the competition in quick time. Download our Finance PowerPoint Templates because Our PowerPoint Templates and Slides will let you meet your Deadlines. Download our Circle Charts PowerPoint Templates because Our PowerPoint Templates and Slides will help you be quick off the draw. Just enter your specific text and see your points hit home. Use our Success PowerPoint Templates because Our PowerPoint Templates and Slides will generate and maintain the level of interest you desire. They will create the impression you want to imprint on your audience.Use these PowerPoint slides for presentations relating to 80-20 Rule Red, business, marketing, finance, circle charts, success. The prominent colors used in the PowerPoint template are Red, White, Black. Impress your audience with our Pie Chart With Percentage 80 20 Growth PowerPoint Templates Ppt Backgrounds For Slides 0213. You will come out on top.


 Continue with Email

 Home
Home


