Finance Kpi
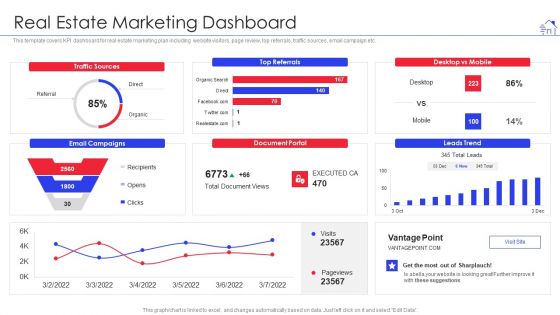
Promotional Strategies For Property Development Firm Real Estate Marketing Dashboard Sample PDF
This template covers KPI dashboard for real estate marketing plan including website visitors, page review, top referrals, traffic sources, email campaign etc. Deliver an awe inspiring pitch with this creative promotional strategies for property development firm real estate marketing dashboard sample pdf bundle. Topics like real estate marketing dashboard can be discussed with this completely editable template. It is available for immediate download depending on the needs and requirements of the user.

Agile QA Procedure Reasons Behind Decrease In Revenues Elements PDF
This slide depicts the reasons behind decrease in the number of projects. So, Approximately 50 parcent of the projects were of poor quality, which eventually lead to decline in revenues. Deliver and pitch your topic in the best possible manner with this agile qa procedure quality control kpi dashboard topics pdf. Use them to share invaluable insights on reasons behind decrease in revenues and impress your audience. This template can be altered and modified as per your expectations. So, grab it now.
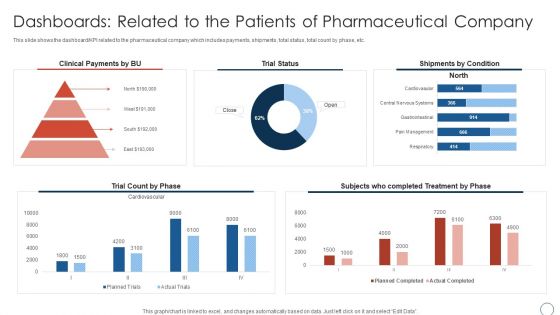
Obtaining Sustainability Growing Pharmaceutical Organization Dashboards Related To The Patients Slides PDF
This slide shows the dashboard KPI related to the pharmaceutical company which includes payments, shipments, total status, total count by phase, etc. Deliver and pitch your topic in the best possible manner with this obtaining sustainability growing pharmaceutical organization dashboards related to the patients slides pdf. Use them to share invaluable insights on dashboards related to the patients of pharmaceutical company and impress your audience. This template can be altered and modified as per your expectations. So, grab it now.
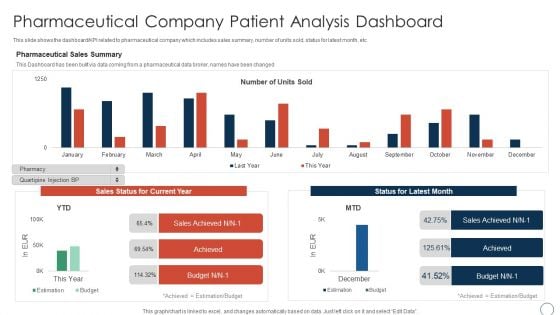
Pharmaceutical Company Patient Analysis Obtaining Sustainability Growing Pharmaceutical Organization Information PDF
This slide shows the dashboard KPI related to pharmaceutical company which includes sales summary, number of units sold, status for latest month, etc Deliver an awe inspiring pitch with this creative pharmaceutical company patient analysis obtaining sustainability growing pharmaceutical organization information pdf bundle. Topics like pharmaceutical company patient analysis dashboard can be discussed with this completely editable template. It is available for immediate download depending on the needs and requirements of the user.
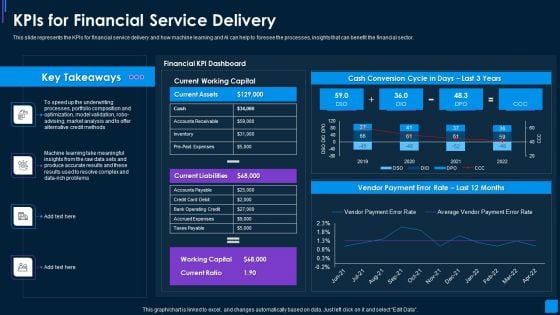
Advance IT Service Delivery Kpis For Financial Service Delivery Ideas PDF
This slide represents the KPIs for financial service delivery and how machine learning and AI can help to foresee the processes, insights that can benefit the financial sector. Deliver an awe inspiring pitch with this creative advance it service delivery kpis for financial service delivery ideas pdf bundle. Topics like financial kpi dashboard, current working capital, cash conversion cycle can be discussed with this completely editable template. It is available for immediate download depending on the needs and requirements of the user.
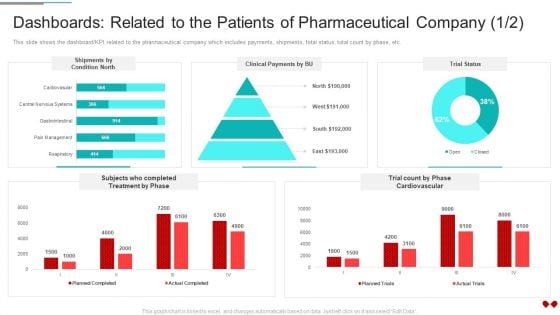
Environmental Impact Analysis For A Pharmaceutical Dashboards Related To The Patients Formats PDF
This slide shows the dashboard KPI related to the pharmaceutical company which includes payments, shipments, total status, total count by phase, etc.Deliver and pitch your topic in the best possible manner with this Environmental Impact Analysis For A Pharmaceutical Dashboards Related To The Patients Formats PDF Use them to share invaluable insights on Shipments By Condition, Clinical Payments, Cardiovascular and impress your audience. This template can be altered and modified as per your expectations. So, grab it now.

Dashboard Showing Production Quality Defects Guidelines PDF
This following slide exhibits a dashboard providing KPI of manufacturing quality. Major KPIs under this are total and defective production, average cycle duration and production rate.Showcasing this set of slides titled Dashboard Showing Production Quality Defects Guidelines PDF The topics addressed in these templates are Count Of Defects By Type, Defects Reported By Tester, Defective Production All the content presented in this PPT design is completely editable. Download it and make adjustments in color, background, font etc. as per your unique business setting.
Product Marketing Playbook Dashboard For Tracking Lead Generation From Marketing Efforts Summary PDF
Following slide displays KPI dashboard that company is currently using for measuring lead generation through marketing. It also provides information about the traffic generation through different sources.Deliver an awe inspiring pitch with this creative Product Marketing Playbook Dashboard For Tracking Lead Generation From Marketing Efforts Summary PDF bundle. Topics like Dashboard Tracking, Lead Generation, Marketing Efforts can be discussed with this completely editable template. It is available for immediate download depending on the needs and requirements of the user.
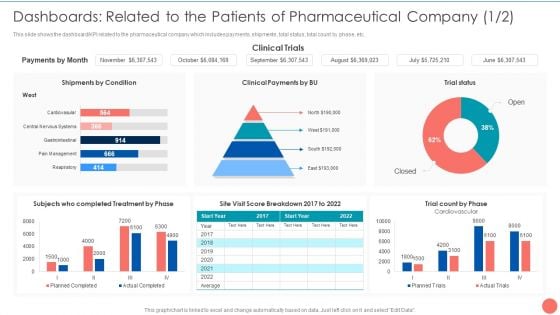
Dashboards Related To The Patients Of Pharmaceutical Company Tactics To Achieve Sustainability Mockup PDF
This slide shows the dashboard or KPI related to the pharmaceutical company which includes payments, shipments, total status, total count by phase, etc. Deliver an awe inspiring pitch with this creative Dashboards Related To The Patients Of Pharmaceutical Company Tactics To Achieve Sustainability Mockup PDF bundle. Topics like Payments By Month, Shipments By Condition, Clinical Payments BU, Trial Count Phase can be discussed with this completely editable template. It is available for immediate download depending on the needs and requirements of the user.
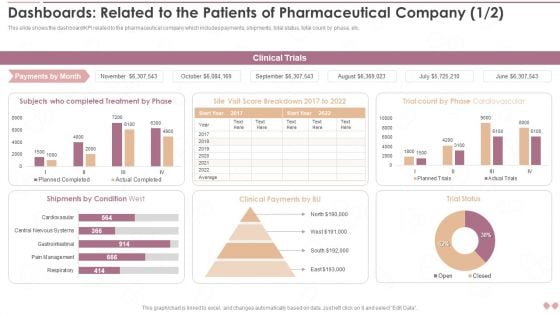
Dashboards Related To The Patients Of Pharmaceutical Company Slides PDF
This slide shows the dashboard KPI related to the pharmaceutical company which includes payments, shipments, total status, total count by phase, etc.Deliver an awe inspiring pitch with this creative Dashboards Related To The Patients Of Pharmaceutical Company Slides PDF bundle. Topics like Completed Treatment, Shipments Condition, Clinical Payments can be discussed with this completely editable template. It is available for immediate download depending on the needs and requirements of the user.
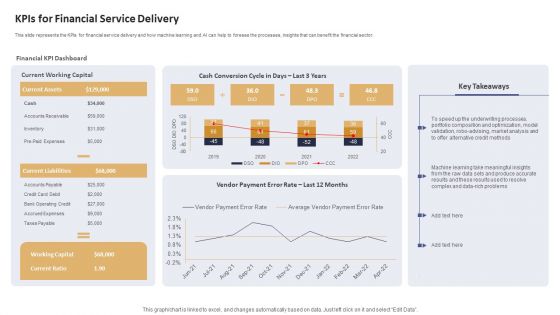
Data Processing Services Delivery Kpis For Financial Service Delivery Diagrams PDF
This slide represents the KPIs for financial service delivery and how machine learning and AI can help to foresee the processes, insights that can benefit the financial sector. Deliver an awe inspiring pitch with this creative Data Processing Services Delivery Kpis For Financial Service Delivery Diagrams PDF bundle. Topics like Financial KPI Dashboard, Current Working Capital, Cash Conversion can be discussed with this completely editable template. It is available for immediate download depending on the needs and requirements of the user.
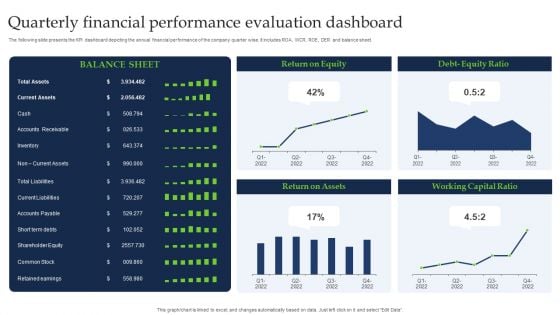
Quarterly Financial Performance Evaluation Dashboard Guidelines PDF
The following slide presents the KPI dashboard depicting the annual financial performance of the company quarter wise. It includes ROA, WCR, ROE, DER and balance sheet. Pitch your topic with ease and precision using this Quarterly Financial Performance Evaluation Dashboard Guidelines PDF. This layout presents information on Current Assets, Shareholder Equity, Common Stock. It is also available for immediate download and adjustment. So, changes can be made in the color, design, graphics or any other component to create a unique layout.
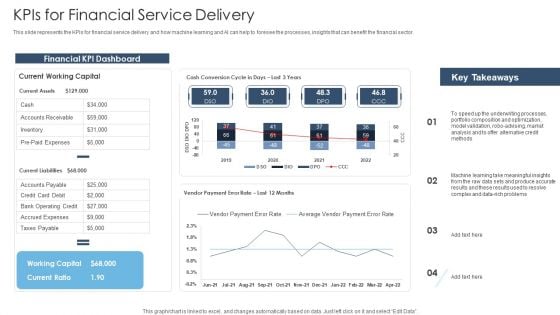
Achieving Proactive From Reactive Kpis For Financial Service Delivery Background PDF
This slide represents the KPIs for financial service delivery and how machine learning and AI can help to foresee the processes, insights that can benefit the financial sector. Deliver an awe inspiring pitch with this creative Achieving Proactive From Reactive Kpis For Financial Service Delivery Background PDF bundle. Topics like Financial KPI Dashboard, Current Working Capital, Working Capital can be discussed with this completely editable template. It is available for immediate download depending on the needs and requirements of the user.
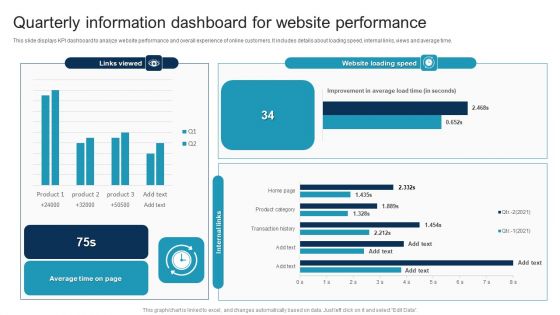
Quarterly Information Dashboard For Website Performance Portrait PDF
This slide displays KPI dashboard to analyze website performance and overall experience of online customers. It includes details about loading speed, internal links, views and average time. Pitch your topic with ease and precision using this Quarterly Information Dashboard For Website Performance Portrait PDF. This layout presents information on Quarterly Information, Dashboard For Website Performance. It is also available for immediate download and adjustment. So, changes can be made in the color, design, graphics or any other component to create a unique layout.
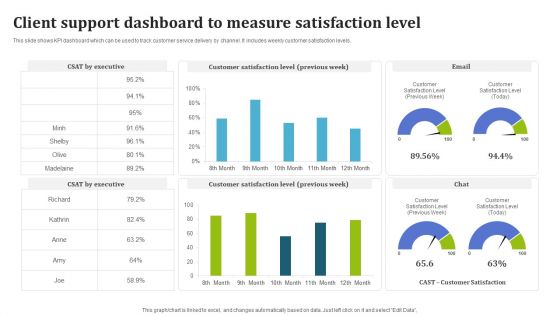
Client Support Dashboard To Measure Satisfaction Level Structure PDF
This slide shows KPI dashboard which can be used to track customer service delivery by channel. It includes weekly customer satisfaction levels. Showcasing this set of slides titled Client Support Dashboard To Measure Satisfaction Level Structure PDF. The topics addressed in these templates are Executive, Customer Satisfaction Level, Email. All the content presented in this PPT design is completely editable. Download it and make adjustments in color, background, font etc. as per your unique business setting.
Client Support Performance Tracking Dashboard Template PDF
This slide shows KPI dashboard which can be used by organizations to track customer service delivery dashboard. It includes customer satisfaction score, total cases received, cases responses, etc. Showcasing this set of slides titled Client Support Performance Tracking Dashboard Template PDF. The topics addressed in these templates are Customer Satisfaction Score, Average, Cases By Product. All the content presented in this PPT design is completely editable. Download it and make adjustments in color, background, font etc. as per your unique business setting.
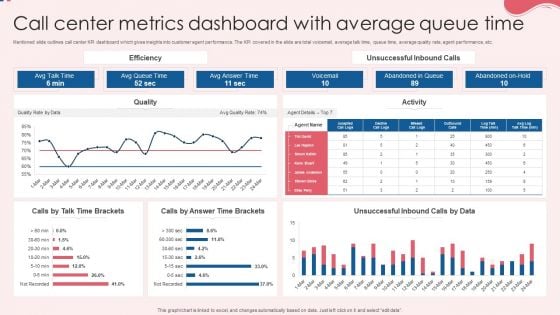
Call Center Metrics Dashboard With Average Queue Time Topics PDF
Mentioned slide outlines call center KPI dashboard which gives insights into customer agent performance. The KPI covered in the slide are total voicemail, average talk time, queue time, average quality rate, agent performance, etc. Pitch your topic with ease and precision using this Call Center Metrics Dashboard With Average Queue Time Topics PDF. This layout presents information on Efficiency, Quality, Activity. It is also available for immediate download and adjustment. So, changes can be made in the color, design, graphics or any other component to create a unique layout.
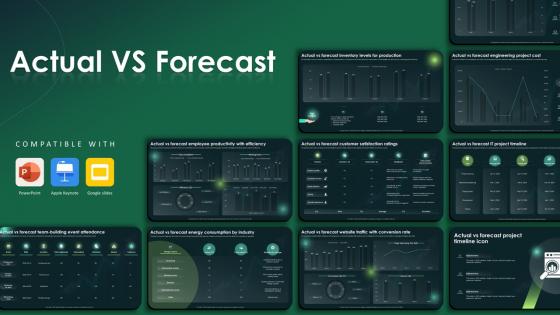
Actual Vs Forecast Powerpoint Ppt Template Bundles
This Actual Vs Forecast Powerpoint Ppt Template Bundles is designed to help you retain your audiences attention. This content-ready PowerPoint Template enables you to take your audience on a journey and share information in a way that is easier to recall. It helps you highlight the crucial parts of your work so that the audience does not get saddled with information download. This KPI Dashboard, Data Driven Marketing, Campaign Performance, Marketing Evaluation, Inventory Assessment-slide PPT Deck comes prepared with the graphs and charts you could need to showcase your information through visuals. You only need to enter your own data in them. Download this editable PowerPoint Theme and walk into that meeting with confidence. Our Actual vs. Forecast PowerPoint presentation can provide you with valuable business insights. Analyze sales figures, budgets, and financial predictions. Identify major differences, modify methods, and match projections with results to improve decision-making. Download now to accelerate your success.

ATS Administration To Improve Asset Management Dashboard To Track System Guidelines PDF
This slide covers KPI dashboard to track system performance. It involves detail such as total number of assets, value of assets and purchases in fiscal year. Get a simple yet stunning designed ATS Administration To Improve Asset Management Dashboard To Track System Guidelines PDF. It is the best one to establish the tone in your meetings. It is an excellent way to make your presentations highly effective. So, download this PPT today from Slidegeeks and see the positive impacts. Our easy-to-edit ATS Administration To Improve Asset Management Dashboard To Track System Guidelines PDF can be your go-to option for all upcoming conferences and meetings. So, what are you waiting for Grab this template today.
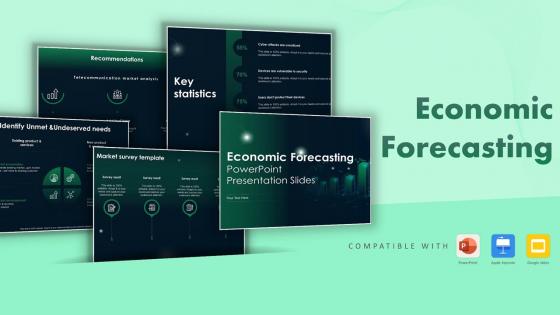
Economic Forecasting Powerpoint Presentation Slides

Debt Retrieval Techniques Our Key Performance Indicators For Balance Sheet Ppt Pictures Gallery PDF
Purpose of the following side is to display the major KPI for the balance sheet as it highlight the key components such as current asset, current liabilities, total assets and total liability of the organization for the financial year 2020 2021 Deliver and pitch your topic in the best possible manner with this debt retrieval techniques our key performance indicators for balance sheet ppt pictures gallery pdf. Use them to share invaluable insights on current assets, current liabilities, total assets, total liabilities and impress your audience. This template can be altered and modified as per your expectations. So, grab it now.
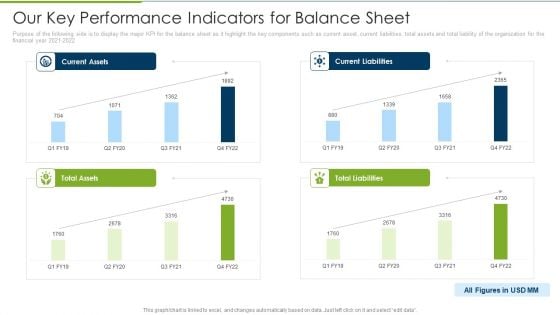
Debt Collection Improvement Plan Our Key Performance Indicators For Balance Sheet Professional PDF
Purpose of the following side is to display the major KPI for the balance sheet as it highlight the key components such as current asset, current liabilities, total assets and total liability of the organization for the financial year 2021 to 2022. Deliver and pitch your topic in the best possible manner with this debt collection improvement plan our key performance indicators for balance sheet professional pdf. Use them to share invaluable insights on current assets, current liabilities, total assets, total liabilities and impress your audience. This template can be altered and modified as per your expectations. So, grab it now.
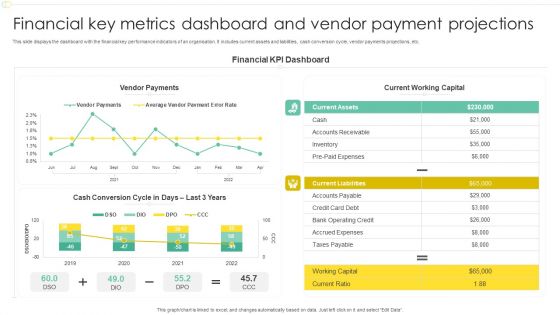
Financial Key Metrics Dashboard And Vendor Payment Projections Professional PDF
This slide displays the dashboard with the financial key performance indicators of an organisation. It includes current assets and liabilities, cash conversion cycle, vendor payments projections, etc. Pitch your topic with ease and precision using this Financial Key Metrics Dashboard And Vendor Payment Projections Professional PDF. This layout presents information on Financial KPI Dashboard, Current Working Capital, Vendor Payments. It is also available for immediate download and adjustment. So, changes can be made in the color, design, graphics or any other component to create a unique layout.
Robotic Process Automation Metrics Dashboard For Tracking Business Return On Investment Information PDF
This slide illustrates KPI Dashboard for measuring time and money saved after RPA deployment. It also include metrics for analysis such as productivity in robot hours, hours saved per process, money saved per process, etc. Pitch your topic with ease and precision using this Robotic Process Automation Metrics Dashboard For Tracking Business Return On Investment Information PDF. This layout presents information on Management, Goal, Productivity. It is also available for immediate download and adjustment. So, changes can be made in the color, design, graphics or any other component to create a unique layout.
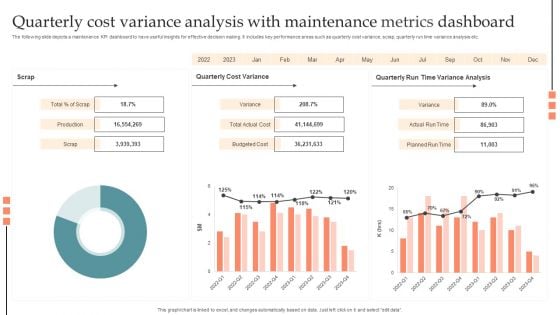
Quarterly Cost Variance Analysis With Maintenance Metrics Dashboard Information PDF
The following slide depicts a maintenance KPI dashboard to have useful insights for effective decision making. It includes key performance areas such as quarterly cost variance, scrap, quarterly run time variance analysis etc. Pitch your topic with ease and precision using this Quarterly Cost Variance Analysis With Maintenance Metrics Dashboard Information PDF. This layout presents information on Production, Budgeted Cost, Planned Run Time, Actual Run Time. It is also available for immediate download and adjustment. So, changes can be made in the color, design, graphics or any other component to create a unique layout.
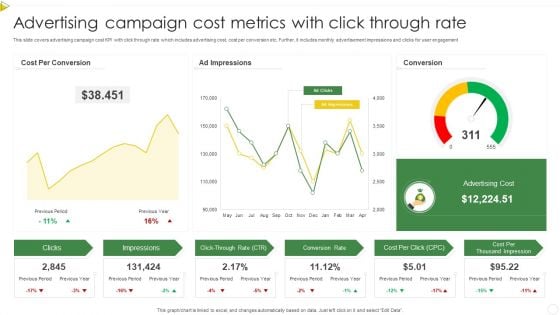
Advertising Campaign Cost Metrics With Click Through Rate Pictures PDF
This slide covers advertising campaign cost KPI with click through rate which includes advertising cost, cost per conversion etc. Further, it includes monthly advertisement impressions and clicks for user engagement. Showcasing this set of slides titled Advertising Campaign Cost Metrics With Click Through Rate Pictures PDF. The topics addressed in these templates are Conversion Rate, Cost Per Click, Advertising Cost. All the content presented in this PPT design is completely editable. Download it and make adjustments in color, background, font etc. as per your unique business setting.
Employee Training And Development Plan Performance Tracking Dashboard Portrait PDF
Mentioned slide outlines key performance indicator KPI dashboard which can be used by organization to monitor training and development strategies. The major metrics covered in the template are cost per participant, per hour, number of trainees , etc. Showcasing this set of slides titled Employee Training And Development Plan Performance Tracking Dashboard Portrait PDF. The topics addressed in these templates are Employee Training, Development Plan Performance, Tracking Dashboard. All the content presented in this PPT design is completely editable. Download it and make adjustments in color, background, font etc. as per your unique business setting.
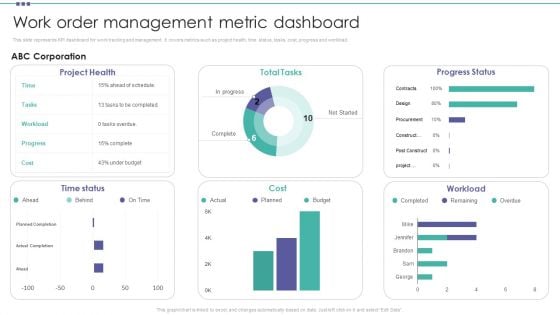
Work Order Management Metric Dashboard Organization Physical Assets Template PDF
This slide represents KPI dashboard for work tracking and management. It covers metrics such as project health, time status, tasks, cost, progress and workload. Boost your pitch with our creative Work Order Management Metric Dashboard Organization Physical Assets Template PDF. Deliver an awe-inspiring pitch that will mesmerize everyone. Using these presentation templates you will surely catch everyones attention. You can browse the ppts collection on our website. We have researchers who are experts at creating the right content for the templates. So you do not have to invest time in any additional work. Just grab the template now and use them.

Business Referral Marketing Program Performance Metrics Dashboard Introduction PDF
This slide shows KPI dashboard to effectively track performance of business referral program in order to attract more leads and potential customers to the busines. It includes details related to key metrics such as referral participation rate, referred customers, referral conversion rate and total revenue generated. Showcasing this set of slides titled Business Referral Marketing Program Performance Metrics Dashboard Introduction PDF. The topics addressed in these templates are Referral Participation Rate, Referred Customers, Referral Conversion Rate, Total Revenue Generated. All the content presented in this PPT design is completely editable. Download it and make adjustments in color, background, font etc. as per your unique business setting.
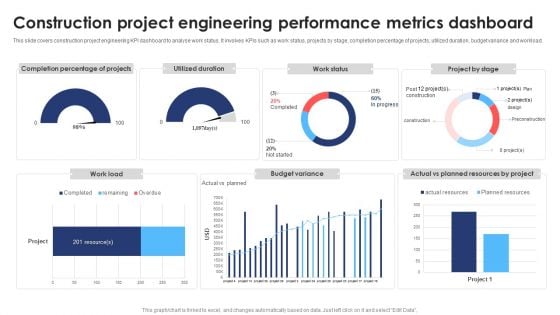
Construction Project Engineering Performance Metrics Dashboard Ideas PDF
This slide covers construction project engineering KPI dashboard to analyse work status. It involves KPIs such as work status, projects by stage, completion percentage of projects, utilized duration, budget variance and workload. Showcasing this set of slides titled Construction Project Engineering Performance Metrics Dashboard Ideas PDF. The topics addressed in these templates are Budget Variance, Resource, Project. All the content presented in this PPT design is completely editable. Download it and make adjustments in color, background, font etc. as per your unique business setting.
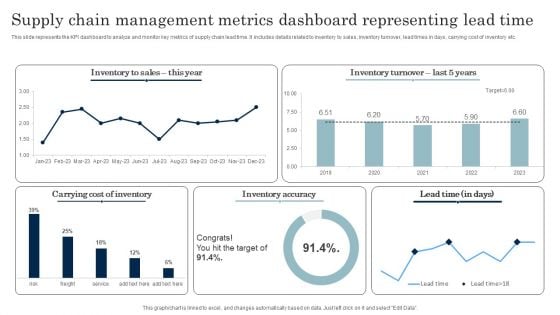
Supply Chain Management Metrics Dashboard Representing Lead Time Download PDF
This slide represents the KPI dashboard to analyze and monitor key metrics of supply chain lead time. It includes details related to inventory to sales, inventory turnover, lead times in days, carrying cost of inventory etc. Pitch your topic with ease and precision using this Supply Chain Management Metrics Dashboard Representing Lead Time Download PDF. This layout presents information on Inventory Accuracy, Carrying Cost Of Inventory. It is also available for immediate download and adjustment. So, changes can be made in the color, design, graphics or any other component to create a unique layout.
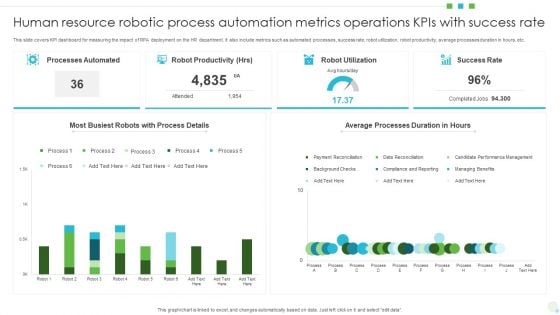
Human Resource Robotic Process Automation Metrics Operations Kpis With Success Rate Themes PDF
This slide covers KPI dashboard for measuring the impact of RPA deployment on the HR department. It also include metrics such as automated processes, success rate, robot utilization, robot productivity, average processes duration in hours, etc. Showcasing this set of slides titled Human Resource Robotic Process Automation Metrics Operations Kpis With Success Rate Themes PDF. The topics addressed in these templates are Processes Automated, Robot Productivity, Robot Utilization. All the content presented in this PPT design is completely editable. Download it and make adjustments in color, background, font etc. as per your unique business setting.
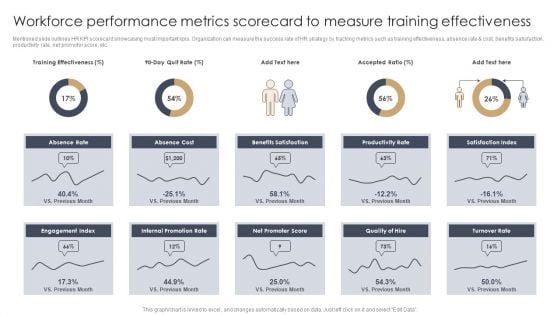
Workforce Performance Metrics Scorecard To Measure Training Effectiveness Information PDF
Mentioned slide outlines HR KPI scorecard showcasing most important kpis. Organization can measure the success rate of HR strategy by tracking metrics such as training effectiveness, absence rate and cost, benefits satisfaction, productivity rate, net promotor score, etc.Pitch your topic with ease and precision using this Workforce Performance Metrics Scorecard To Measure Training Effectiveness Information PDF. This layout presents information on Absence Rate, Internal Promotion, Engagement Index. It is also available for immediate download and adjustment. So, changes can be made in the color, design, graphics or any other component to create a unique layout.

Metric Dashboard To Track Supplier Diversity And Performance Designs PDF
This slide represents KPI dashboard for tracking supplier diversity in organization and measure performance. It provides information regarding organization spending cost, supplier count, diversity type, status etc. Pitch your topic with ease and precision using this Metric Dashboard To Track Supplier Diversity And Performance Designs PDF. This layout presents information on Diversity Type, Diversity Status, Diverse Supplier. It is also available for immediate download and adjustment. So, changes can be made in the color, design, graphics or any other component to create a unique layout.
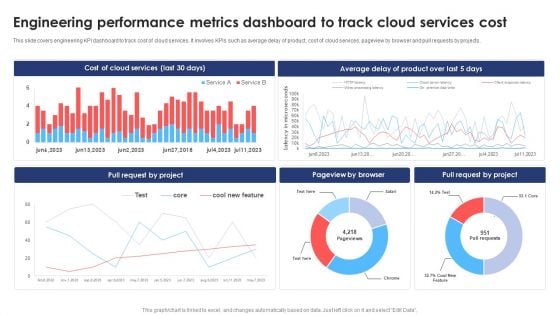
Engineering Performance Metrics Dashboard To Track Cloud Services Cost Clipart PDF
This slide covers engineering KPI dashboard to track cost of cloud services. It involves KPIs such as average delay of product, cost of cloud services, pageview by browser and pull requests by projects. Showcasing this set of slides titled Engineering Performance Metrics Dashboard To Track Cloud Services Cost Clipart PDF. The topics addressed in these templates are Cost Of Cloud Services, Average, Product. All the content presented in this PPT design is completely editable. Download it and make adjustments in color, background, font etc. as per your unique business setting.
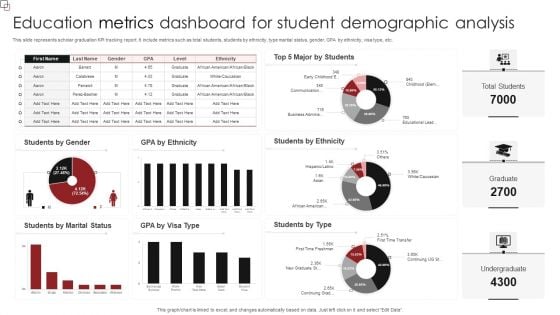
Education Metrics Dashboard For Student Demographic Analysis Diagrams PDF
This slide represents scholar graduation KPI tracking report. It include metrics such as total students, students by ethnicity, type marital status, gender, GPA by ethnicity, visa type, etc. Showcasing this set of slides titled Education Metrics Dashboard For Student Demographic Analysis Diagrams PDF. The topics addressed in these templates are Students Ethnicity, Students Type, Students Marital Status. All the content presented in this PPT design is completely editable. Download it and make adjustments in color, background, font etc. as per your unique business setting.
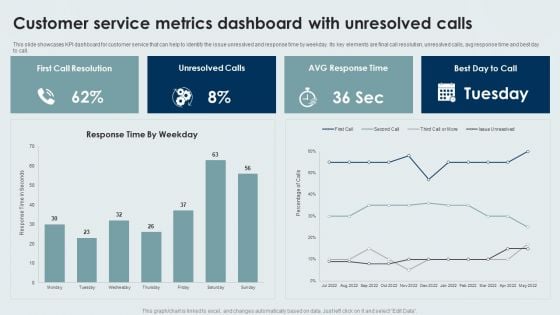
Customer Service Metrics Dashboard With Unresolved Calls Designs PDF
This slide showcases KPI dashboard for customer service that can help to identify the issue unresolved and response time by weekday. Its key elements are final call resolution, unresolved calls, avg response time and best day to call. Showcasing this set of slides titled Customer Service Metrics Dashboard With Unresolved Calls Designs PDF. The topics addressed in these templates are Customer Service, Metrics Dashboard, Unresolved Calls. All the content presented in this PPT design is completely editable. Download it and make adjustments in color, background, font etc. as per your unique business setting.
Dashboard For Tracking Sales Target Metrics Introduction PDF
This slide presents KPI dashboard for tracking Sales Target Metrics achievement monthly and region wise helpful in adjusting activities as per ongoing performance. It includes average weekly sales revenue, average sales target, annual sales growth, regional sales performance and average revenue per unit that should be regularly tracked. Showcasing this set of slides titled Dashboard For Tracking Sales Target Metrics Introduction PDF. The topics addressed in these templates are Average Revenue, Per Unit, Average Weekly, Sales Revenue. All the content presented in this PPT design is completely editable. Download it and make adjustments in color, background, font etc. as per your unique business setting.
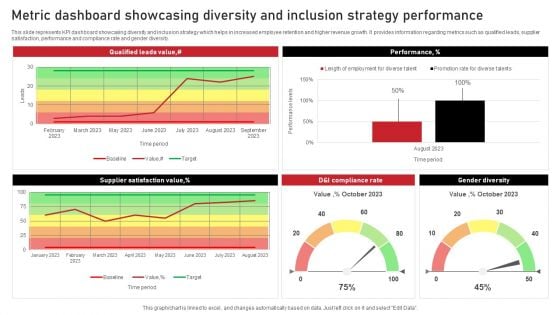
Metric Dashboard Showcasing Diversity And Inclusion Strategy Performance Background PDF
This slide represents KPI dashboard showcasing diversity and inclusion strategy which helps in increased employee retention and higher revenue growth. It provides information regarding metrics such as qualified leads, supplier satisfaction, performance and compliance rate and gender diversity. Showcasing this set of slides titled Metric Dashboard Showcasing Diversity And Inclusion Strategy Performance Background PDF. The topics addressed in these templates are Performance, Gender Diversity, Performance. All the content presented in this PPT design is completely editable. Download it and make adjustments in color, background, font etc. as per your unique business setting.
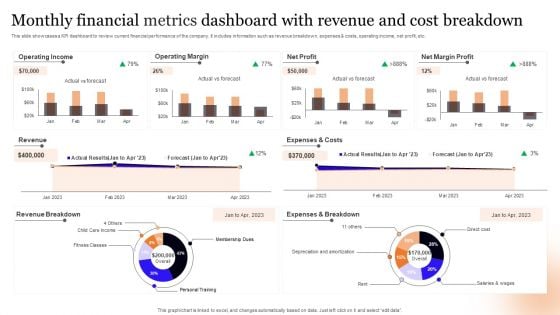
Monthly Financial Metrics Dashboard With Revenue And Cost Breakdown Information PDF
This slide showcases a KPI dashboard to review current financial performance of the company. It includes information such as revenue breakdown, expenses and costs, operating income, net profit, etc. Pitch your topic with ease and precision using this Monthly Financial Metrics Dashboard With Revenue And Cost Breakdown Information PDF. This layout presents information on Operating Income, Operating Margin, Net Profit. It is also available for immediate download and adjustment. So, changes can be made in the color, design, graphics or any other component to create a unique layout.
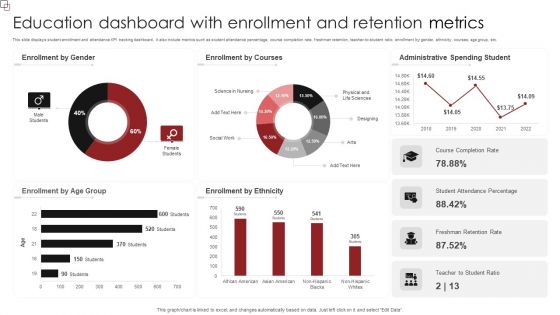
Education Dashboard With Enrollment And Retention Metrics Sample PDF
This slide displays student enrollment and attendance KPI tracking dashboard. It also include metrics such as student attendance percentage, course completion rate, freshman retention, teacher-to-student ratio, enrollment by gender, ethnicity, courses, age group, etc. Pitch your topic with ease and precision using this Education Dashboard With Enrollment And Retention Metrics Sample PDF. This layout presents information on Enrollment Gender, Enrollment Courses, Administrative Spending Student. It is also available for immediate download and adjustment. So, changes can be made in the color, design, graphics or any other component to create a unique layout.

Engineering Performance Metrics Dashboard To Track Pull Requests Background PDF
This slide covers engineering KPI dashboard to track pull request. It involves KPIs such as open time of average pull requests, average comment received, revision rounds, frequency of posting pull requests. Pitch your topic with ease and precision using this Engineering Performance Metrics Dashboard To Track Pull Requests Background PDF. This layout presents information on Dashboard Track Pull Requests, Engineering Performance Metrics. It is also available for immediate download and adjustment. So, changes can be made in the color, design, graphics or any other component to create a unique layout.
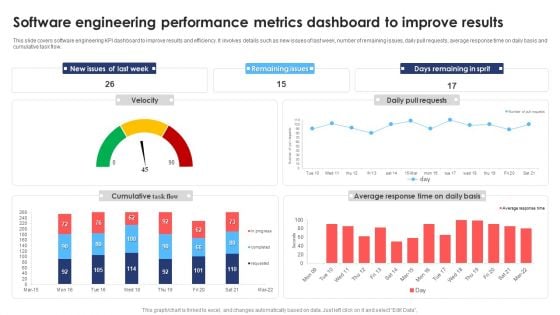
Software Engineering Performance Metrics Dashboard To Improve Results Infographics PDF
This slide covers software engineering KPI dashboard to improve results and efficiency. It involves details such as new issues of last week, number of remaining issues, daily pull requests, average response time on daily basis and cumulative task flow. Pitch your topic with ease and precision using this Software Engineering Performance Metrics Dashboard To Improve Results Infographics PDF. This layout presents information on Software Engineering Performance, Metrics Dashboard Improve Results. It is also available for immediate download and adjustment. So, changes can be made in the color, design, graphics or any other component to create a unique layout.
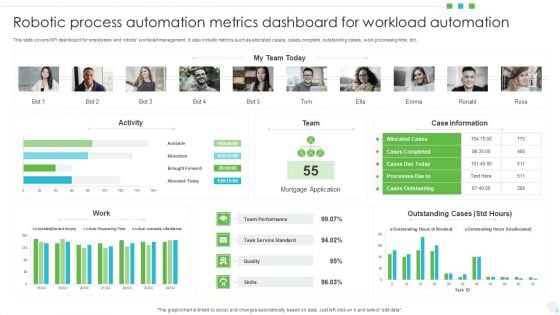
Robotic Process Automation Metrics Dashboard For Workload Automation Mockup PDF
This slide covers KPI dashboard for employees and robots workload management. It also include metrics such as allocated cases, cases complete, outstanding cases, work processing time, etc. Pitch your topic with ease and precision using this Robotic Process Automation Metrics Dashboard For Workload Automation Mockup PDF. This layout presents information on Mortgage Application, Team Performance, Case Information. It is also available for immediate download and adjustment. So, changes can be made in the color, design, graphics or any other component to create a unique layout.
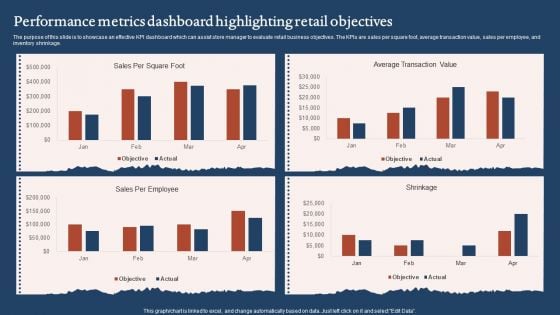
Performance Metrics Dashboard Highlighting Retail Objectives Sample PDF
The purpose of this slide is to showcase an effective KPI dashboard which can assist store manager to evaluate retail business objectives. The KPIs are sales per square foot, average transaction value, sales per employee, and inventory shrinkage. Pitch your topic with ease and precision using this Performance Metrics Dashboard Highlighting Retail Objectives Sample PDF. This layout presents information on Average Transaction Value, Sales Per Employee. It is also available for immediate download and adjustment. So, changes can be made in the color, design, graphics or any other component to create a unique layout.
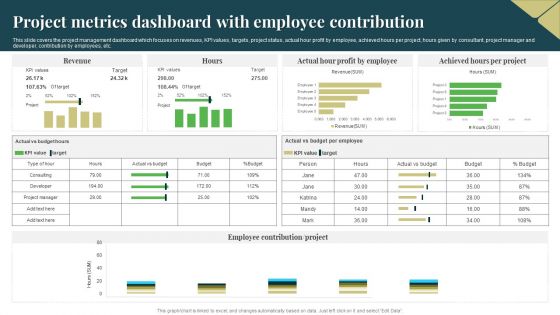
Project Metrics Dashboard With Employee Contribution Guidelines PDF
This slide covers the project management dashboard which focuses on revenues, KPI values, targets, project status, actual hour profit by employee, achieved hours per project, hours given by consultant, project manager and developer, contribution by employees, etc. Showcasing this set of slides titled Project Metrics Dashboard With Employee Contribution Guidelines PDF. The topics addressed in these templates are Target, Revenue, Profit By Employee. All the content presented in this PPT design is completely editable. Download it and make adjustments in color, background, font etc. as per your unique business setting.
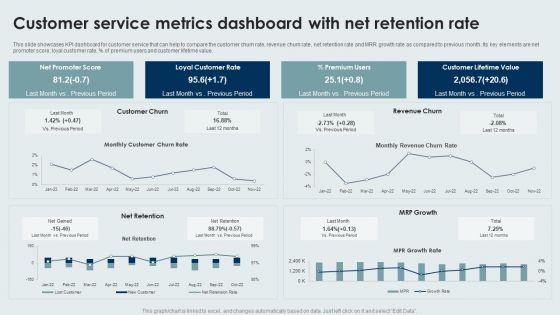
Customer Service Metrics Dashboard With Net Retention Rate Sample PDF
This slide showcases KPI dashboard for customer service that can help to compare the customer churn rate, revenue churn rate, net retention rate and MRR growth rate as compared to previous month. Its key elements are net promoter score, loyal customer rate, percentage of premium users and customer lifetime value. Pitch your topic with ease and precision using this Customer Service Metrics Dashboard With Net Retention Rate Sample PDF. This layout presents information on Loyal Customer Rate, Premium Users, Customer Lifetime Value. It is also available for immediate download and adjustment. So, changes can be made in the color, design, graphics or any other component to create a unique layout.
Shipping Delivery Tracking Metrics Analysis Dashboard Structure PDF
This template illustrates the KPI dashboard for tracking shipment orders. It also includes shipment analysis based on different KPIs such as ongoing delivery, completed delivery, on-time delivery, actual delivery duration, and variance between expected and actual delivery time. Pitch your topic with ease and precision using this Shipping Delivery Tracking Metrics Analysis Dashboard Structure PDF. This layout presents information on Recipient Country, Completed Deliveries, Delivery Duration. It is also available for immediate download and adjustment. So, changes can be made in the color, design, graphics or any other component to create a unique layout.
Market Evaluation Of IT Industry Marketing Campaign Dashboard For B2b Marketers Icons PDF
The following slide showcases key performance indicator KPI dashboard that can assist managers to evaluate digital marketing campaign performance. The key metrics mentioned in the slide are click through rate CTR, conversion rate, cost per click CPC, etc. Make sure to capture your audiences attention in your business displays with our gratis customizable Market Evaluation Of IT Industry Marketing Campaign Dashboard For B2b Marketers Icons PDF. These are great for business strategies, office conferences, capital raising or task suggestions. If you desire to acquire more customers for your tech business and ensure they stay satisfied, create your own sales presentation with these plain slides.
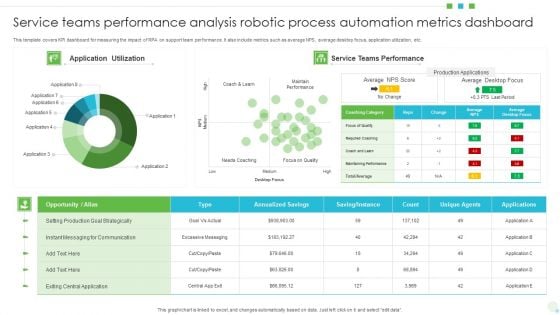
Service Teams Performance Analysis Robotic Process Automation Metrics Dashboard Brochure PDF
This template covers KPI dashboard for measuring the impact of RPA on support team performance. It also include metrics such as average NPS, average desktop focus, application utilization, etc. Showcasing this set of slides titled Service Teams Performance Analysis Robotic Process Automation Metrics Dashboard Brochure PDF. The topics addressed in these templates are Opportunity, Production Goal Strategically, Application Utilization. All the content presented in this PPT design is completely editable. Download it and make adjustments in color, background, font etc. as per your unique business setting.
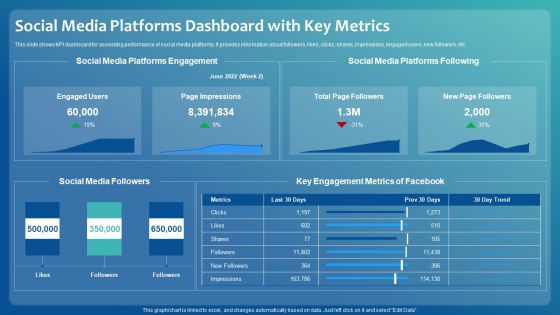
Improving Digital Community Engagement Strategy Social Media Platforms Dashboard With Key Metrics Professional PDF
This slide shows KPI dashboard for assessing performance of social media platforms. It provides information about followers, likes, clicks, shares, impressions, engaged users, new followers, etc. Deliver and pitch your topic in the best possible manner with this Improving Digital Community Engagement Strategy Social Media Platforms Dashboard With Key Metrics Professional PDF. Use them to share invaluable insights on Social Media Platforms Engagement, Key Engagement Metrics and impress your audience. This template can be altered and modified as per your expectations. So, grab it now.
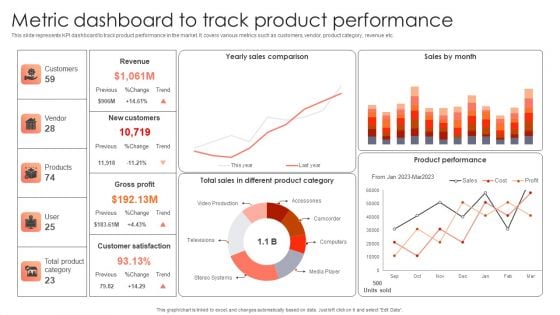
Management Plan For Product Life Cycle Metric Dashboard To Track Product Performance Infographics PDF
This slide represents KPI dashboard to track product performance in the market. It covers various metrics such as customers, vendor, product category, revenue etc. Slidegeeks has constructed Management Plan For Product Life Cycle Metric Dashboard To Track Product Performance Infographics PDF after conducting extensive research and examination. These presentation templates are constantly being generated and modified based on user preferences and critiques from editors. Here, you will find the most attractive templates for a range of purposes while taking into account ratings and remarks from users regarding the content. This is an excellent jumping-off point to explore our content and will give new users an insight into our top-notch PowerPoint Templates.
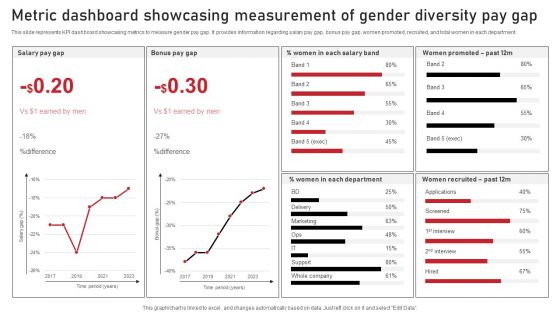
Metric Dashboard Showcasing Measurement Of Gender Diversity Pay Gap Sample PDF
This slide represents KPI dashboard showcasing metrics to measure gender pay gap. It provides information regarding salary pay gap, bonus pay gap, women promoted, recruited, and total women in each department. Pitch your topic with ease and precision using this Metric Dashboard Showcasing Measurement Of Gender Diversity Pay Gap Sample PDF. This layout presents information on Marketing, Screened, Delivery. It is also available for immediate download and adjustment. So, changes can be made in the color, design, graphics or any other component to create a unique layout.
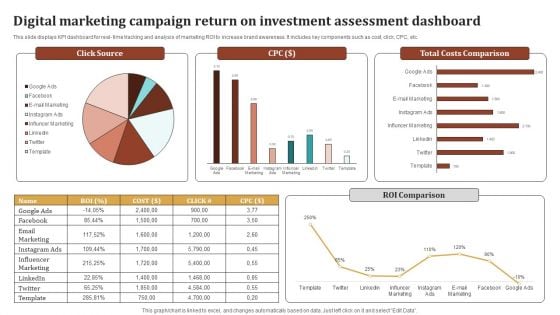
Digital Marketing Campaign Return On Investment Assessment Dashboard Ideas PDF
This slide displays KPI dashboard for real- time tracking and analysis of marketing ROI to increase brand awareness. It includes key components such as cost, click, CPC, etc. Showcasing this set of slides titled Digital Marketing Campaign Return On Investment Assessment Dashboard Ideas PDF. The topics addressed in these templates are Influencer Marketing, Email Marketing, Total Costs Comparison, Roi Comparison. All the content presented in this PPT design is completely editable. Download it and make adjustments in color, background, font etc. as per your unique business setting.
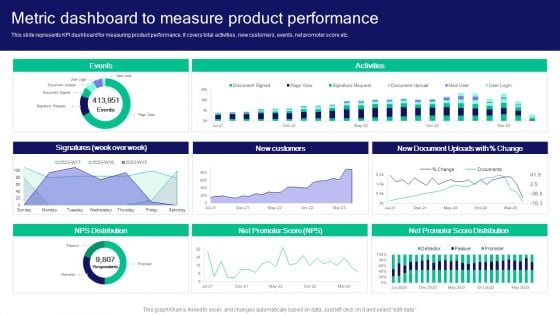
Strategies For Effective Product Metric Dashboard To Measure Product Performance Download PDF
This slide represents KPI dashboard for measuring product performance. It covers total activities, new customers, events, net promoter score etc. Welcome to our selection of the Strategies For Effective Product Metric Dashboard To Measure Product Performance Download PDF. These are designed to help you showcase your creativity and bring your sphere to life. Planning and Innovation are essential for any business that is just starting out. This collection contains the designs that you need for your everyday presentations. All of our PowerPoints are 100 percent editable, so you can customize them to suit your needs. This multi-purpose template can be used in various situations. Grab these presentation templates today.
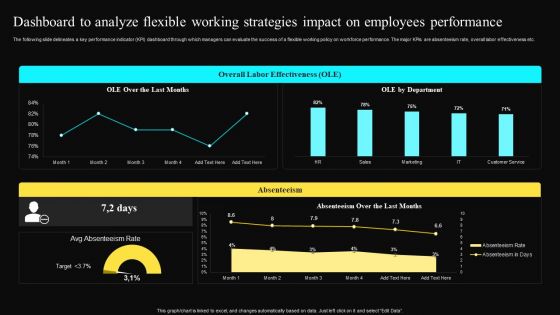
Dashboard To Analyze Flexible Working Strategies Impact On Employees Performance Rules PDF
The following slide delineates a key performance indicator KPI dashboard through which managers can evaluate the success of a flexible working policy on workforce performance. The major KPIs are absenteeism rate, overall labor effectiveness etc.If your project calls for a presentation, then Slidegeeks is your go-to partner because we have professionally designed, easy to edit templates that are perfect for any presentation. After downloading, you can easily edit Dashboard To Analyze Flexible Working Strategies Impact On Employees Performance Rules PDF and make the changes accordingly. You can rearrange slides or fill them with different images. Check out all the handy templates
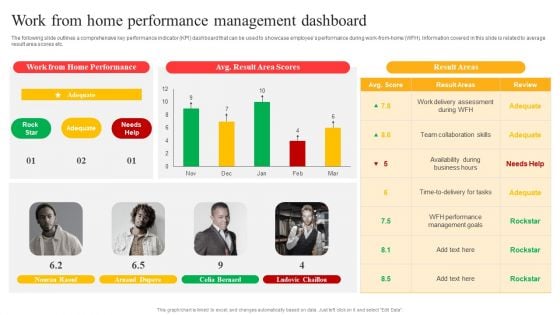
Flexible Working Policies And Guidelines Work From Home Performance Management Dashboard Introduction PDF
The following slide outlines a comprehensive key performance indicator KPI dashboard that can be used to showcase employees performance during work from home WFH. Information covered in this slide is related to average result area scores etc. There are so many reasons you need a Flexible Working Policies And Guidelines Work From Home Performance Management Dashboard Introduction PDF. The first reason is you cannot spend time making everything from scratch, Thus, Slidegeeks has made presentation templates for you too. You can easily download these templates from our website easily.
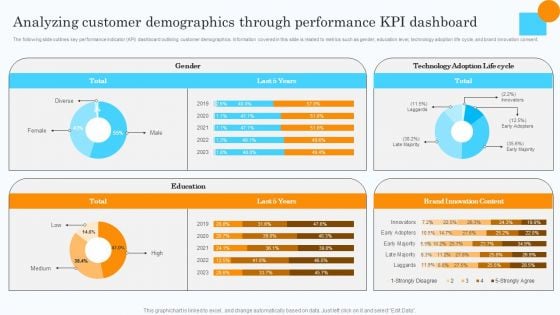
Market Research Assessment Of Target Market Requirements Analyzing Customer Demographics Clipart PDF
The following slide outlines key performance indicator KPI dashboard outlining customer demographics. Information covered in this slide is related to metrics such as gender, education level, technology adoption life cycle, and brand innovation consent. There are so many reasons you need a Market Research Assessment Of Target Market Requirements Analyzing Customer Demographics Clipart PDF. The first reason is you cannot spend time making everything from scratch, Thus, Slidegeeks has made presentation templates for you too. You can easily download these templates from our website easily.
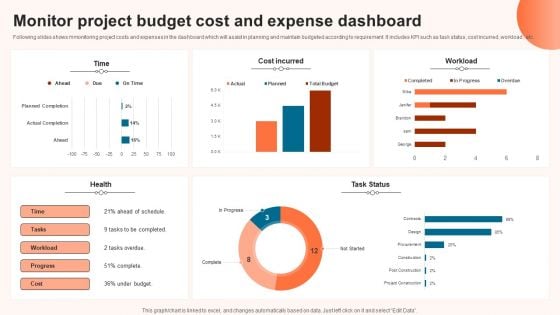
Monitor Project Budget Cost And Expense Dashboard Brochure PDF
Following slides shows mmonitoring project costs and expenses in the dashboard which will assist in planning and maintain budgeted according to requirement. It includes KPI such as task status, cost incurred ,workload , etc. Pitch your topic with ease and precision using this Monitor Project Budget Cost And Expense Dashboard Brochure PDF. This layout presents information on Expense Dashboard, Monitor Project Budget Cost. It is also available for immediate download and adjustment. So, changes can be made in the color, design, graphics or any other component to create a unique layout.
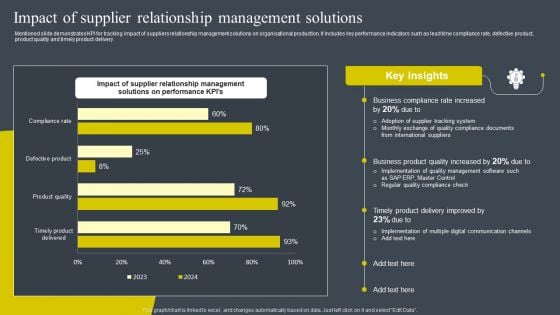
Impact Of Supplier Relationship Management Solutions Rules PDF
Mentioned slide demonstrates KPI for tracking impact of suppliers relationship management solutions on organisational production. It includes key performance indicators such as lead time compliance rate, defective product, product quality and timely product delivery. The best PPT templates are a great way to save time, energy, and resources. Slidegeeks have 100 percent editable powerpoint slides making them incredibly versatile. With these quality presentation templates, you can create a captivating and memorable presentation by combining visually appealing slides and effectively communicating your message. Download Impact Of Supplier Relationship Management Solutions Rules PDF from Slidegeeks and deliver a wonderful presentation.


 Continue with Email

 Home
Home


