Financial Analysis
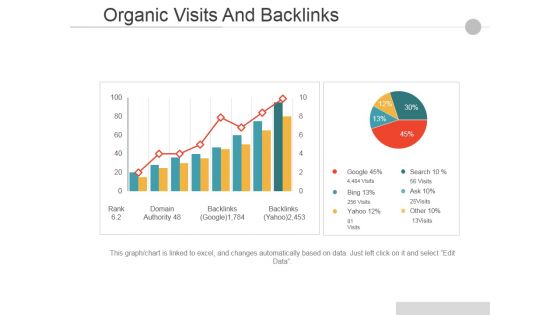
Organic Visits And Backlinks Ppt PowerPoint Presentation Inspiration Example Introduction
This is a Organic Visits And Backlinks Ppt PowerPoint Presentation Inspiration Example Introduction. This is a two stage process. The stages in this process are Business, Marketing, Finance, Success, Growth.
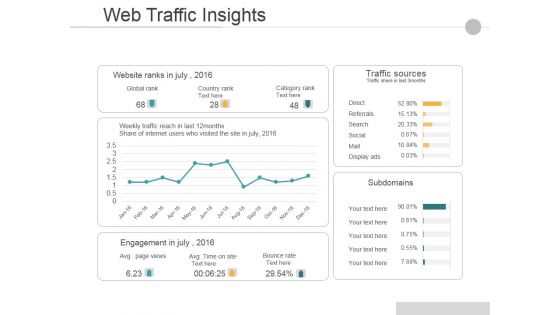
Web Traffic Insights Ppt PowerPoint Presentation Professional Show
This is a web traffic insights ppt powerpoint presentation professional show. This is a four stage process. The stages in this process are website ranks in july, traffic sources, subdomains, engagement in july.
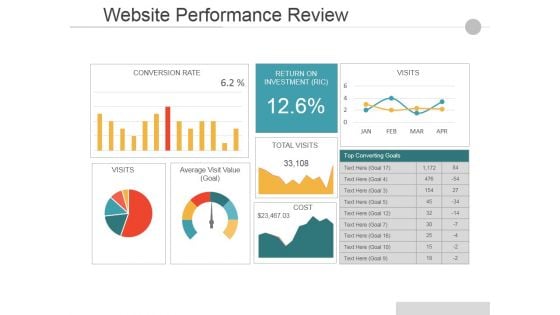
Website Performance Review Template Ppt PowerPoint Presentation Show Inspiration
This is a website performance review template ppt powerpoint presentation show inspiration. This is a six stage process. The stages in this process are average visit time, organic branded, conversion rate, site consumption time, online transaction, traffic source.
Website Performance Review Ppt PowerPoint Presentation Icon Deck
This is a website performance review ppt powerpoint presentation icon deck. This is a three stage process. The stages in this process are conversion rate, average visit value goal, visits.
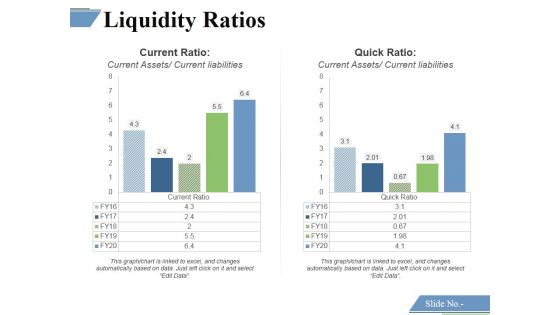
Liquidity Ratios Template 1 Ppt PowerPoint Presentation Outline Themes
This is a liquidity ratios template 1 ppt powerpoint presentation outline themes. This is a two stage process. The stages in this process are current ratio, quick ratio.
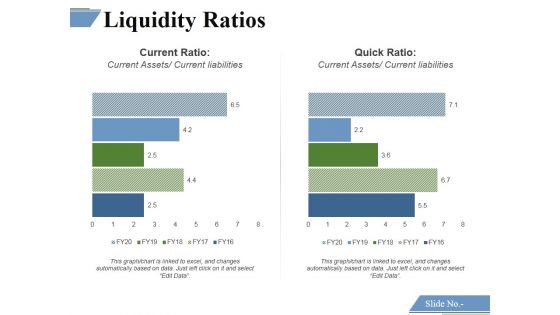
Liquidity Ratios Template 2 Ppt PowerPoint Presentation File Topics
This is a liquidity ratios template 2 ppt powerpoint presentation file topics. This is a two stage process. The stages in this process are current ratio, quick ratio, current assets current liabilities, current assets current liabilities.
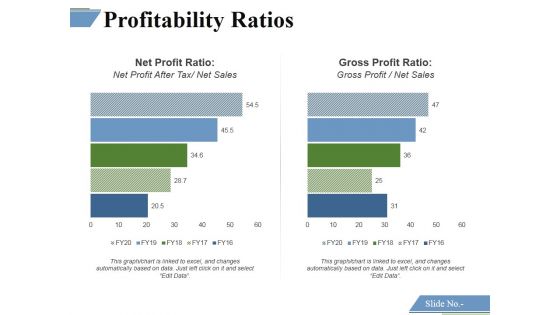
Profitability Ratios Template 1 Ppt PowerPoint Presentation Outline Deck
This is a profitability ratios template 1 ppt powerpoint presentation outline deck. This is a two stage process. The stages in this process are net profit ratio, gross profit ratio.
Profitability Ratios Template 2 Ppt PowerPoint Presentation Icon Diagrams
This is a profitability ratios template 2 ppt powerpoint presentation icon diagrams. This is a two stage process. The stages in this process are net profit ratio, gross profit ratio.
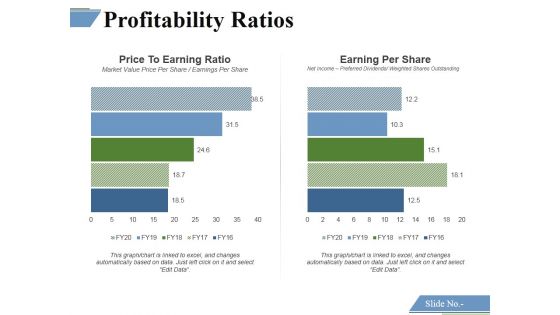
Profitability Ratios Template 3 Ppt PowerPoint Presentation Summary Files
This is a profitability ratios template 3 ppt powerpoint presentation summary files. This is a two stage process. The stages in this process are price to earning ratio, earning per share.

Profitability Ratios Template 4 Ppt PowerPoint Presentation Ideas Graphic Images
This is a profitability ratios template 4 ppt powerpoint presentation ideas graphic images. This is a two stage process. The stages in this process are price to earning ratio, earning per share.
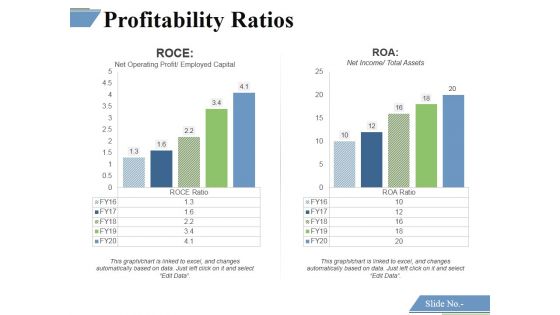
Profitability Ratios Template 6 Ppt PowerPoint Presentation Portfolio Graphics
This is a profitability ratios template 6 ppt powerpoint presentation portfolio graphics. This is a two stage process. The stages in this process are roce, roa.
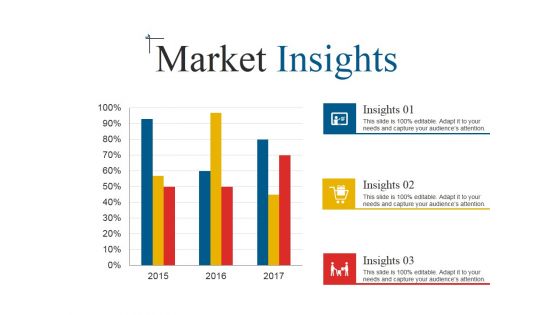
Market Insights Template 2 Ppt PowerPoint Presentation Portfolio Display
This is a market insights template 2 ppt powerpoint presentation portfolio display. This is a three stage process. The stages in this process are insights, market insights, business, marketing, success.
Our Target Market Template 2 Ppt PowerPoint Presentation Slides Icons
This is a our target market template 2 ppt powerpoint presentation slides icons. This is a four stage process. The stages in this process are market, business, marketing, success, management.
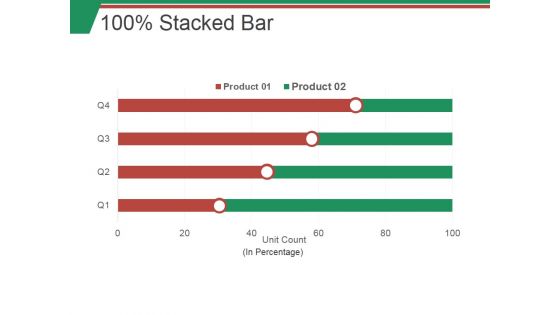
100 Stacked Bar Ppt PowerPoint Presentation Slides Skills
This is a 100 stacked bar ppt powerpoint presentation slides skills. This is a four stage process. The stages in this process are business, marketing, bar, finance, strategy.
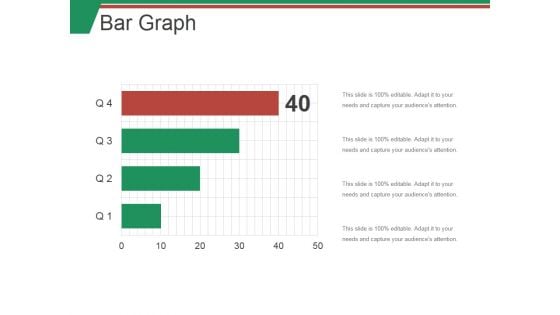
Bar Graph Ppt PowerPoint Presentation Outline Aids
This is a bar graph ppt powerpoint presentation outline aids. This is a four stage process. The stages in this process are bar, graph, finance, marketing, strategy.
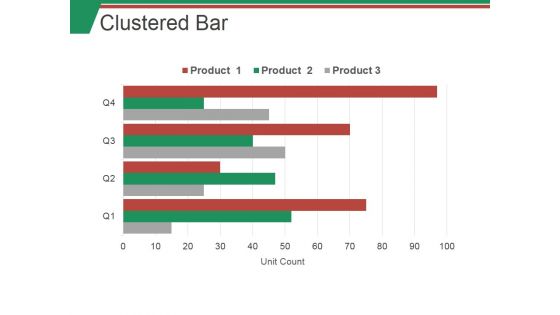
Clustered Bar Ppt PowerPoint Presentation Infographic Template Guidelines
This is a clustered bar ppt powerpoint presentation infographic template guidelines. This is a four stage process. The stages in this process are business, marketing, bar, finance, strategy.
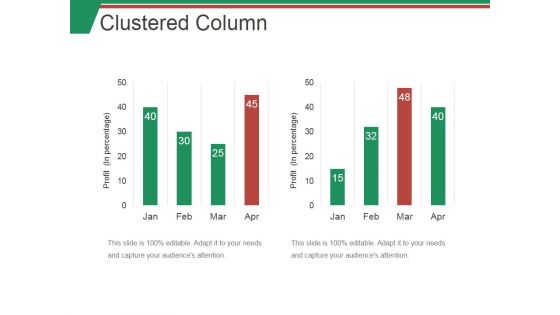
Clustered Column Ppt PowerPoint Presentation Summary Topics
This is a clustered column ppt powerpoint presentation summary topics. This is a two stage process. The stages in this process are bar, graph, finance, marketing, strategy.
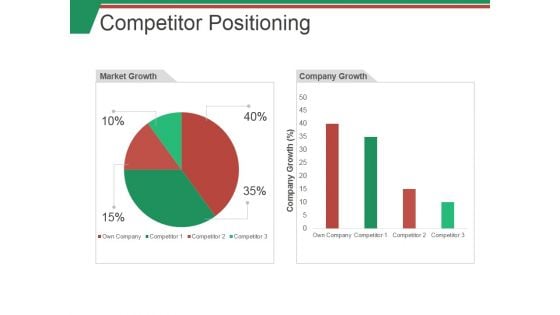
Competitor Positioning Ppt PowerPoint Presentation Show Example Introduction
This is a competitor positioning ppt powerpoint presentation show example introduction. This is a two stage process. The stages in this process are market growth, company growth, business, finance, percentage.
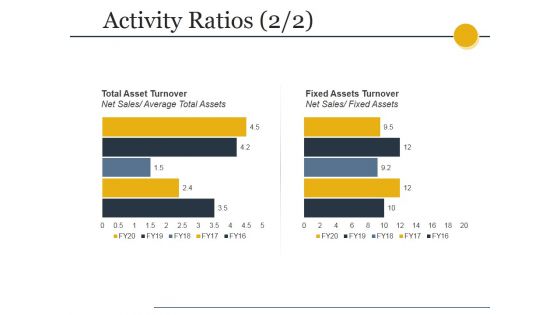
Activity Ratios Template 1 Ppt PowerPoint Presentation Outline Design Templates
This is a activity ratios template 1 ppt powerpoint presentation outline design templates. This is a two stage process. The stages in this process are inventory turnover, receivable turnover, graph, success, growth.
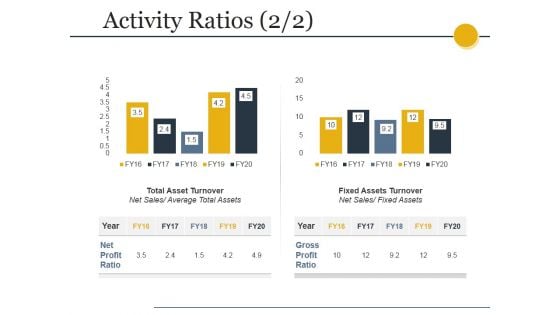
Activity Ratios Template 3 Ppt PowerPoint Presentation Professional Example
This is a activity ratios template 3 ppt powerpoint presentation professional example. This is a two stage process. The stages in this process are total asset turnover, net sales, fixed assets turnover, fixed assets.
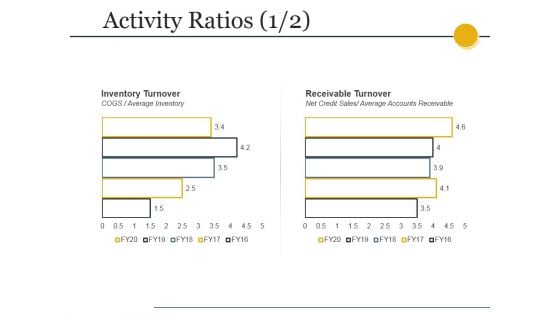
Activity Ratios Template Ppt PowerPoint Presentation Summary Slides
This is a activity ratios template ppt powerpoint presentation summary slides. This is a two stage process. The stages in this process are total asset turnover, net sales, fixed assets turnover, fixed assets.
Activity Ratios Ppt PowerPoint Presentation Icon Themes
This is a activity ratios ppt powerpoint presentation icon themes. This is a two stage process. The stages in this process are inventory turnover, cogs, average inventory, receivable turnover, net credit sales, average accounts receivable .
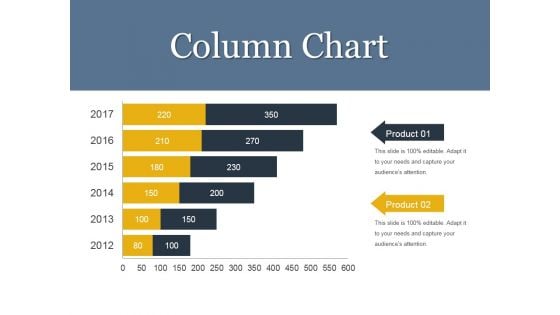
Column Chart Ppt PowerPoint Presentation Show Pictures
This is a column chart ppt powerpoint presentation show pictures. This is a six stage process. The stages in this process are business, finance, planning, years, marketing.
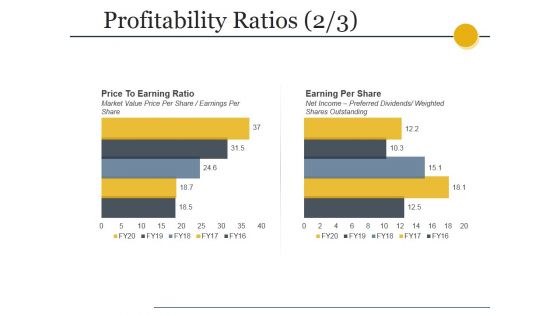
Profitability Ratios Template 2 Ppt PowerPoint Presentation Gallery Designs
This is a profitability ratios template 2 ppt powerpoint presentation gallery designs. This is a two stage process. The stages in this process are price to earning ratio, market value price per share earnings per share, earning per share, net income preferred dividends, weighted shares outstanding.
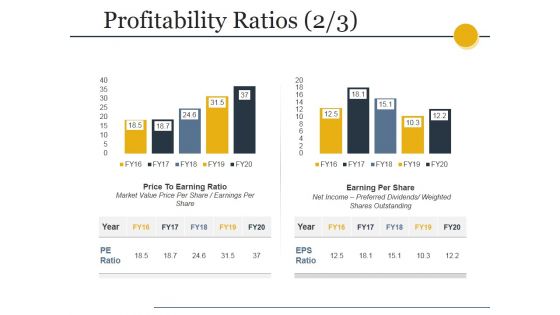
Profitability Ratios Template 4 Ppt PowerPoint Presentation Professional Deck
This is a profitability ratios template 4 ppt powerpoint presentation professional deck. This is a two stage process. The stages in this process are price to earning ratio, market value price per share earnings per share, earning per share, net income preferred dividends, weighted shares outstanding.
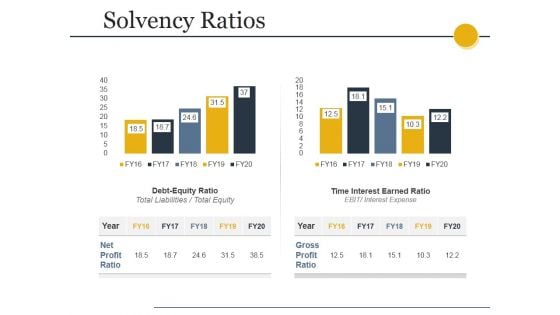
Solvency Ratios Ppt PowerPoint Presentation Inspiration Guidelines
This is a solvency ratios ppt powerpoint presentation inspiration guidelines. This is a two stage process. The stages in this process are debt equity ratio, total liabilities total equity, time interest earned ratio, ebit interest expense.
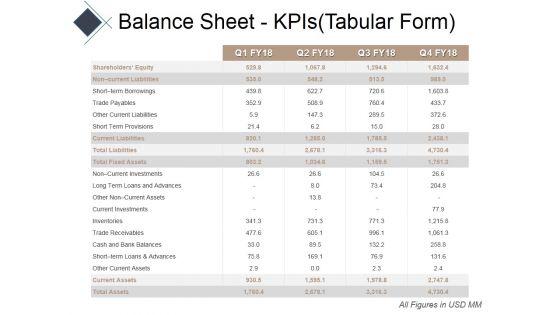
Balance Sheet Kpis Tabular Form Ppt PowerPoint Presentation Show Example Introduction
This is a balance sheet kpis tabular form ppt powerpoint presentation show example introduction. This is a four stage process. The stages in this process are current assets, current liabilities, total assets, total liabilities.
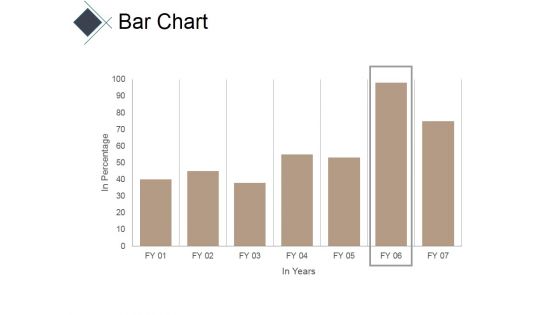
Bar Chart Ppt PowerPoint Presentation Model Good
This is a bar chart ppt powerpoint presentation model good. This is a seven stage process. The stages in this process are business, marketing, bar, success, finance.
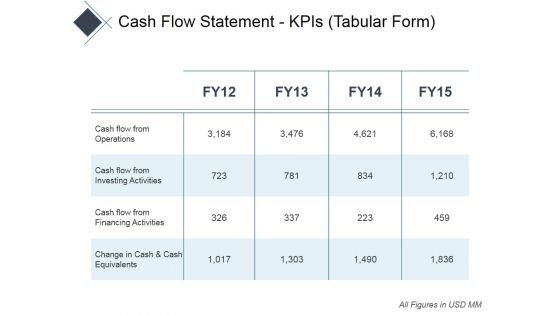
Cash Flow Statement Kpis Tabular Form Ppt PowerPoint Presentation Infographics Professional
This is a cash flow statement kpis tabular form ppt powerpoint presentation infographics professional. This is a four stage process. The stages in this process are operations, financing activities, investing activities, net increase in cash.
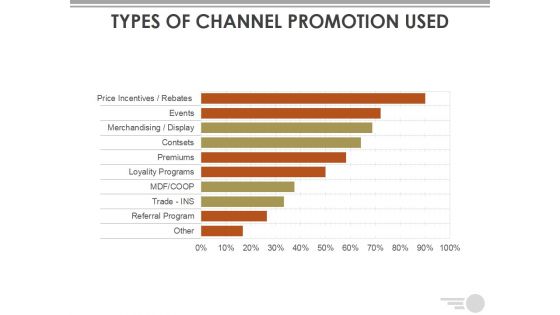
Types Of Channel Promotion Used Ppt PowerPoint Presentation Outline Display
This is a types of channel promotion used ppt powerpoint presentation outline display. This is a ten stage process. The stages in this process are bar graph, business, marketing, strategy, charts.
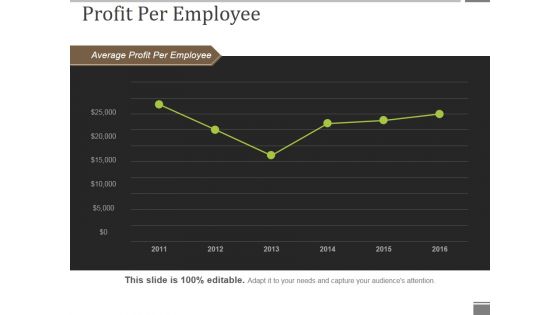
Profit Per Employee Ppt PowerPoint Presentation Show Portfolio
This is a profit per employee ppt powerpoint presentation show portfolio. This is a six stage process. The stages in this process are average profit per employee, line chart, business, marketing, success.

Staff Acquisition Cost Cost Per Hire Ppt PowerPoint Presentation Styles Guidelines
This is a staff acquisition cost cost per hire ppt powerpoint presentation styles guidelines. This is a seven stage process. The stages in this process are cost per hire, bar graph, business, marketing, planning.
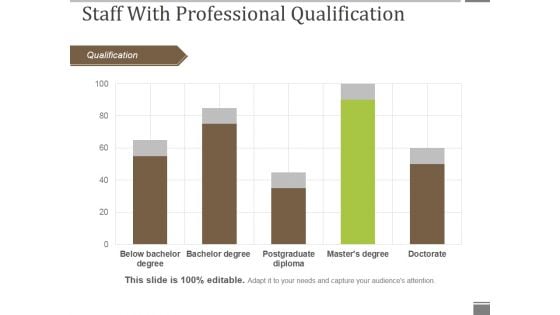
Staff With Professional Qualification Ppt PowerPoint Presentation Gallery Graphics Pictures
This is a staff with professional qualification ppt powerpoint presentation gallery graphics pictures. This is a five stage process. The stages in this process are qualification, bar graph, business, marketing, success.
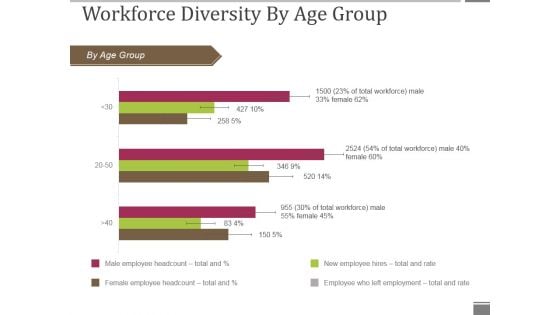
Workforce Diversity By Age Group Ppt PowerPoint Presentation Visual Aids Gallery
This is a workforce diversity by age group ppt powerpoint presentation visual aids gallery. This is a three stage process. The stages in this process are by age group, bar graph, business, marketing, presentation.
Workforce Diversity By Region Ppt PowerPoint Presentation Icon Graphics Pictures
This is a workforce diversity by region ppt powerpoint presentation icon graphics pictures. This is a four stage process. The stages in this process are by region, bar graph, business, presentation, marketing.

Column Chart Ppt PowerPoint Presentation Styles Graphic Tips
This is a column chart ppt powerpoint presentation styles graphic tips. This is a six stage process. The stages in this process are slide bar, business, marketing, strategy, finance.
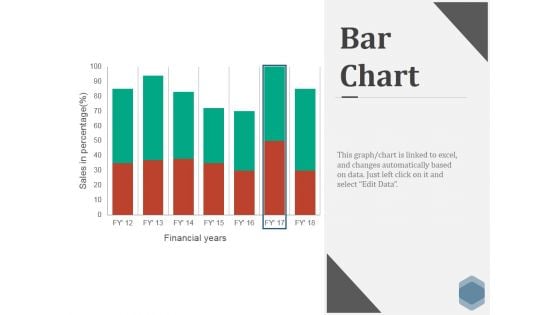
Bar Chart Ppt PowerPoint Presentation Infographics Skills
This is a bar chart ppt powerpoint presentation infographics skills. This is a seven stage process. The stages in this process are business, marketing, strategy, finance, bar.
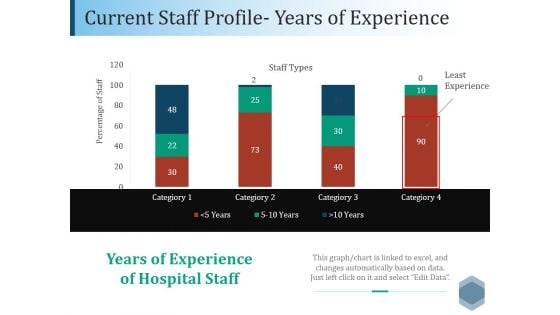
Current Staff Profile Years Of Experience Ppt PowerPoint Presentation File Graphics Tutorials
This is a current staff profile years of experience ppt powerpoint presentation file graphics tutorials. This is a four stage process. The stages in this process are business, marketing, strategy, finance, bar.
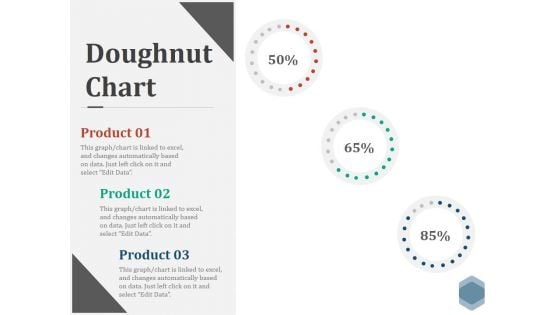
Doughnut Chart Ppt PowerPoint Presentation Visual Aids Files
This is a doughnut chart ppt powerpoint presentation visual aids files. This is a three stage process. The stages in this process are finance, donut, percentage, business, marketing.
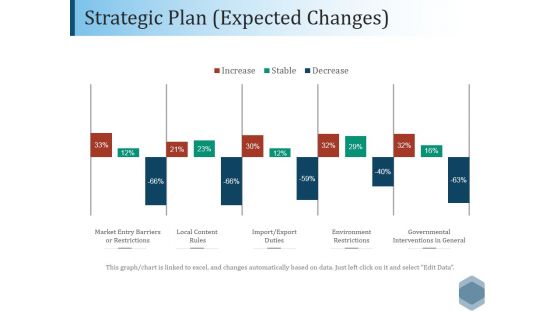
Strategic Plan Expected Changes Ppt PowerPoint Presentation Pictures Outline
This is a strategic plan expected changes ppt powerpoint presentation pictures outline. This is a five stage process. The stages in this process are market entry barriers or restrictions, local content, rules, import export, duties, environment restrictions, governmental interventions in general.
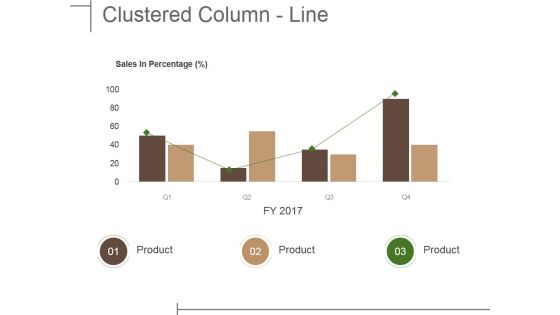
Clustered Column Line Ppt PowerPoint Presentation File Shapes
This is a clustered column line ppt powerpoint presentation file shapes. This is a four stage process. The stages in this process are business, marketing, strategy, bar, success.
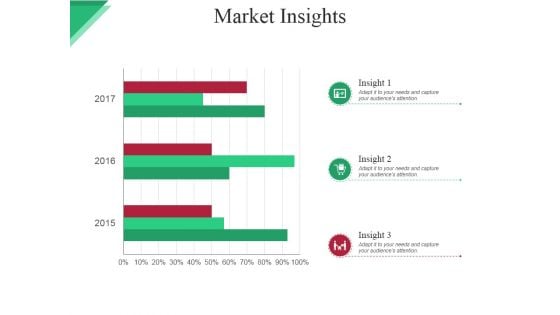
Market Insights Ppt PowerPoint Presentation Infographics Graphics
This is a market insights ppt powerpoint presentation infographics graphics. This is a three stage process. The stages in this process are icons, business, bar, marketing, strategy.
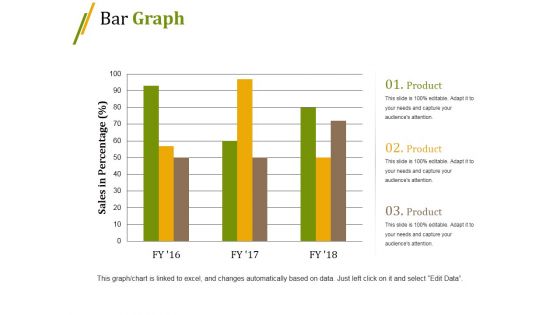
Bar Graph Ppt PowerPoint Presentation Professional Gridlines
This is a bar graph ppt powerpoint presentation professional gridlines. This is a three stage process. The stages in this process are bar, marketing, strategy, planning, growth.
Brand Tracking Info Graphics Ppt PowerPoint Presentation Model Example
This is a brand tracking info graphics ppt powerpoint presentation model example. This is a four stage process. The stages in this process are finance, marketing, percentage, business, icons.
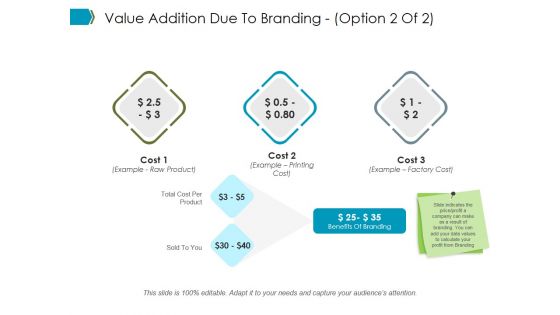
Value Addition Due To Branding Template 1 Ppt PowerPoint Presentation Pictures Inspiration
This is a value addition due to branding template 1 ppt powerpoint presentation pictures inspiration. This is a three stage process. The stages in this process are business, marketing, strategy, finance, planning.
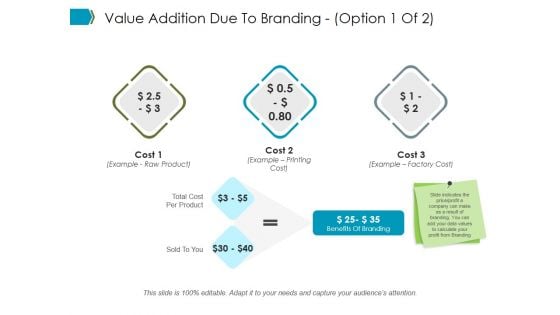
Value Addition Due To Branding Template Ppt PowerPoint Presentation Slide
This is a value addition due to branding template ppt powerpoint presentation slide. This is a three stage process. The stages in this process are business, marketing, strategy, finance, planning.
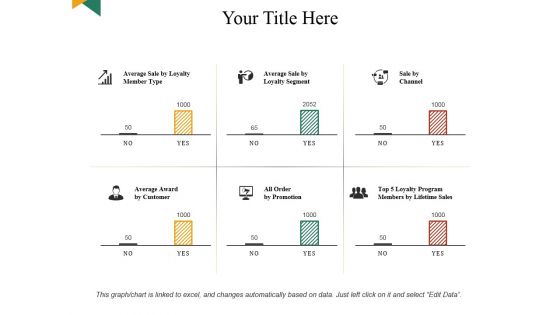
Your Title Here Ppt PowerPoint Presentation Professional File Formats
This is a your title here ppt powerpoint presentation professional file formats. This is a six stage process. The stages in this process are business, marketing, strategy, finance, planning.
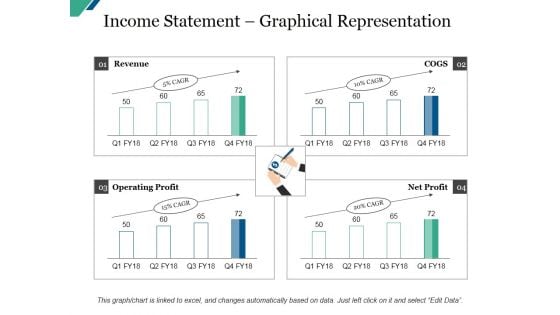
Income Statement Graphical Representation Ppt PowerPoint Presentation Summary Gallery
This is a income statement graphical representation ppt powerpoint presentation summary gallery. This is a four stage process. The stages in this process are current assets, current liabilities, total assets, total liabilities.
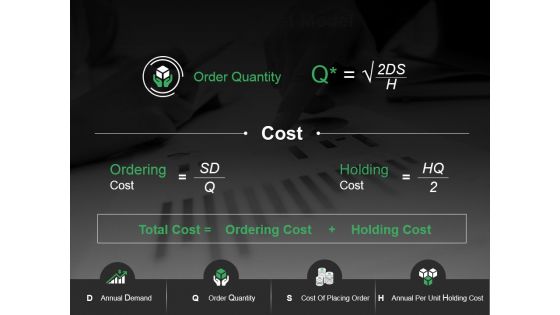
Eoq Cost Model Ppt PowerPoint Presentation Gallery Infographic Template
This is a eoq cost model ppt powerpoint presentation gallery infographic template. This is a two stage process. The stages in this process are ordering cost, holding cost, order quantity, total cost, order quantity.
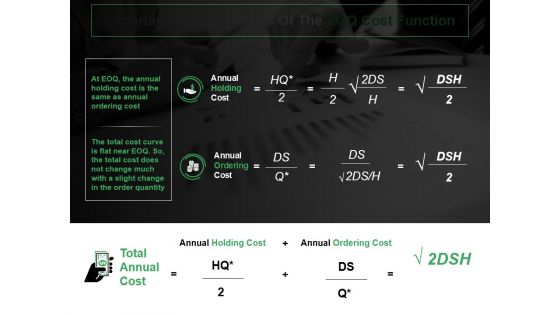
Important Characteristics Of The Eoq Cost Function Ppt PowerPoint Presentation Diagram Images
This is a important characteristics of the eoq cost function ppt powerpoint presentation diagram images. This is a two stage process. The stages in this process are annual holding cos, annual ordering cost, total annual cost.
Health Scorecard Ppt PowerPoint Presentation Layouts Icons
This is a health scorecard ppt powerpoint presentation layouts icons. This is a three stage process. The stages in this process are plan, marketing, finance, planning, strategy.
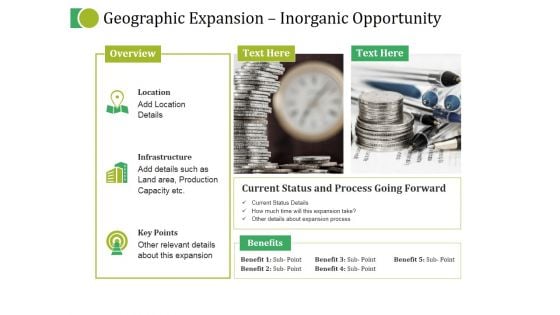
Geographic Expansion Inorganic Opportunity Ppt PowerPoint Presentation Summary
This is a geographic expansion inorganic opportunity ppt powerpoint presentation summary. This is a three stage process. The stages in this process are overview, benefits, current status and process going forward, location, infrastructure.
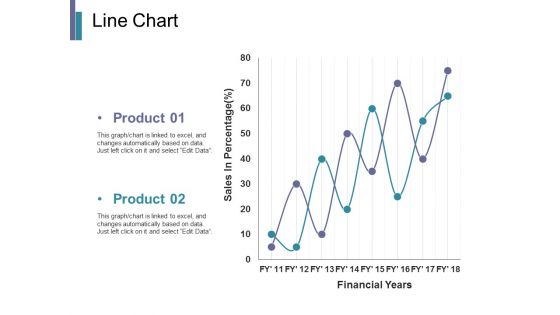
Line Chart Ppt PowerPoint Presentation Portfolio Inspiration
This is a line chart ppt powerpoint presentation portfolio inspiration. This is a two stage process. The stages in this process are business, marketing, strategy, planning, finance.
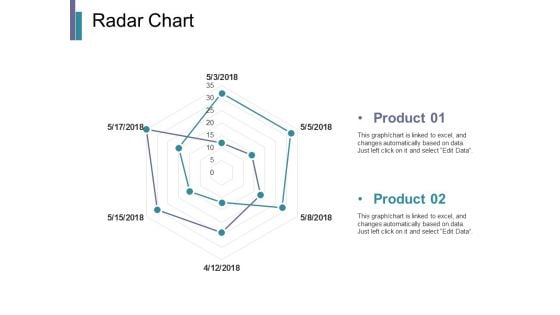
Radar Chart Ppt PowerPoint Presentation Infographics Pictures
This is a radar chart ppt powerpoint presentation infographics pictures. This is a two stage process. The stages in this process are business, marketing, strategy, planning, finance.
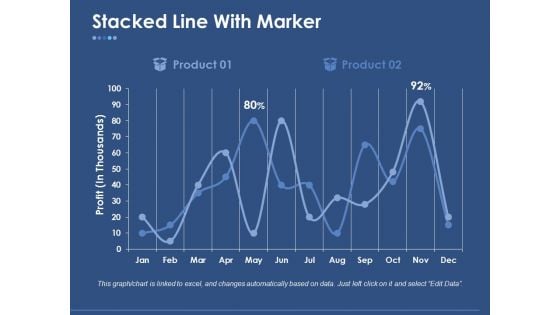
Stacked Line With Marker Ppt PowerPoint Presentation Layouts Summary
This is a stacked line with marker ppt powerpoint presentation layouts summary. This is a two stage process. The stages in this process are finance, marketing, strategy, planning, management.
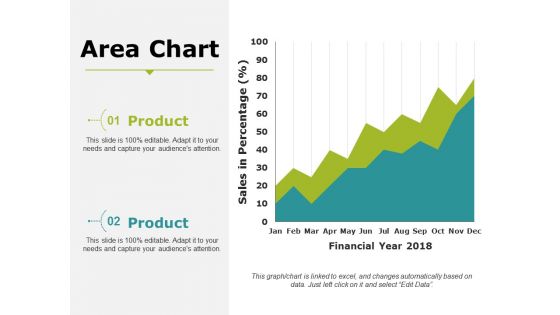
Area Chart Ppt PowerPoint Presentation Infographic Template Portrait
This is a area chart ppt powerpoint presentation infographic template portrait. This is a two stage process. The stages in this process are business, marketing, strategy, planning, finance.
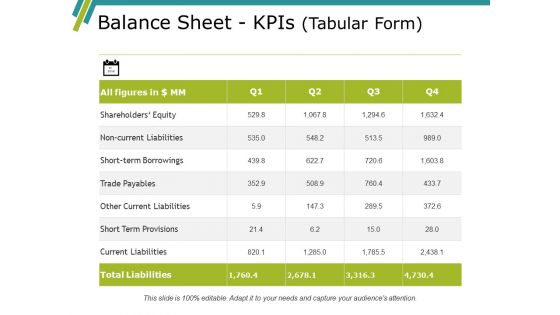
Balance Sheet Kpis Template 1 Ppt PowerPoint Presentation Professional Graphics Download
This is a balance sheet kpis template 1 ppt powerpoint presentation professional graphics download. This is a four stage process. The stages in this process are current assets, current liabilities, total assets, total liabilities.
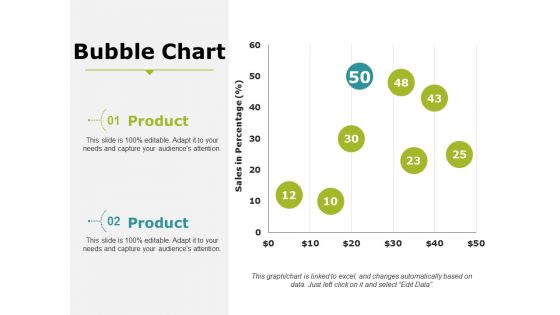
Bubble Chart Ppt PowerPoint Presentation Portfolio Show
This is a bubble chart ppt powerpoint presentation portfolio show. This is a two stage process. The stages in this process are business, marketing, strategy, planning, finance.
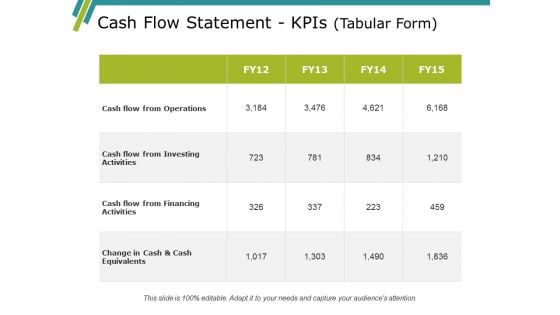
Cash Flow Statement Kpis Template Ppt PowerPoint Presentation Pictures Diagrams
This is a cash flow statement kpis template ppt powerpoint presentation pictures diagrams. This is a four stage process. The stages in this process are operations, financing activities, investing activities, net increase in cash.
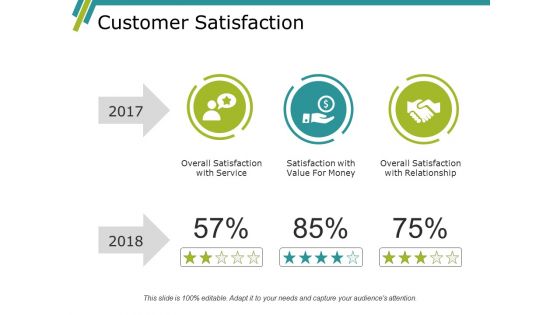
Customer Satisfaction Ppt PowerPoint Presentation Gallery Rules
This is a customer satisfaction ppt powerpoint presentation gallery rules. This is a three stage process. The stages in this process are business, marketing, strategy, planning, finance.


 Continue with Email

 Home
Home


