Financial Analysis

Taxation Ppt PowerPoint Presentation Infographics Graphics Example
This is a taxation ppt powerpoint presentation infographics graphics example. This is a one stage process. The stages in this process are finance, marketing, strategy, management, planning.
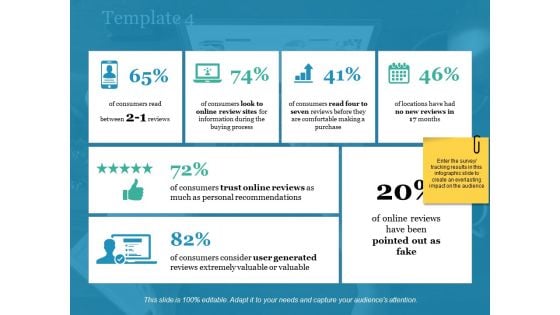
Template 4 Ppt PowerPoint Presentation Summary Demonstration
This is a template 4 ppt powerpoint presentation summary demonstration. This is a six stage process. The stages in this process are look to online review sites, read four to seven reviews before, no new reviews in 17, pointed out as fake.
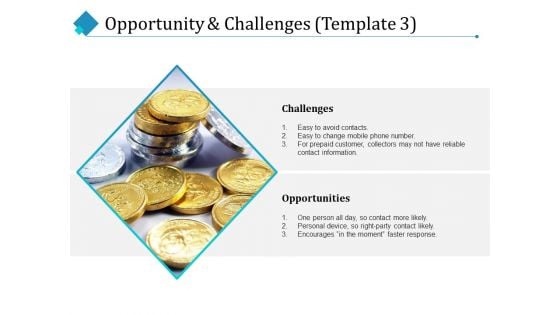
Opportunity And Challenges Finance Ppt PowerPoint Presentation Layouts Format
This is a opportunity and challenges finance ppt powerpoint presentation layouts format. This is a two stage process. The stages in this process are challenges, opportunities, business, planning, marketing.
Cash Flow Green Drop With Dollar Symbol Ppt PowerPoint Presentation Professional Graphic Tips
This is a cash flow green drop with dollar symbol ppt powerpoint presentation professional graphic tips. This is a four stage process. The stages in this process are liquidity, cash assets, solvency.
Quality Audit Report Vector Icon Ppt PowerPoint Presentation Slides Graphics PDF
Presenting this set of slides with name quality audit report vector icon ppt powerpoint presentation slides graphics pdf. This is a three stage process. The stages in this process are quality audit report vector icon. This is a completely editable PowerPoint presentation and is available for immediate download. Download now and impress your audience.
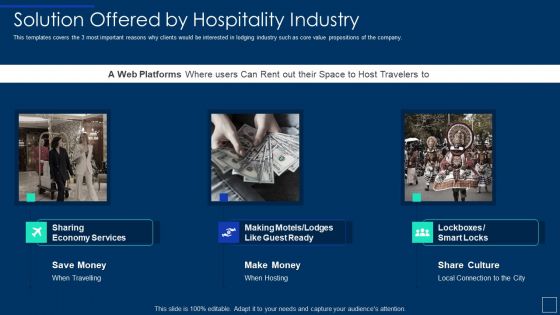
Solution Offered By Hospitality Industry Ppt Guidelines PDF
This templates covers the 3 most important reasons why clients would be interested in lodging industry such as core value propositions of the company. Presenting solution offered by hospitality industry ppt guidelines pdf to provide visual cues and insights. Share and navigate important information on three stages that need your due attention. This template can be used to pitch topics like solution offered by hospitality industry . In addtion, this PPT design contains high resolution images, graphics, etc, that are easily editable and available for immediate download.
Stock Market Research Report Asset Management Turnover Ratios FY 19 For Equity Research Icons PDF
The following slide displays the analysis of the companys asset management or turnover ratio of the financial year 19 as it analysis the account payable ratio, asset turnover ratio , fixed asset turnover ratio and inventory turnover ratio. This is a stock market research report asset management turnover ratios fy 19 for equity research icons pdf template with various stages. Focus and dispense information on five stages using this creative set, that comes with editable features. It contains large content boxes to add your information on topics like account payable turnover ratio, asset turnover ratio, fixed asset turnover ratio, inventory turnover ratio, receivable turnover ratio. You can also showcase facts, figures, and other relevant content using this PPT layout. Grab it now.
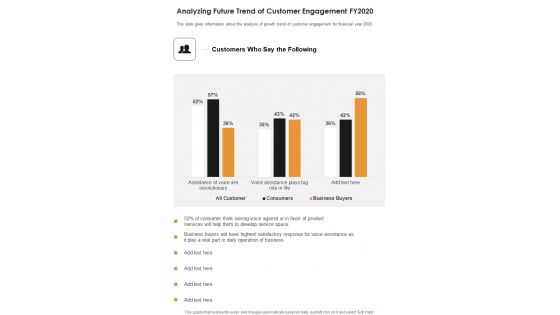
Analyzing Future Trend Of Customer Engagement FY2020 One Pager Documents
This slide gives information about the analysis of growth trend of customer engagement for financial year 2020. Presenting you a fantastic Analyzing Future Trend Of Customer Engagement FY2020 One Pager Documents. This piece is crafted on hours of research and professional design efforts to ensure you have the best resource. It is completely editable and its design allow you to rehash its elements to suit your needs. Get this Analyzing Future Trend Of Customer Engagement FY2020 One Pager Documents A4 One-pager now.
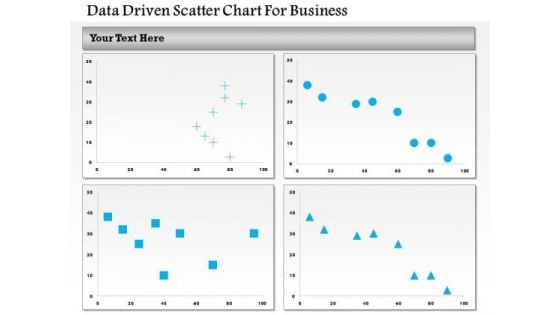
Business Diagram Data Driven Scatter Chart For Business PowerPoint Slide
This business diagram has been designed with four comparative charts. This slide suitable for data representation. You can also use this slide to present business analysis and reports. Use this diagram to present your views in a wonderful manner.
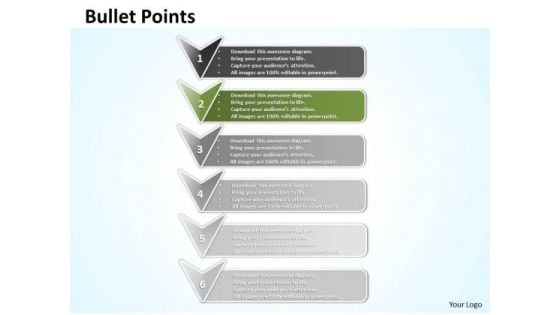
Ppt Arrows PowerPoint 2010 Pointing Vertical Downwards Templates
PPT arrows powerpoint 2010 pointing vertical downwards Templates-Arrows PowerPoint Diagram is nice for financial PowerPoint Diagram presentations as well as other analysis or business PowerPoint diagram needs. Use this graphical approach to represent global business issues such as financial data, stock market Exchange, increase in sales, corporate presentations and more.-PPT arrows powerpoint 2010 pointing vertical downwards Templates-advertising, arrow, bend, black, blue, bookmark, business, collection, control, corner, curl, customer, design, down, element, gold, green, icon, illustration, label, mark, marketing, message, new, origami, paper, product, service, set, shadow, shiny, shop, sign, site, sticker, symbol, tag Take care of your organizationwith our Ppt Arrows PowerPoint 2010 Pointing Vertical Downwards Templates. You'll deliver your best presentation yet.
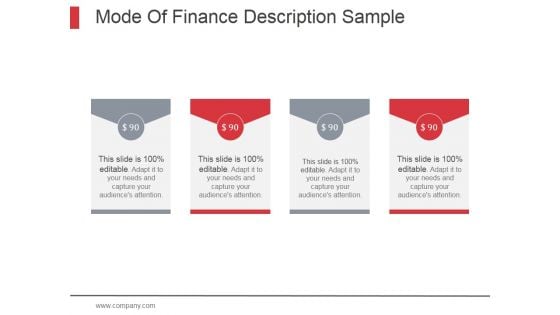
Mode Of Finance Description Sample Ppt PowerPoint Presentation Example 2015
This is a mode of finance description sample ppt powerpoint presentation example 2015. This is a four stage process. The stages in this process are mode of finance, financial description, financial modes.
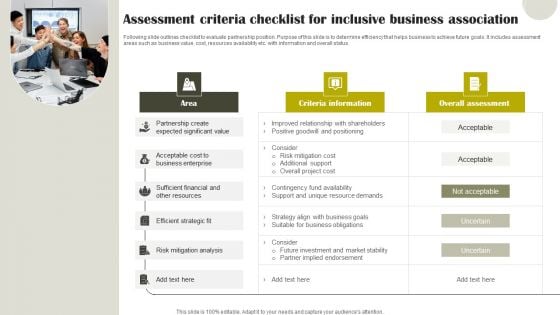
Assessment Criteria Checklist For Inclusive Business Association Pictures PDF
Following slide outlines checklist to evaluate partnership position. Purpose of this slide is to determine efficiency that helps business to achieve future goals. It includes assessment areas such as business value, cost, resources availability etc. with information and overall status. Presenting Assessment Criteria Checklist For Inclusive Business Association Pictures PDF to dispense important information. This template comprises three stages. It also presents valuable insights into the topics including Criteria Information, Risk Mitigation Analysis, Sufficient Financial. This is a completely customizable PowerPoint theme that can be put to use immediately. So, download it and address the topic impactfully.
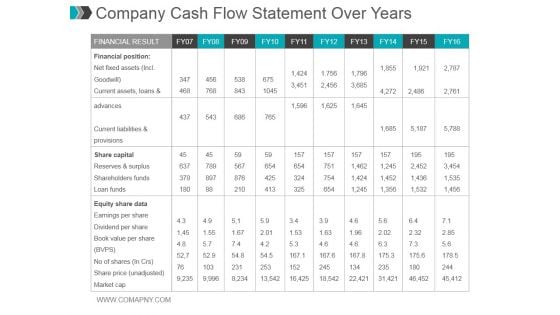
Company Cash Flow Statement Over Years Ppt PowerPoint Presentation Gallery
This is a company cash flow statement over years ppt powerpoint presentation gallery. This is ten stage process. The stages in this process are financial result, financial position, share capital, equity share data.

Microfinance Aiding Strategy For Urban Sector Development Complete Guide To Microfinance Fin SS V
This slide illustrates the strategy on how microfinance helps in aiding and development of urban sector. The steps involved in development are market analysis, product diversification, digital accessibility, and financial inclusion. The best PPT templates are a great way to save time, energy, and resources. Slidegeeks have 100 percent editable powerpoint slides making them incredibly versatile. With these quality presentation templates, you can create a captivating and memorable presentation by combining visually appealing slides and effectively communicating your message. Download Microfinance Aiding Strategy For Urban Sector Development Complete Guide To Microfinance Fin SS V from Slidegeeks and deliver a wonderful presentation. This slide illustrates the strategy on how microfinance helps in aiding and development of urban sector. The steps involved in development are market analysis, product diversification, digital accessibility, and financial inclusion.

Revenue Incorporation Projection Report Review Themes Pdf
This slide depicts incorporation analysis which help manager to identifies recent sales numbers, financial outcomes and business performance. It include pointers such as area, product, budget for current year, actual sales and budget for future period. Pitch your topic with ease and precision using this Revenue Incorporation Projection Report Review Themes Pdf This layout presents information on Sales Budget, Budget For Current, California It is also available for immediate download and adjustment. So, changes can be made in the color, design, graphics or any other component to create a unique layout. This slide depicts incorporation analysis which help manager to identifies recent sales numbers, financial outcomes and business performance. It include pointers such as area, product, budget for current year, actual sales and budget for future period.
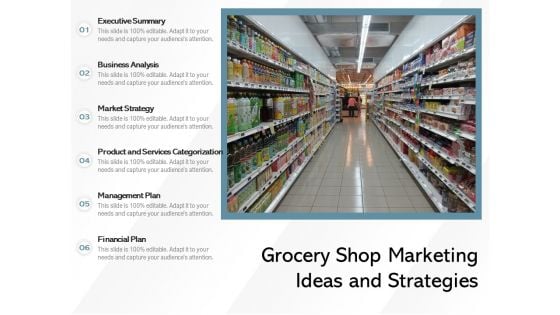
Grocery Shop Marketing Ideas And Strategies Ppt PowerPoint Presentation Model Examples PDF
Presenting this set of slides with name grocery shop marketing ideas and strategies ppt powerpoint presentation model examples pdf. The topics discussed in these slides are executive summary, business analysis, market strategy, product and services categorization, management plan, financial plan . This is a completely editable PowerPoint presentation and is available for immediate download. Download now and impress your audience.
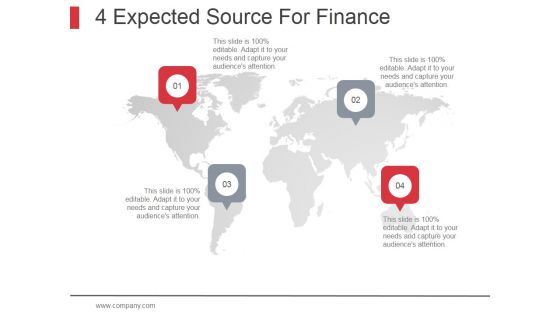
4 Expected Source For Finance Ppt PowerPoint Presentation Tips
This is a 4 expected source for finance ppt powerpoint presentation tips. This is a four stage process. The stages in this process are financial modes, mode of finance.
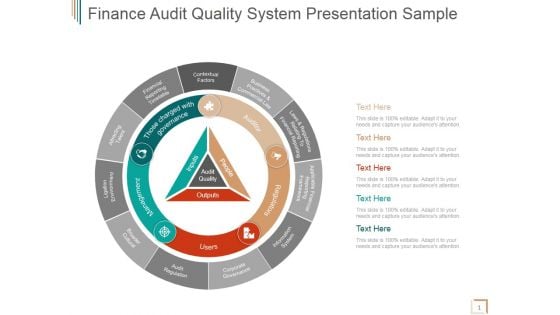
Finance Audit Quality System Ppt PowerPoint Presentation Slides
This is a finance audit quality system ppt powerpoint presentation slides. This is a six stage process. The stages in this process are contextual factors, financial reporting timetable, attracting talent, ligation environment, broader cultural, audit regulation.
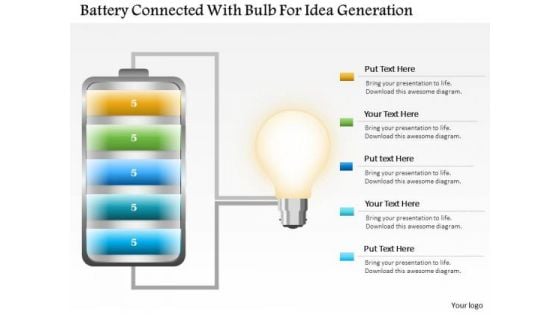
Business Diagram Battery Connected With Bulb For Idea Generation PowerPoint Slide
This business slide displays battery icon connected with bulb. This diagram is a data visualization tool that gives you a simple way to present statistical information. This slide helps your audience examine and interpret the data you present.
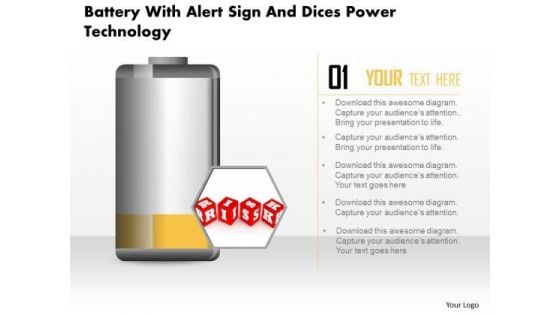
Business Diagram Battery With Alert Sign And Dices Power Technology PowerPoint Slide
This business diagram displays risk alert on battery icon. Use this diagram, in your presentations to display energy saving, battery and technology. Create professional presentations using this diagram slide.

Business Diagram Three Heads With Pie For Data Driven Technology PowerPoint Slide
This business diagram displays three human faces with pie charts. This Power Point template has been designed to compare and present business data. You may use this diagram to impart professional appearance to your presentations.
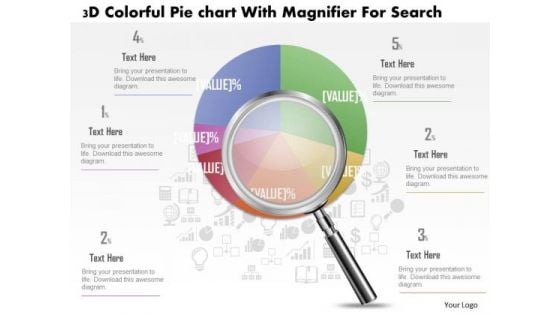
Business Diagram 3d Colorful Pie Graph With Magnifier Data Search PowerPoint Slide
This business slide displays 3d colorful pie graph with magnifier. This diagram is a data visualization tool that gives you a simple way to present statistical information. This slide helps your audience examine and interpret the data you present.

Business Diagram Data Driven Pie Chart Inside The Magnifier PowerPoint Slide
This business slide displays 3d colorful pie graph with magnifier. This diagram is a data visualization tool that gives you a simple way to present statistical information. This slide helps your audience examine and interpret the data you present.
Business Diagram Battery Icon With Power Icons Energy Technology PowerPoint Slide
This business diagram displays battery icon with power charging. Use this diagram, in your presentations to display energy saving, battery and technology. Create professional presentations using this diagram slide.
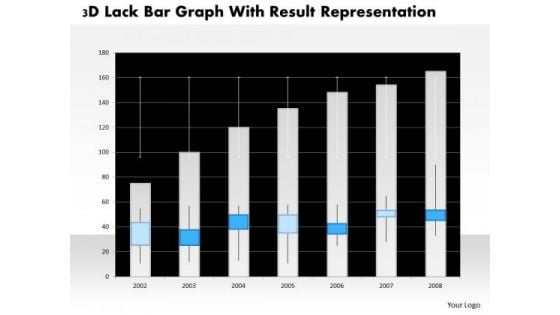
Business Diagram 3d Lack Bar Graph With Result Representation PowerPoint Slide
This business diagram has graphic of 3d lack bar graph. This diagram is a data visualization tool that gives you a simple way to present statistical information. This slide helps your audience examine and interpret the data you present.
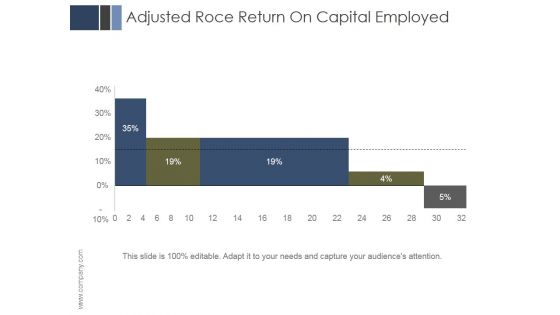
Adjusted Roce Return On Capital Employed Ppt PowerPoint Presentation Samples
This is a adjusted roce return on capital employed ppt powerpoint presentation samples. This is a five stage process. The stages in this process are business, marketing, management, finance, return.
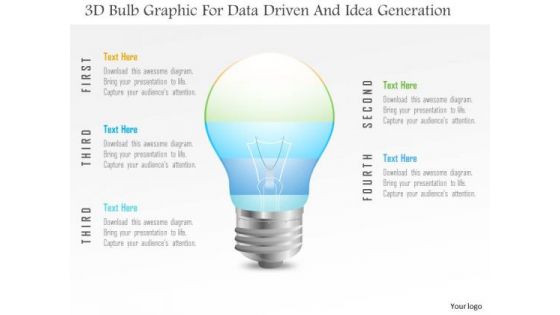
Business Diagram 3d Bulb Graphic For Data Driven And Idea Generation PowerPoint Slide
This Power Point template has been designed with 3d bulb graphic. Use this slide to represent technology idea and strategy concepts. Download this diagram for your business presentations and get exclusive comments on your efforts.
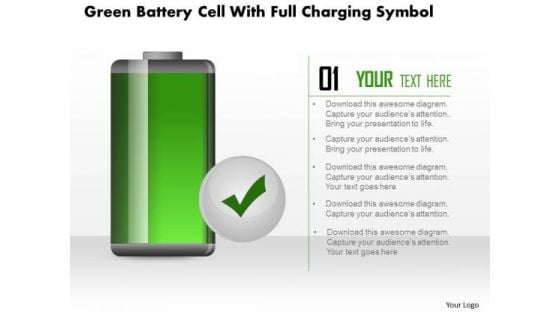
Business Diagram Green Battery Cell With Full Charging Symbol PowerPoint Slide
This business diagram displays full battery charge icon. Use this diagram, in your presentations to display energy saving, battery and technology. Create professional presentations using this diagram slide.
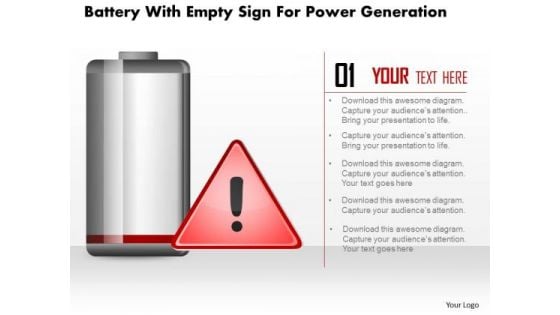
Business Diagram Battery With Empty Sign For Power Generation PowerPoint Slide
This business diagram displays empty sign alert on battery icon. Use this diagram, in your presentations to display energy saving, battery and technology. Create professional presentations using this diagram slide.
Business Diagram Hour Glass With 3d Man And Icons PowerPoint Slide
This diagram displays 3d man with hour glass and icons. This diagram contains concept of communication and technology. Use this diagram to display business process workflows in any presentations.
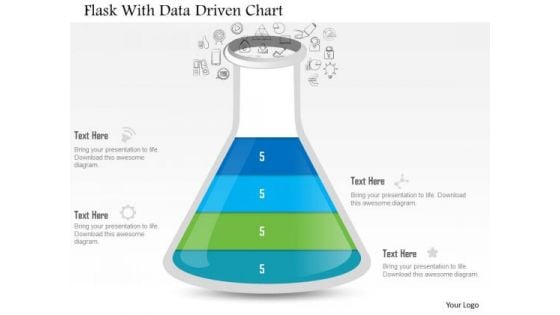
Business Diagram Flask With Data Driven Chart PowerPoint Slide
This data driven diagram has been designed with flask graphics. Download this diagram to give your presentations more effective look. It helps in clearly conveying your message to clients and audience.
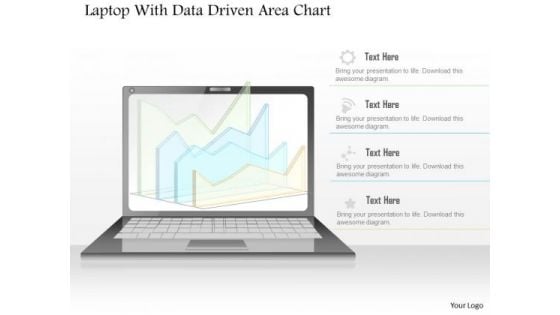
Business Diagram Laptop With Data Driven Area Chart PowerPoint Slide
This diagram has been designed with laptop and data driven area chart. Download this diagram to give your presentations more effective look. It helps in clearly conveying your message to clients and audience.
Business Diagram 3d Capsule With Multiple Icons For Business Data Flow PowerPoint Slide
This diagram has been designed with 3d graphic of capsule with multiple icons. This data driven PowerPoint slide can be used to give your presentations more effective look. It helps in clearly conveying your message to clients and audience.
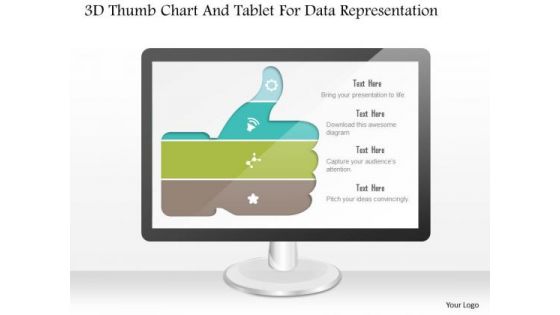
Business Diagram 3d Thumb Chart And Tablet For Data Representation PowerPoint Slide
This business diagram displays graphic of 3d thumb up chart with icons on computer screen. This business slide contains the concept of business data representation. Use this diagram to build professional presentations for your viewers.
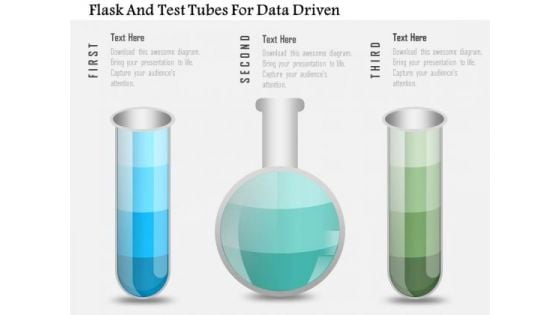
Business Diagram Flask And Test Tubes For Data Driven PowerPoint Slide
This data driven diagram has been designed with flask and test tubes. Download this diagram to give your presentations more effective look. It helps in clearly conveying your message to clients and audience.
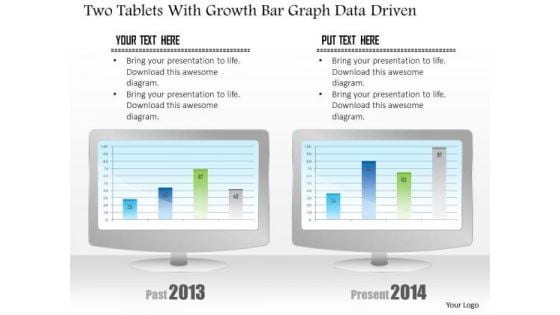
Business Diagram Two Tablets With Growth Bar Graph Data Driven PowerPoint Slide
This business diagram has been designed with comparative charts on tablets. This slide suitable for data representation. You can also use this slide to present business reports and information. Use this diagram to present your views in a wonderful manner.
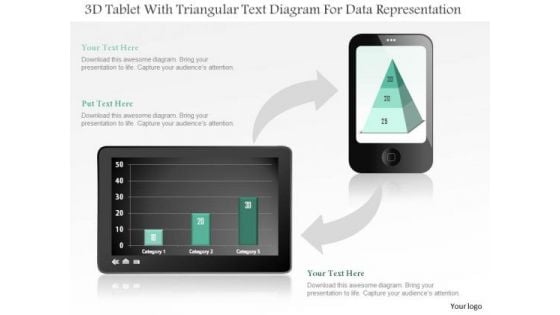
Business Diagram 3d Tablet With Triangular Text Diagram For Data Representation PowerPoint Slide
This business diagram displays bar graph on tablet and pyramid chart on mobile phone. Use this diagram, to make reports for interactive business presentations. Create professional presentations using this diagram.
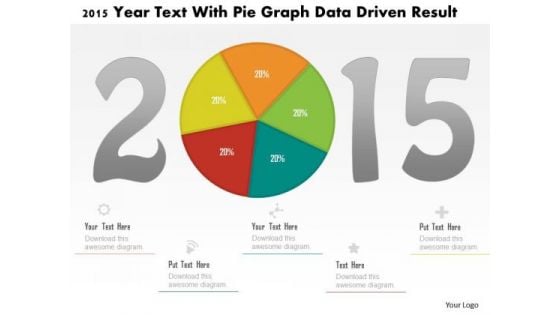
Business Diagram 2015 Year Text With Pie Graph Data Driven Result PowerPoint Slide
This business diagram displays 2015 year numbers with pie chart. This diagram is suitable to display business strategy for year 2015. Download this professional slide to present information in an attractive manner
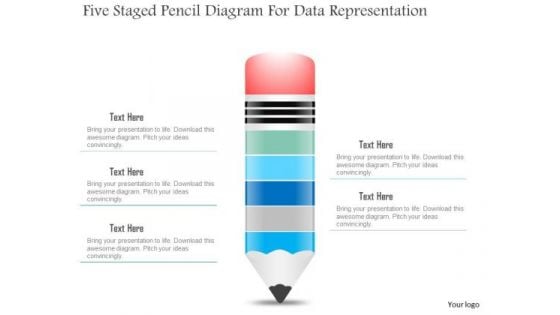
Business Diagram Five Staged Pencil Diagram For Data Representation PowerPoint Slide
This business slide displays five staged pencil diagram. It contains pencil graphic divided into five parts. This diagram slide depicts processes, stages, steps, points, options and education information display. Use this diagram, in your presentations to express your views innovatively.
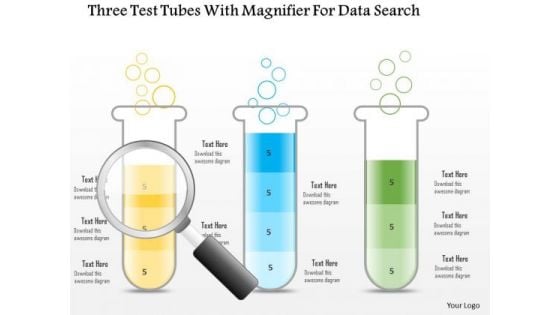
Business Diagram Three Test Tubes With Magnifier For Data Search PowerPoint Slide
This business diagram displays three test tubes with magnifying glass. This diagram is suitable to depict flow of business activities or steps. Download this professional slide to present information in an attractive manner.
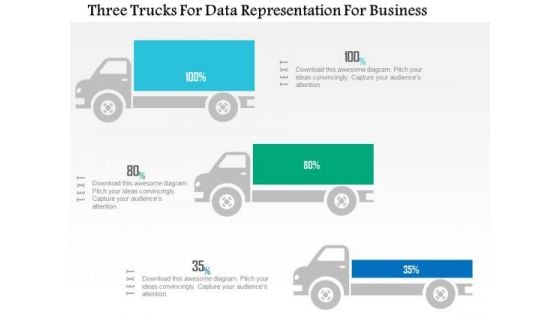
Business Diagram Three Trucks For Data Representation For Business PowerPoint Slide
This business diagram displays three trucks graphic. This diagram contains trucks for percentage value growth. Use this diagram to display business growth over a period of time.
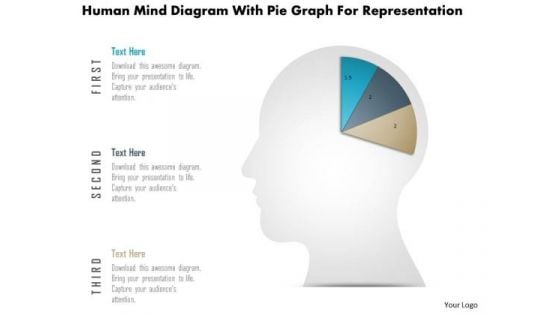
Business Diagram Human Mind Diagram With Pie Graph For Representation PowerPoint Slide
This diagram displays human face graphic divided into sections. This section can be used for data display. Use this diagram to build professional presentations for your viewers.

Business Diagram Six Staged Pie Charts For Text Representation PowerPoint Slide
This slide displays graphic six staged pie charts. Download this diagram to present and compare business data. Use this diagram to display business process workflows in any presentation.
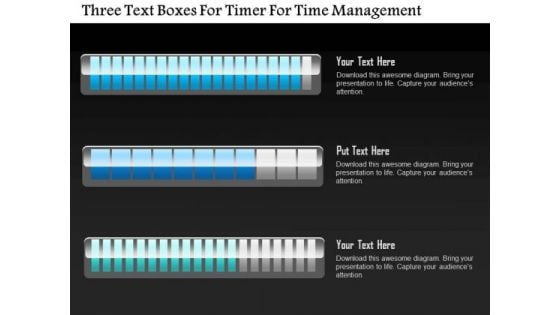
Business Diagram Three Text Boxes For Timer For Time Management PowerPoint Slide
This business diagram displays three text boxes. This diagram contains text boxes for data representation. Use this diagram to display business process workflows in any presentations.
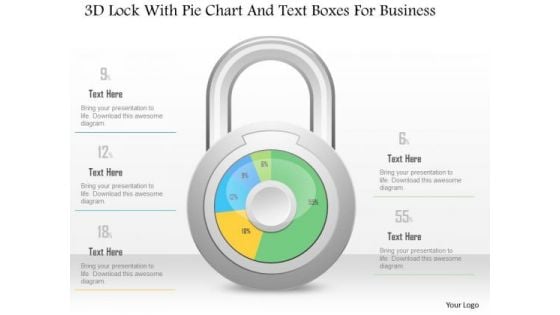
Business Diagram 3d Lock With Pie Chart And Text Boxes For Business PowerPoint Slide
This Power Point diagram has been crafted with pie chart in shape of lock. It contains diagram of lock pie chart to compare and present data in an effective manner. Use this diagram to build professional presentations for your viewers.
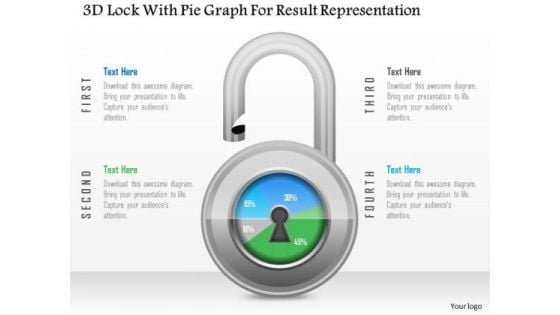
Business Diagram 3d Lock With Pie Graph For Result Representation PowerPoint Slide
This Power Point diagram has been crafted with pie chart in shape of lock. It contains diagram of lock pie chart to compare and present data in an effective manner. Use this diagram to build professional presentations for your viewers.
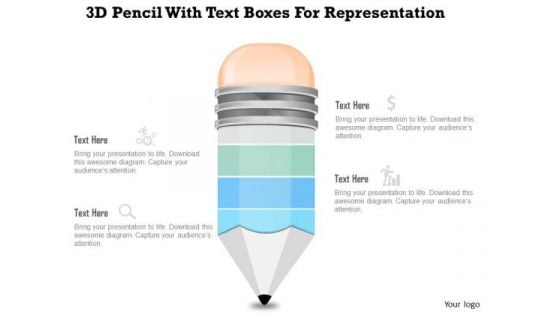
Business Diagram 3d Pencil With Text Boxes For Representation PowerPoint Slide
This Power Point diagram displays graphic of pencil with icons and text spaces. It contains diagram of colorful pencil for data display. Use this diagram to build professional presentations for your viewers.
Business Diagram Human Icons With Bubbles And Different Icons Inside PowerPoint Slide
This diagram displays graph with percentage value growth. This business slide is suitable to present and compare business data. Use this diagram to build professional presentations for your viewers.

Business Diagram Three Staged Pencil Diagram For Graph Formation PowerPoint Slide
This business diagram displays set of pencils. This Power Point template has been designed to compare and present business data. Download this diagram to represent stages of business growth.
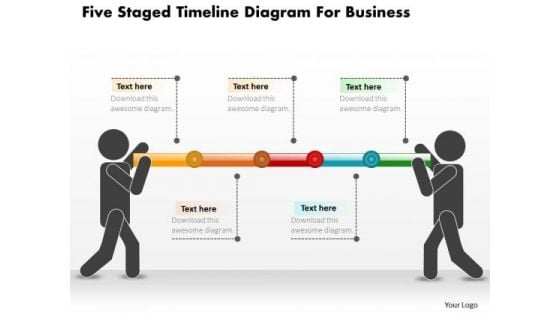
Business Diagram Five Staged Timeline Diagram For Business PowerPoint Slide
This PowerPoint template displays five points timeline diagram. This business diagram has been designed with graphic of timeline with five points, text space and start, end points. Use this diagram, in your presentations to display process steps, stages, timelines and business management. Make wonderful presentations using this business slide.
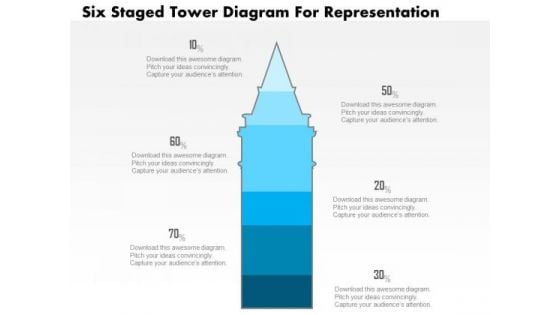
Business Diagram Five Staged Tower Diagram For Representation PowerPoint Slide
This business slide displays five staged tower diagram. It contains blue tower graphic divided into five parts. This diagram slide depicts processes, stages, steps, points, options information display. Use this diagram, in your presentations to express your views innovatively.
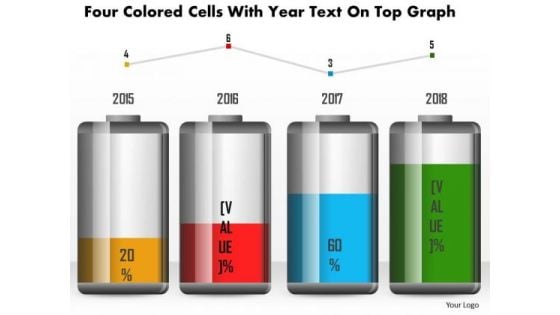
Business Diagram Four Colored Cells With Year Text On Top Graph PowerPoint Slide
This business diagram has been designed with battery cell graphic for business timeline. This slide can be used for business planning and management. Use this diagram for your business and success milestones related presentations.
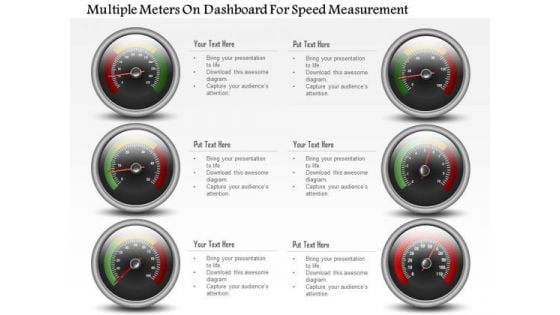
Business Diagram Multiple Meters On Dashboard For Speed Measurement PowerPoint Slide
This business diagram has been designed with multiple meters on dashboard. This slide can be used for business planning and progress. Use this diagram for your business and success milestones related presentations.
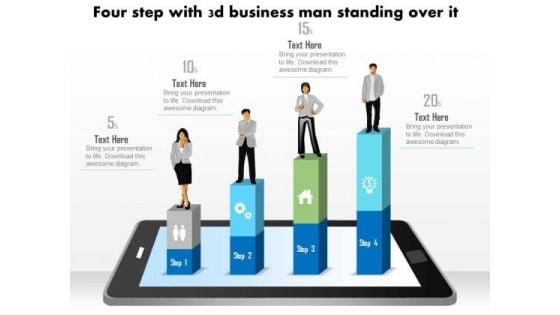
Business Diagram Four Steps With 3d Business Person Standing Over It PowerPoint Slide
This business diagram displays bar graph with business person standing on it. This Power Point template has been designed to display personal growth. You may use this diagram to impart professional appearance to your presentations.
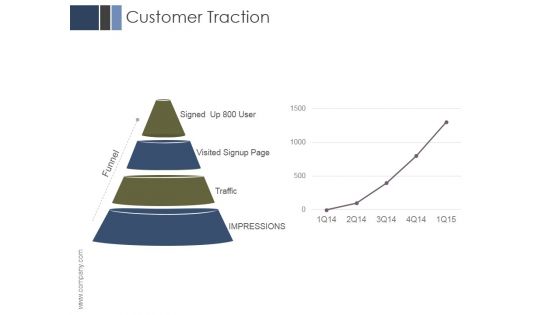
Customer Traction Ppt PowerPoint Presentation Information
This is a customer traction ppt powerpoint presentation information. This is a four stage process. The stages in this process are signed up, visited signup page, traffic, impressions, funnel.
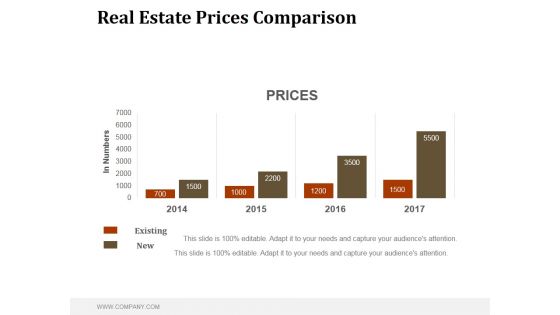
Real Estate Prices Comparison Ppt PowerPoint Presentation Example File
This is a real estate prices comparison ppt powerpoint presentation example file. This is a four stage process. The stages in this process are business, marketing, management, comparison, prices.
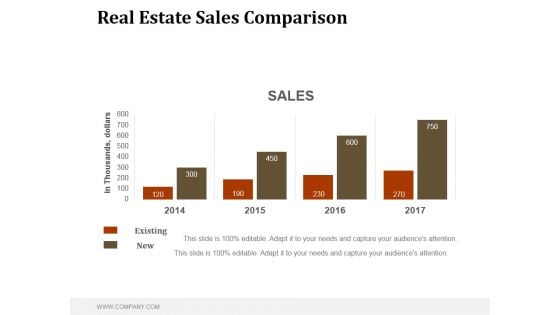
Real Estate Sales Comparison Ppt PowerPoint Presentation Good
This is a real estate sales comparison ppt powerpoint presentation good. This is a four stage process. The stages in this process are business, marketing, management, sales, comparison.
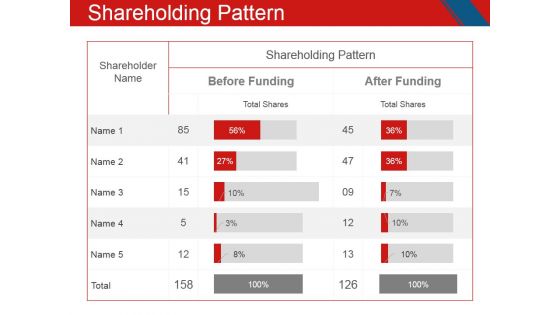
Shareholding Pattern Ppt PowerPoint Presentation Model Microsoft
This is a shareholding pattern ppt powerpoint presentation model microsoft. This is a two stage process. The stages in this process are shareholder name, shareholding pattern, before funding, after funding.
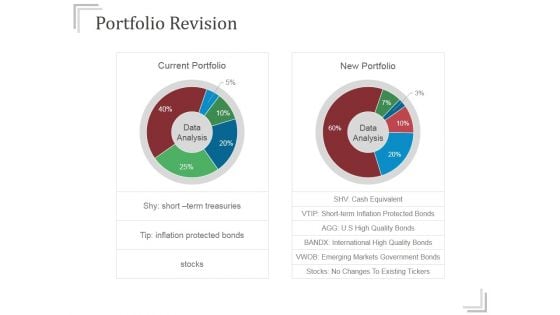
Portfolio Revision Ppt PowerPoint Presentation Slide
This is a portfolio revision ppt powerpoint presentation slide. This is a two stage process. The stages in this process are current portfolio, new portfolio, data analysis.
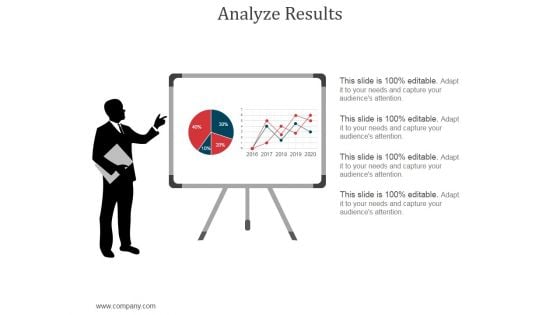
Analyze Results Ppt PowerPoint Presentation Slide
This is a analyze results ppt powerpoint presentation slide. This is a two stage process. The stages in this process are analysis, business, marketing, finance, pie chart.


 Continue with Email

 Home
Home


