Financial Benefits
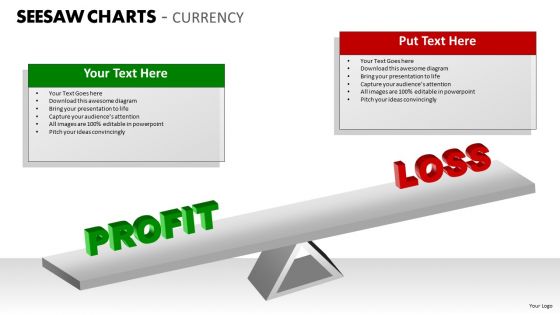
Profit Loss Finance PowerPoint Slides And Ppt Diagram Templates
Profit Loss Finance PowerPoint Slides And PPT Diagram Templates-These high quality, editable pre-designed powerpoint slides have been carefully created by our professional team to help you impress your audience. Each graphic in every slide is vector based and is 100% editable in powerpoint. Each and every property of any slide - color, size, shading etc can be modified to build an effective powerpoint presentation. Use these slides to convey complex business concepts in a simplified manner. Any text can be entered at any point in the powerpoint slide. Simply DOWNLOAD, TYPE and PRESENT! Achievestrong & sustainable performance gains with our Profit Loss Finance PowerPoint Slides And Ppt Diagram Templates. They will make you look good.
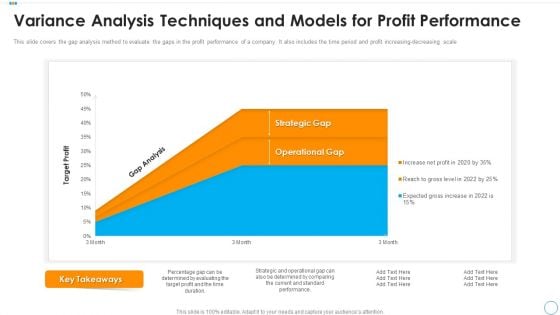
Variance Analysis Techniques And Models For Profit Performance Sample PDF
This slide covers the gap analysis method to evaluate the gaps in the profit performance of a company. It also includes the time period and profit increasing decreasing scale. Showcasing this set of slides titled variance analysis techniques and models for profit performance sample pdf. The topics addressed in these templates are variance analysis techniques and models for profit performance. All the content presented in this PPT design is completely editable. Download it and make adjustments in color, background, font etc. as per your unique business setting.
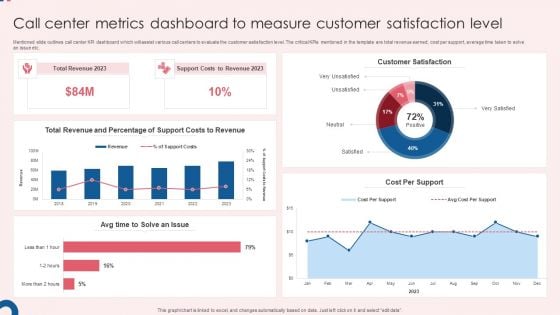
Call Center Metrics Dashboard To Measure Customer Satisfaction Level Slides PDF
Mentioned slide outlines call center KPI dashboard which will assist various call centers to evaluate the customer satisfaction level. The critical KPIs mentioned in the template are total revenue earned, cost per support, average time taken to solve an issue etc. Showcasing this set of slides titled Call Center Metrics Dashboard To Measure Customer Satisfaction Level Slides PDF. The topics addressed in these templates are Total Revenue, Support Costs, Customer Satisfaction. All the content presented in this PPT design is completely editable. Download it and make adjustments in color, background, font etc. as per your unique business setting.
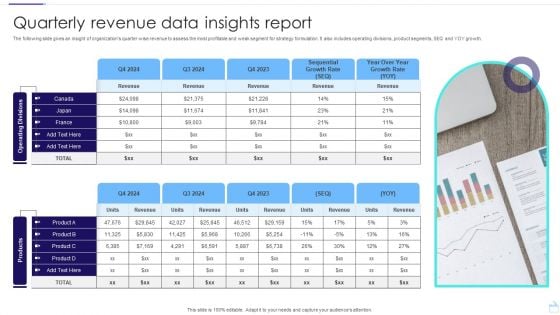
Quarterly Revenue Data Insights Report Template PDF
The following slide gives an insight of organizations quarter wise revenue to assess the most profitable and weak segment for strategy formulation. It also includes operating divisions, product segments, SEQ and YOY growth. Showcasing this set of slides titled Quarterly Revenue Data Insights Report Template PDF. The topics addressed in these templates are Operating, Divisions products, Insights Report. All the content presented in this PPT design is completely editable. Download it and make adjustments in color, background, font etc. as per your unique business setting.
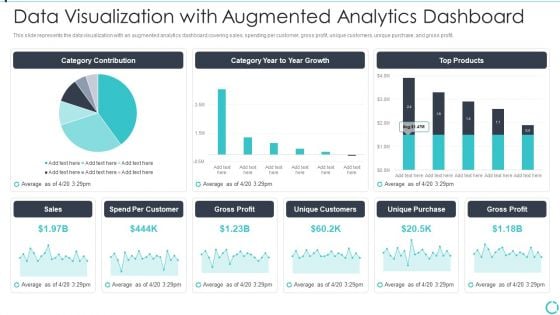
Augmented Analytics Implementation IT Data Visualization With Augmented Analytics Microsoft PDF
This slide represents the data visualization with an augmented analytics dashboard covering sales, spending per customer, gross profit, unique customers, unique purchase, and gross profit. Deliver an awe inspiring pitch with this creative Augmented Analytics Implementation IT Data Visualization With Augmented Analytics Microsoft PDF bundle. Topics like Category Contribution, Category Year To Year Growth, Top Products, Sales, Gross Profit can be discussed with this completely editable template. It is available for immediate download depending on the needs and requirements of the user.
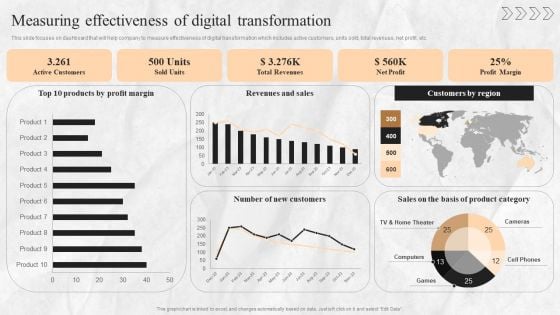
Digital Transition Plan For Managing Business Measuring Effectiveness Of Digital Transformation Portrait PDF
This slide focuses on dashboard that will help company to measure effectiveness of digital transformation which includes active customers, units sold, total revenues, net profit, etc. Formulating a presentation can take up a lot of effort and time, so the content and message should always be the primary focus. The visuals of the PowerPoint can enhance the presenters message, so our Digital Transition Plan For Managing Business Measuring Effectiveness Of Digital Transformation Portrait PDF was created to help save time. Instead of worrying about the design, the presenter can concentrate on the message while our designers work on creating the ideal templates for whatever situation is needed. Slidegeeks has experts for everything from amazing designs to valuable content, we have put everything into Digital Transition Plan For Managing Business Measuring Effectiveness Of Digital Transformation Portrait PDF
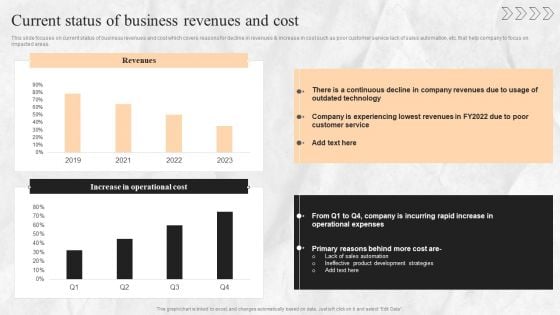
Digital Transition Plan For Managing Business Current Status Of Business Revenues And Cost Sample PDF
This slide focuses on current status of business revenues and cost which covers reasons for decline in revenues and increase in cost such as poor customer service lack of sales automation, etc. that help company to focus on impacted areas. If you are looking for a format to display your unique thoughts, then the professionally designed Digital Transition Plan For Managing Business Current Status Of Business Revenues And Cost Sample PDF is the one for you. You can use it as a Google Slides template or a PowerPoint template. Incorporate impressive visuals, symbols, images, and other charts. Modify or reorganize the text boxes as you desire. Experiment with shade schemes and font pairings. Alter, share or cooperate with other people on your work. Download Digital Transition Plan For Managing Business Current Status Of Business Revenues And Cost Sample PDF and find out how to give a successful presentation. Present a perfect display to your team and make your presentation unforgettable.
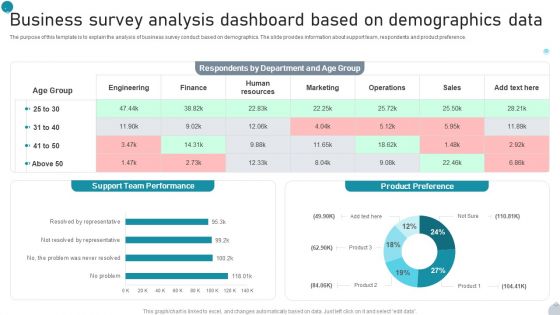
Business Survey Analysis Dashboard Based On Demographics Data Microsoft PDF
The purpose of this template is to explain the analysis of business survey conduct based on demographics. The slide provides information about support team, respondents and product preference. Pitch your topic with ease and precision using this Business Survey Analysis Dashboard Based On Demographics Data Microsoft PDF. This layout presents information on Support, Team Performance, Product Preference It is also available for immediate download and adjustment. So, changes can be made in the color, design, graphics or any other component to create a unique layout.
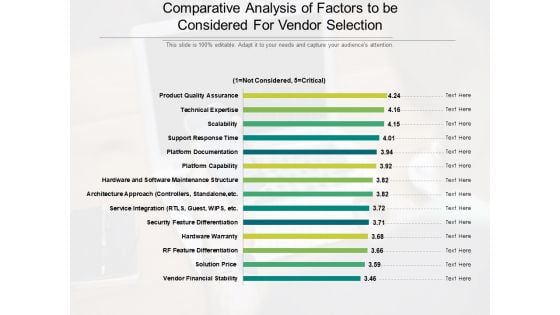
Comparitive Analysis Of Factors To Be Considered For Vendor Selection Ppt PowerPoint Presentation Portfolio Grid PDF
Presenting this set of slides with name comparitive analysis of factors to be considered for vendor selection ppt powerpoint presentation portfolio grid pdf. The topics discussed in these slides are product quality assurance, technical expertise, scalability, support response timen. This is a completely editable PowerPoint presentation and is available for immediate download. Download now and impress your audience.
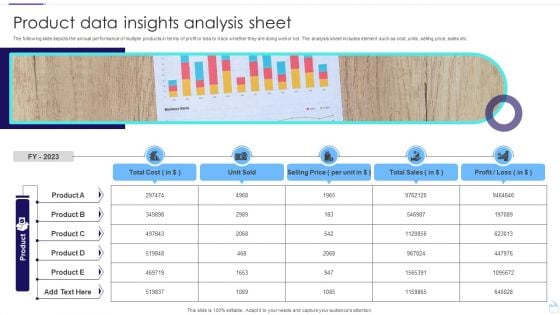
Product Data Insights Analysis Sheet Infographics PDF
The following slide depicts the annual performance of multiple products in terms of profit or loss to track whether they are doing well or not. The analysis sheet includes element such as cost, units, selling price, sales etc. Pitch your topic with ease and precision using this Product Data Insights Analysis Sheet Infographics PDF. This layout presents information on Unit Sold, Selling Price, Total Sales. It is also available for immediate download and adjustment. So, changes can be made in the color, design, graphics or any other component to create a unique layout.
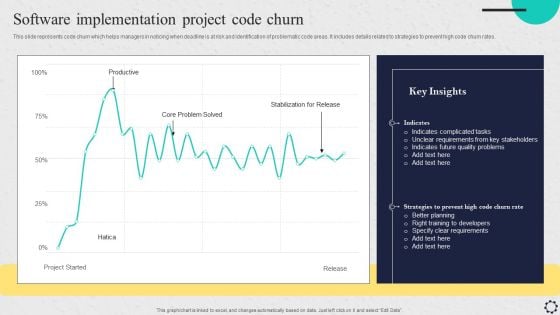
Software Implementation Project Code Churn Introduction PDF
This slide represents code churn which helps managers in noticing when deadline is at risk and identification of problematic code areas. It includes details related to strategies to prevent high code churn rates. This Software Implementation Project Code Churn Introduction PDF from Slidegeeks makes it easy to present information on your topic with precision. It provides customization options, so you can make changes to the colors, design, graphics, or any other component to create a unique layout. It is also available for immediate download, so you can begin using it right away. Slidegeeks has done good research to ensure that you have everything you need to make your presentation stand out. Make a name out there for a brilliant performance.
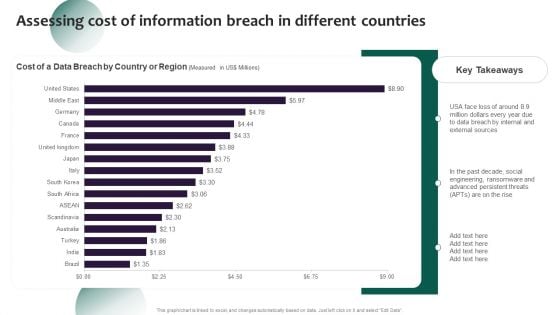
Information Systems Security And Risk Management Plan Assessing Cost Of Information Breach In Different Countries Inspiration PDF
Whether you have daily or monthly meetings, a brilliant presentation is necessary. Information Systems Security And Risk Management Plan Assessing Cost Of Information Breach In Different Countries Inspiration PDF can be your best option for delivering a presentation. Represent everything in detail using Key Takeaways, Countries, Region and make yourself stand out in meetings. The template is versatile and follows a structure that will cater to your requirements. All the templates prepared by Slidegeeks are easy to download and edit. Our research experts have taken care of the corporate themes as well. So, give it a try and see the results.
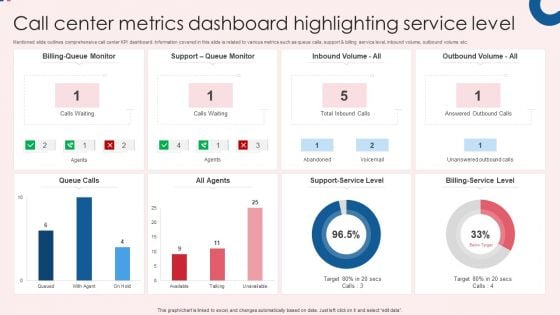
Call Center Metrics Dashboard Highlighting Service Level Infographics PDF
Mentioned slide outlines comprehensive call center KPI dashboard. Information covered in this slide is related to various metrics such as queue calls, support and billing service level, inbound volume, outbound volume etc. Pitch your topic with ease and precision using this Call Center Metrics Dashboard Highlighting Service Level Infographics PDF. This layout presents information on All Agents, Queue Calls, Billing Service Level. It is also available for immediate download and adjustment. So, changes can be made in the color, design, graphics or any other component to create a unique layout.
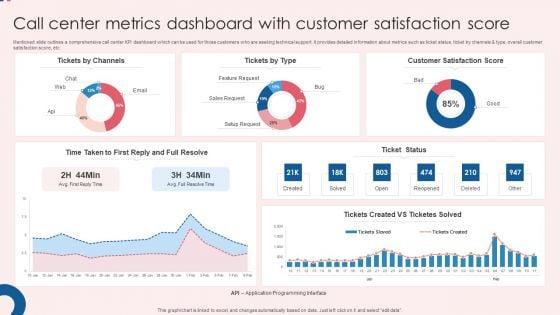
Call Center Metrics Dashboard With Customer Satisfaction Score Ideas PDF
Mentioned slide outlines a comprehensive call center KPI dashboard which can be used for those customers who are seeking technical support. It provides detailed information about metrics such as ticket status, ticket by channels and type, overall customer satisfaction score, etc. Showcasing this set of slides titled Call Center Metrics Dashboard With Customer Satisfaction Score Ideas PDF. The topics addressed in these templates are Customer Satisfaction, Score Ticket Status, Satisfaction Score. All the content presented in this PPT design is completely editable. Download it and make adjustments in color, background, font etc. as per your unique business setting.
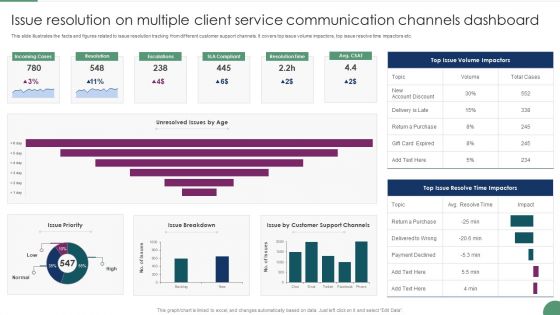
Issue Resolution On Multiple Client Service Communication Channels Dashboard Microsoft PDF
This slide illustrates the facts and figures related to issue resolution tracking from different customer support channels. It covers top issue volume impactors, top issue resolve time impactors etc. Pitch your topic with ease and precision using this Issue Resolution On Multiple Client Service Communication Channels Dashboard Microsoft PDF This layout presents information on Incoming Cases, Resolution, Escalations. It is also available for immediate download and adjustment. So, changes can be made in the color, design, graphics or any other component to create a unique layout.
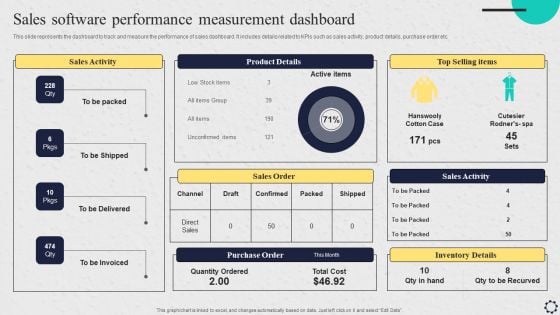
Software Implementation Strategy Sales Software Performance Measurement Dashboard Template PDF
This slide represents the dashboard to track and measure the performance of sales dashboard. It includes details related to KPIs such as sales activity, product details, purchase order etc. Coming up with a presentation necessitates that the majority of the effort goes into the content and the message you intend to convey. The visuals of a PowerPoint presentation can only be effective if it supplements and supports the story that is being told. Keeping this in mind our experts created Software Implementation Strategy Sales Software Performance Measurement Dashboard Template PDF to reduce the time that goes into designing the presentation. This way, you can concentrate on the message while our designers take care of providing you with the right template for the situation.
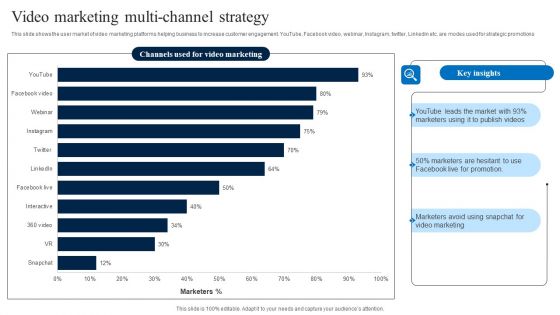
Video Marketing Multi Channel Strategy Download PDF
This slide shows the user market of video marketing platforms helping business to increase customer engagement. YouTube, Facebook video, webinar, Instagram, twitter, Linkedin etc. are modes used for strategic promotions Showcasing this set of slides titled Video Marketing Multi Channel Strategy Download PDF. The topics addressed in these templates are Marketing, Key Insights, Strategy. All the content presented in this PPT design is completely editable. Download it and make adjustments in color, background, font etc. as per your unique business setting.
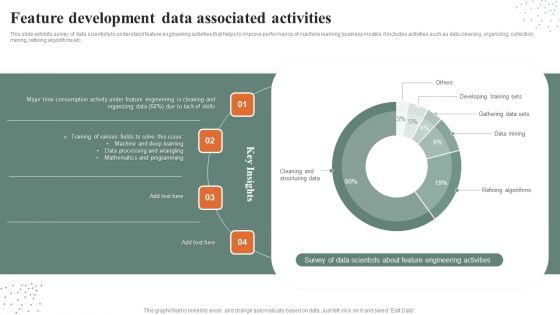
Feature Development Data Associated Activities Guidelines PDF
This slide exhibits survey of data scientists to understand feature engineering activities that helps to improve performance of machine learning business models. It includes activities such as data cleaning, organizing, collection, mining, refining algorithms etc. Pitch your topic with ease and precision using this Feature Development Data Associated Activities Guidelines PDF. This layout presents information on Programming, Developing Training Sets, Gathering Data Sets. It is also available for immediate download and adjustment. So, changes can be made in the color, design, graphics or any other component to create a unique layout.
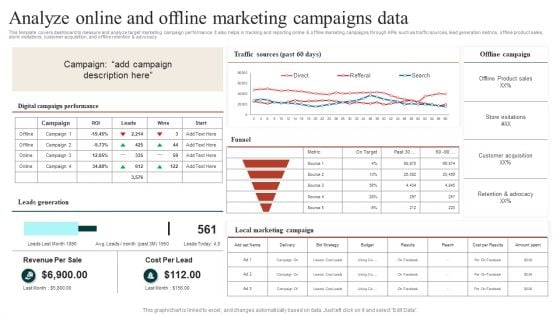
Target Marketing Techniques Analyze Online And Offline Marketing Campaigns Data Ideas PDF
This template covers dashboard to measure and analyze target marketing campaign performance. It also helps in tracking and reporting online and offline marketing campaigns through KPIs such as traffic sources, lead generation metrics, offline product sales, store visitations, customer acquisition, and offline retention and advocacy Find a pre designed and impeccable Target Marketing Techniques Evaluating Growth Rate For Target Marketing Slides PDF. The templates can ace your presentation without additional effort. You can download these easy to edit presentation templates to make your presentation stand out from others. So, what are you waiting for Download the template from Slidegeeks today and give a unique touch to your presentation.
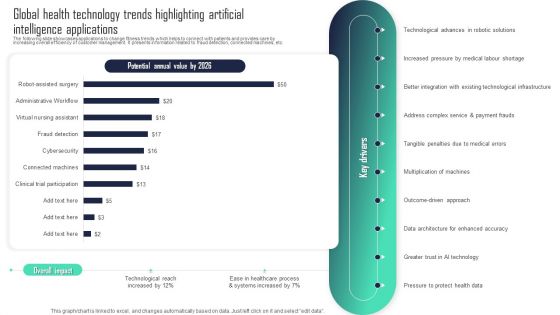
Global Health Technology Trends Highlighting Artificial Intelligence Applications Formats PDF
The following slide showcases applications to change fitness trends which helps to connect with patients and provides care by increasing overall efficiency of customer management. It presents information related to fraud detection, connected machines, etc. Pitch your topic with ease and precision using this Global Health Technology Trends Highlighting Artificial Intelligence Applications Formats PDF. This layout presents information on Key Drivers, Solutions, Enhanced Accuracy. It is also available for immediate download and adjustment. So, changes can be made in the color, design, graphics or any other component to create a unique layout.
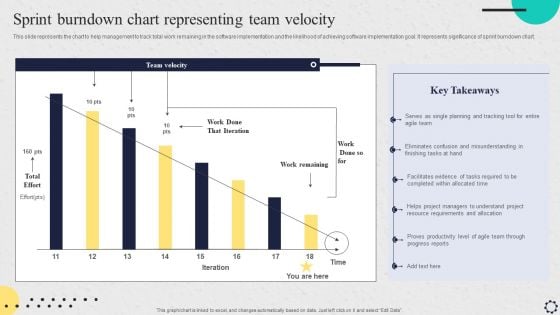
Software Implementation Strategy Sprint Burndown Chart Representing Team Velocity Brochure PDF
This slide represents the chart to help management to track total work remaining in the software implementation and the likelihood of achieving software implementation goal. It represents significance of sprint burndown chart. If your project calls for a presentation, then Slidegeeks is your go to partner because we have professionally designed, easy to edit templates that are perfect for any presentation. After downloading, you can easily edit Software Implementation Strategy Sprint Burndown Chart Representing Team Velocity Brochure PDF and make the changes accordingly. You can rearrange slides or fill them with different images. Check out all the handy templates.
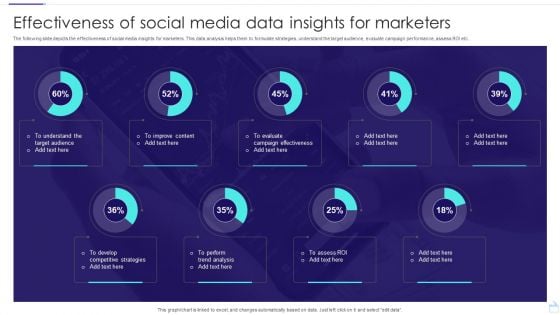
Effectiveness Of Social Media Data Insights For Marketers Ideas PDF
The following slide depicts the effectiveness of social media insights for marketers. This data analysis helps them to formulate strategies, understand the target audience, evaluate campaign performance, assess ROI etc. Showcasing this set of slides titled Effectiveness Of Social Media Data Insights For Marketers Ideas PDF. The topics addressed in these templates are Effectiveness, Social Media, Marketers. All the content presented in this PPT design is completely editable. Download it and make adjustments in color, background, font etc. as per your unique business setting.
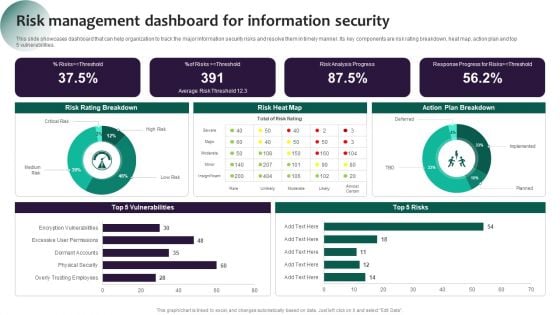
Information Systems Security And Risk Management Plan Risk Management Dashboard For Information Security Pictures PDF
This slide showcases dashboard that can help organization to track the major information security risks and resolve them in timely manner. Its key components are risk rating breakdown, heat map, action plan and top 5 vulnerabilities. The best PPT templates are a great way to save time, energy, and resources. Slidegeeks have 100 percent editable powerpoint slides making them incredibly versatile. With these quality presentation templates, you can create a captivating and memorable presentation by combining visually appealing slides and effectively communicating your message. Download Information Systems Security And Risk Management Plan Risk Management Dashboard For Information Security Pictures PDF from Slidegeeks and deliver a wonderful presentation.
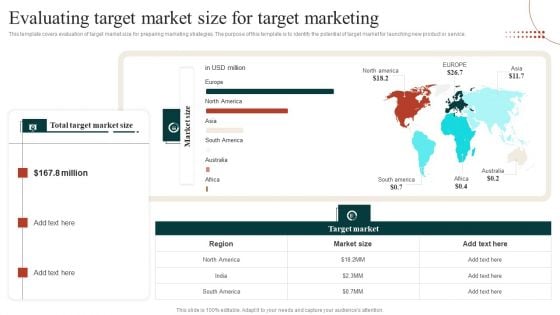
Target Marketing Techniques Evaluating Target Market Size For Target Marketing Mockup PDF
This template covers evaluation of target market size for preparing marketing strategies. The purpose of this template is to identify the potential of target market for launching new product or service. Create an editable Target Marketing Techniques Evaluating Target Market Size For Target Marketing Mockup PDF that communicates your idea and engages your audience. Whether you are presenting a business or an educational presentation, pre designed presentation templates help save time. Target Marketing Techniques Evaluating Target Market Size For Target Marketing Mockup PDF is highly customizable and very easy to edit, covering many different styles from creative to business presentations. Slidegeeks has creative team members who have crafted amazing templates. So, go and get them without any delay.
Analysis Plan For E Commerce Promotion Tactics Content Performance Tracking Dashboard For Social Media Channels Icons PDF
This slide indicates the content performance tracking dashboard for social media channels providing information regarding the total number of posts, engagement rate, audience sentiments and multiple hashtags performance. Formulating a presentation can take up a lot of effort and time, so the content and message should always be the primary focus. The visuals of the PowerPoint can enhance the presenters message, so our Analysis Plan For E Commerce Promotion Tactics Content Performance Tracking Dashboard For Social Media Channels Icons PDF was created to help save time. Instead of worrying about the design, the presenter can concentrate on the message while our designers work on creating the ideal templates for whatever situation is needed. Slidegeeks has experts for everything from amazing designs to valuable content, we have put everything into Analysis Plan For E Commerce Promotion Tactics Content Performance Tracking Dashboard For Social Media Channels Icons PDF
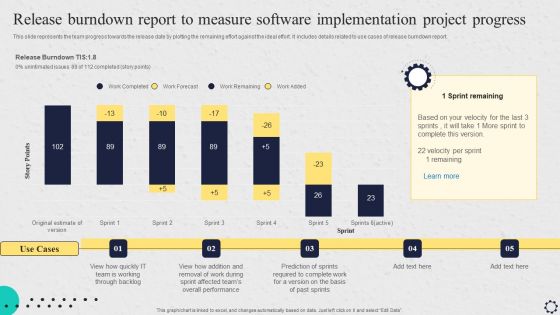
Software Implementation Strategy Release Burndown Report To Measure Software Implementation Project Progress Introduction PDF
This slide represents the team progress towards the release date by plotting the remaining effort against the ideal effort. It includes details related to use cases of release burndown report. Formulating a presentation can take up a lot of effort and time, so the content and message should always be the primary focus. The visuals of the PowerPoint can enhance the presenters message, so our Software Implementation Strategy Release Burndown Report To Measure Software Implementation Project Progress Introduction PDF was created to help save time. Instead of worrying about the design, the presenter can concentrate on the message while our designers work on creating the ideal templates for whatever situation is needed. Slidegeeks has experts for everything from amazing designs to valuable content, we have put everything into Software Implementation Strategy Release Burndown Report To Measure Software Implementation Project Progress Introduction PDF
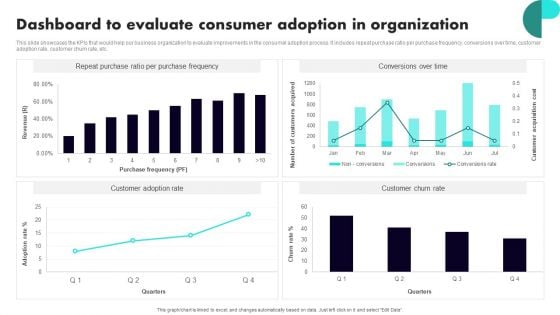
Implementing Client Onboarding Process Dashboard To Evaluate Consumer Adoption In Organization Diagrams PDF
This slide showcases the KPIs that would help our business organization to evaluate improvements in the consumer adoption process. It includes repeat purchase ratio per purchase frequency, conversions over time, customer adoption rate, customer churn rate, etc. Do you have an important presentation coming up Are you looking for something that will make your presentation stand out from the rest Look no further than Implementing Client Onboarding Process Dashboard To Evaluate Consumer Adoption In Organization Diagrams PDF. With our professional designs, you can trust that your presentation will pop and make delivering it a smooth process. And with Slidegeeks, you can trust that your presentation will be unique and memorable. So why wait Grab Implementing Client Onboarding Process Dashboard To Evaluate Consumer Adoption In Organization Diagrams PDF today and make your presentation stand out from the rest.
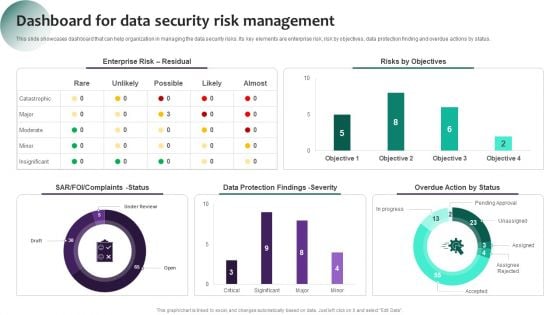
Information Systems Security And Risk Management Plan Dashboard For Data Security Risk Management Information PDF
This slide showcases dashboard that can help organization in managing the data security risks. Its key elements are enterprise risk, risk by objectives, data protection finding and overdue actions by status. If you are looking for a format to display your unique thoughts, then the professionally designed Information Systems Security And Risk Management Plan Dashboard For Data Security Risk Management Information PDF is the one for you. You can use it as a Google Slides template or a PowerPoint template. Incorporate impressive visuals, symbols, images, and other charts. Modify or reorganize the text boxes as you desire. Experiment with shade schemes and font pairings. Alter, share or cooperate with other people on your work. Download Information Systems Security And Risk Management Plan Dashboard For Data Security Risk Management Information PDF and find out how to give a successful presentation. Present a perfect display to your team and make your presentation unforgettable.

Exit Plan For Trucking Business Importance Of Exit Options For Stakeholders Structure PDF
This slide represents importance of exit options for the trucking firm. It enables entrepreneurs and business owners to understand the benefits and implications of exit planning, such as financial planning, risk mitigation, investor confidence, strategic decision-making, and smooth transitions, which ultimately leads to long-term business success and maximizes returns on investment. Create an editable Exit Plan For Trucking Business Importance Of Exit Options For Stakeholders Structure PDF that communicates your idea and engages your audience. Whether you are presenting a business or an educational presentation, pre designed presentation templates help save time. Exit Plan For Trucking Business Importance Of Exit Options For Stakeholders Structure PDF is highly customizable and very easy to edit, covering many different styles from creative to business presentations. Slidegeeks has creative team members who have crafted amazing templates. So, go and get them without any delay.
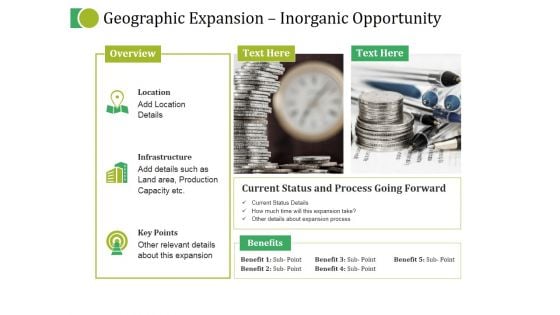
Geographic Expansion Inorganic Opportunity Ppt PowerPoint Presentation Summary
This is a geographic expansion inorganic opportunity ppt powerpoint presentation summary. This is a three stage process. The stages in this process are overview, benefits, current status and process going forward, location, infrastructure.
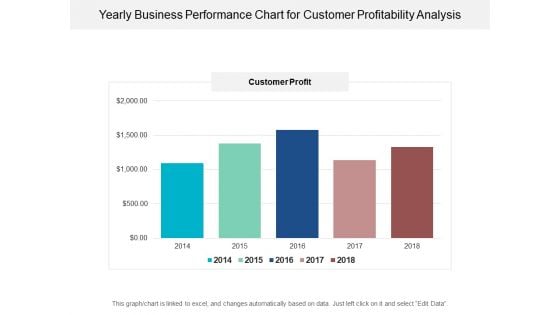
Yearly Business Performance Chart For Customer Profitability Analysis Ppt PowerPoint Presentation Ideas Picture
This is a yearly business performance chart for customer profitability analysis ppt powerpoint presentation ideas picture. This is a five stage process. The stages in this process are financial analysis, quantitative, statistical modelling.
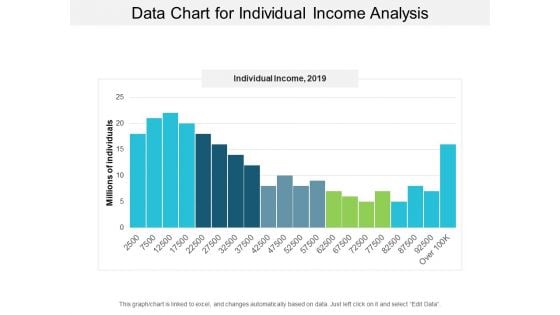
Data Chart For Individual Income Analysis Ppt PowerPoint Presentation Layouts Visual Aids
This is a data chart for individual income analysis ppt powerpoint presentation layouts visual aids. This is a five stage process. The stages in this process are financial analysis, quantitative, statistical modelling.
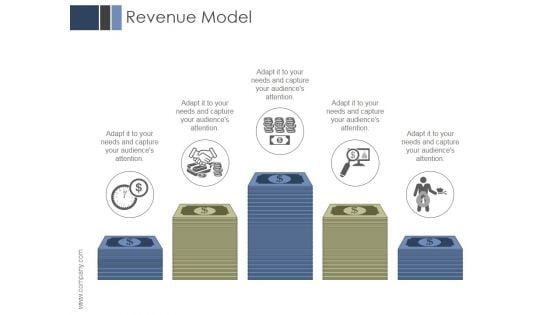
Revenue Model Ppt PowerPoint Presentation Visual Aids
This is a revenue model ppt powerpoint presentation visual aids. This is a five stage process. The stages in this process are business, marketing, management, finance, planning.
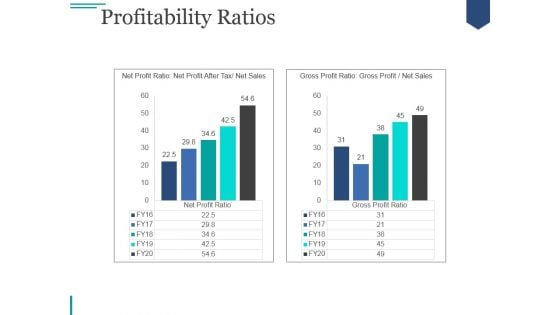
Profitability Ratios Ppt PowerPoint Presentation Infographic Template
This is a profitability ratios ppt powerpoint presentation infographic template. This is a two stage process. The stages in this process are graph, business, marketing, strategy, growth.
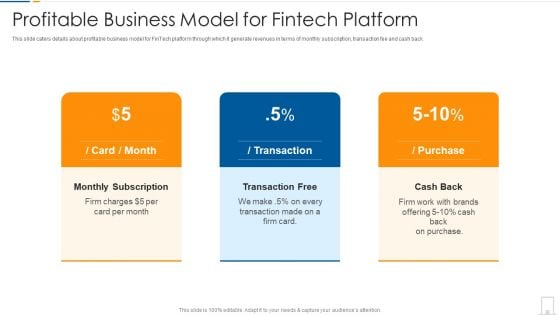
Profitable Business Model For Fintech Platform Ppt Professional Skills PDF
This slide caters details about profitable business model for FinTech platform through which it generate revenues in terms of monthly subscription, transaction fee and cash back. This is a profitable business model for fintech platform ppt professional skills pdf template with various stages. Focus and dispense information on three stages using this creative set, that comes with editable features. It contains large content boxes to add your information on topics like profitable business model for fintech platform. You can also showcase facts, figures, and other relevant content using this PPT layout. Grab it now.
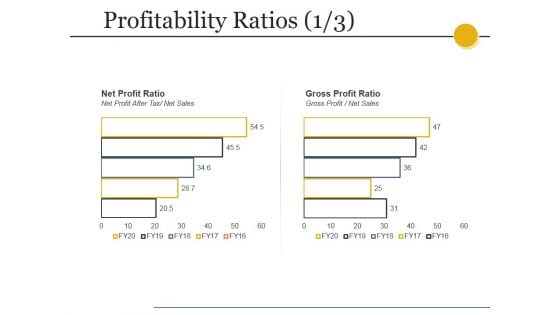
Profitability Ratios Template Ppt PowerPoint Presentation Styles Slide
This is a profitability ratios template ppt powerpoint presentation styles slide. This is a two stage process. The stages in this process are net profit ratio, net profit after tax net sales, gross profit ratio, gross profit net sales.
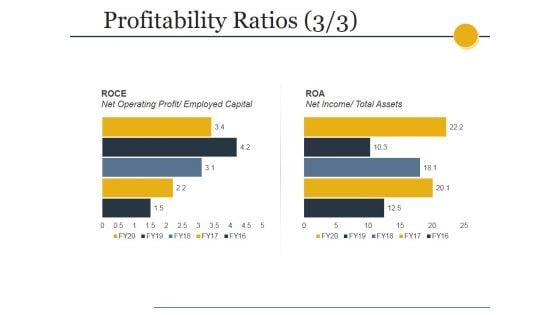
Profitability Ratios Template 3 Ppt PowerPoint Presentation Show Graphics Download
This is a profitability ratios template 3 ppt powerpoint presentation show graphics download. This is a two stage process. The stages in this process are roce, net operating profit, employed capital, roa, net income, total assets.

Budgeting Planned Actual Comparison Ppt PowerPoint Presentation Visual Aids Outline
This is a budgeting planned actual comparison ppt powerpoint presentation visual aids outline. This is a three stage process. The stages in this process are planned cost, actual cost, value difference.
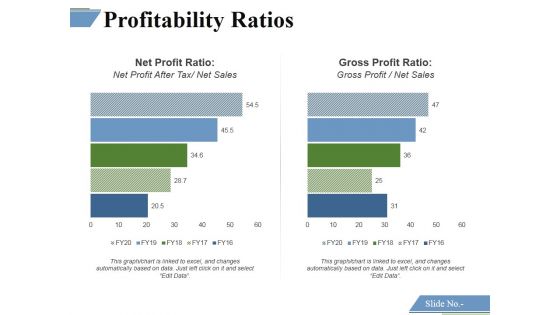
Profitability Ratios Template 1 Ppt PowerPoint Presentation Outline Deck
This is a profitability ratios template 1 ppt powerpoint presentation outline deck. This is a two stage process. The stages in this process are net profit ratio, gross profit ratio.
Profitability Ratios Template 2 Ppt PowerPoint Presentation Icon Diagrams
This is a profitability ratios template 2 ppt powerpoint presentation icon diagrams. This is a two stage process. The stages in this process are net profit ratio, gross profit ratio.
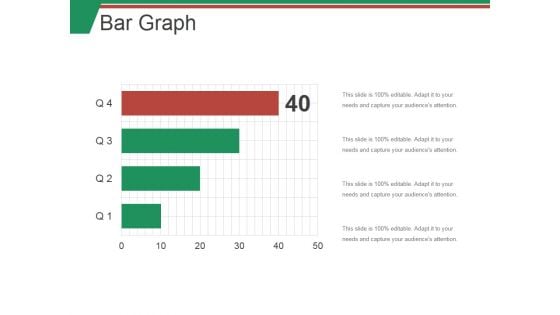
Bar Graph Ppt PowerPoint Presentation Outline Aids
This is a bar graph ppt powerpoint presentation outline aids. This is a four stage process. The stages in this process are bar, graph, finance, marketing, strategy.
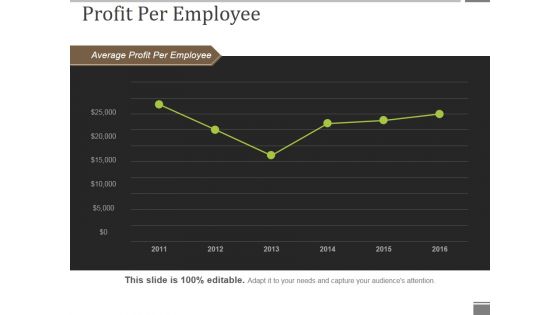
Profit Per Employee Ppt PowerPoint Presentation Show Portfolio
This is a profit per employee ppt powerpoint presentation show portfolio. This is a six stage process. The stages in this process are average profit per employee, line chart, business, marketing, success.
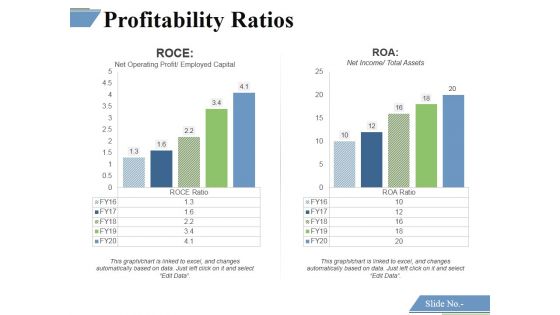
Profitability Ratios Template 6 Ppt PowerPoint Presentation Portfolio Graphics
This is a profitability ratios template 6 ppt powerpoint presentation portfolio graphics. This is a two stage process. The stages in this process are roce, roa.
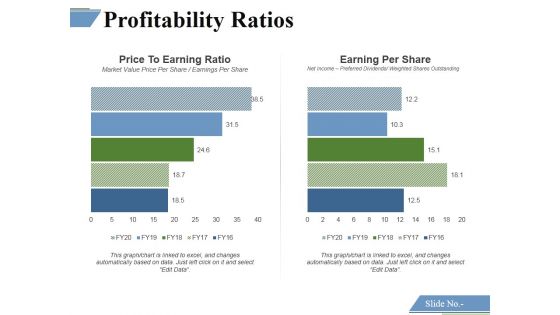
Profitability Ratios Template 3 Ppt PowerPoint Presentation Summary Files
This is a profitability ratios template 3 ppt powerpoint presentation summary files. This is a two stage process. The stages in this process are price to earning ratio, earning per share.

Profitability Ratios Template 4 Ppt PowerPoint Presentation Ideas Graphic Images
This is a profitability ratios template 4 ppt powerpoint presentation ideas graphic images. This is a two stage process. The stages in this process are price to earning ratio, earning per share.
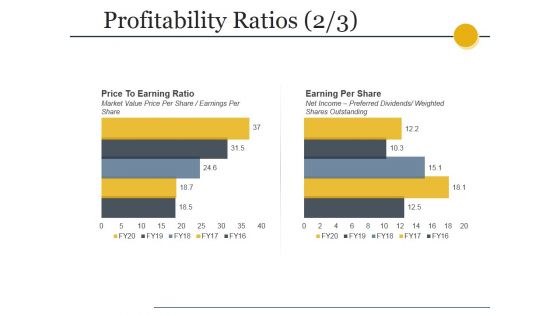
Profitability Ratios Template 2 Ppt PowerPoint Presentation Gallery Designs
This is a profitability ratios template 2 ppt powerpoint presentation gallery designs. This is a two stage process. The stages in this process are price to earning ratio, market value price per share earnings per share, earning per share, net income preferred dividends, weighted shares outstanding.
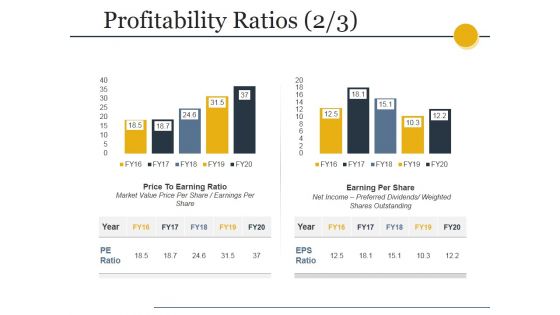
Profitability Ratios Template 4 Ppt PowerPoint Presentation Professional Deck
This is a profitability ratios template 4 ppt powerpoint presentation professional deck. This is a two stage process. The stages in this process are price to earning ratio, market value price per share earnings per share, earning per share, net income preferred dividends, weighted shares outstanding.

Bar Graph Ppt PowerPoint Presentation Visual Aids Styles
This is a bar graph ppt powerpoint presentation visual aids styles. This is a five stage process. The stages in this process are finance, analysis, planning, business, process.
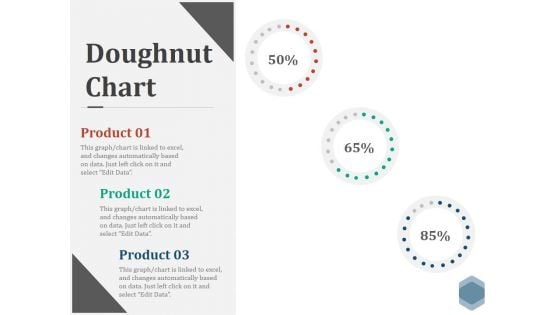
Doughnut Chart Ppt PowerPoint Presentation Visual Aids Files
This is a doughnut chart ppt powerpoint presentation visual aids files. This is a three stage process. The stages in this process are finance, donut, percentage, business, marketing.
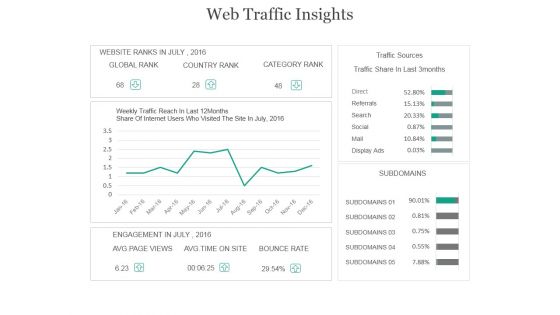
Web Traffic Insights Ppt PowerPoint Presentation Visual Aids
This is a web traffic insights ppt powerpoint presentation visual aids. This is a five stage process. The stages in this process are traffic sources, traffic share in last 3months, weekly traffic reach in last 12months, website ranks, global rank.
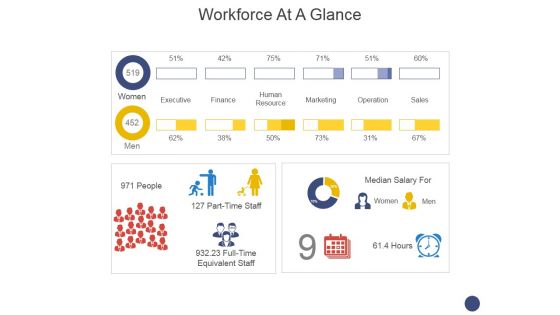
Workforce At A Glance Ppt PowerPoint Presentation Visual Aids Show
This is a workforce at a glance ppt powerpoint presentation visual aids show. This is a two stage process. The stages in this process are executive, finance, human resource, marketing, operation, sales .
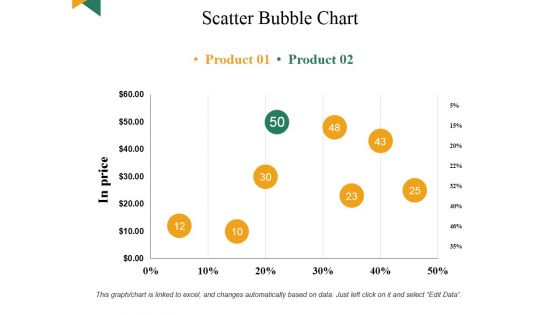
Scatter Bubble Chart Ppt PowerPoint Presentation Summary Visual Aids
This is a scatter bubble chart ppt powerpoint presentation summary visual aids. This is a eight stage process. The stages in this process are business, marketing, finance, analysis, planning.
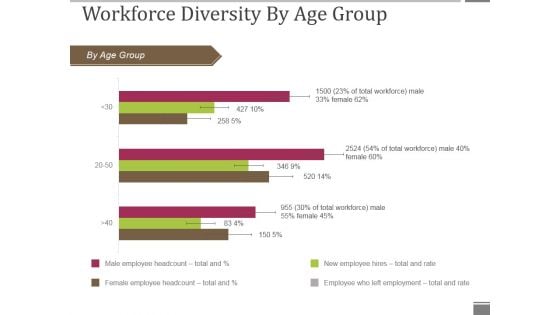
Workforce Diversity By Age Group Ppt PowerPoint Presentation Visual Aids Gallery
This is a workforce diversity by age group ppt powerpoint presentation visual aids gallery. This is a three stage process. The stages in this process are by age group, bar graph, business, marketing, presentation.
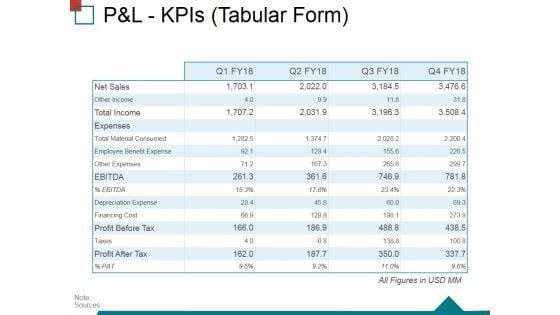
Pandl Kpis Tabular Form Ppt PowerPoint Presentation Ideas Structure
This is a pandl kpis tabular form ppt powerpoint presentation ideas structure. This is a four stage process. The stages in this process are operating profit, revenue, cogs, net profit.
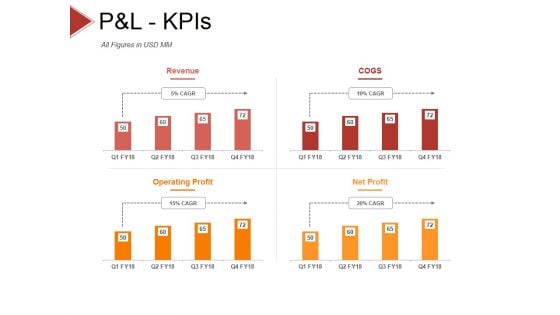
P And L Kpis Template 2 Ppt PowerPoint Presentation Styles Objects
This is a p and l kpis template 2 ppt powerpoint presentation styles objects. This is a four stage process. The stages in this process are revenue, cogs, operating profit, net profit.

P And L Kpis Template 1 Ppt PowerPoint Presentation Model Inspiration
This is a p and l kpis template 1 ppt powerpoint presentation model inspiration. This is a four stage process. The stages in this process are revenue, cogs, operating profit, net profit.
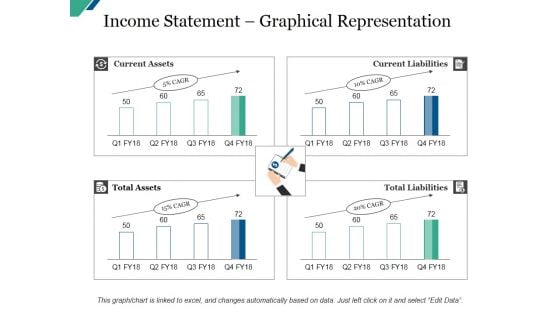
Income Statement Graphical Representation Template Ppt PowerPoint Presentation Model Infographic Template
This is a income statement graphical representation template ppt powerpoint presentation model infographic template. This is a four stage process. The stages in this process are revenue, cogs, operating profit, net profit.
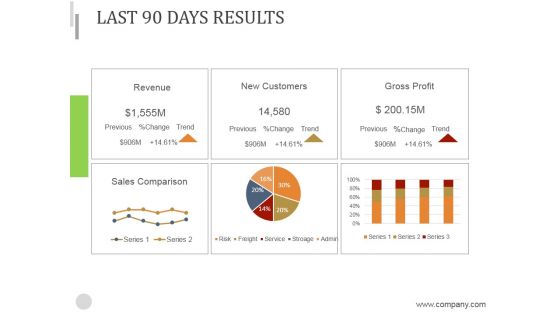
Last 90 Days Results Ppt PowerPoint Presentation Introduction
This is a last 90 days results ppt powerpoint presentation introduction. This is a six stage process. The stages in this process are revenue, new customers, gross profit, sales comparison.
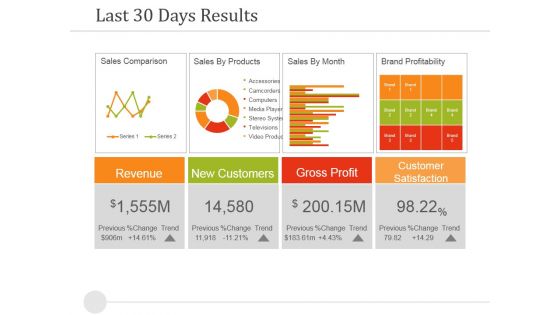
Last 30 Days Results Ppt PowerPoint Presentation Summary Brochure
This is a last 30 days results ppt powerpoint presentation summary brochure. This is a four stage process. The stages in this process are revenue, new customers, gross profit, customer satisfaction.
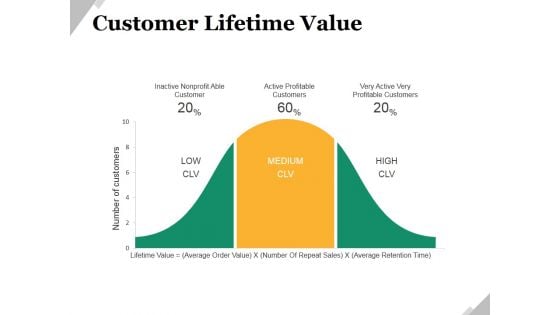
Customer Lifetime Value Ppt PowerPoint Presentation Styles Gridlines
This is a customer lifetime value ppt powerpoint presentation styles gridlines. This is a three stage process. The stages in this process are inactive nonprofit able customer, active profitable customers, very active very profitable customers.


 Continue with Email

 Home
Home


