Financial Benefits
Strategy Diagram Profit And Loss Balance And Cash Flow Statements Mba Models And Frameworks
Be The Doer With Our Strategy Diagram Profit And Loss Balance And Cash Flow Statements MBA Models And Frameworks Powerpoint Templates. Put Your Thoughts Into Practice.
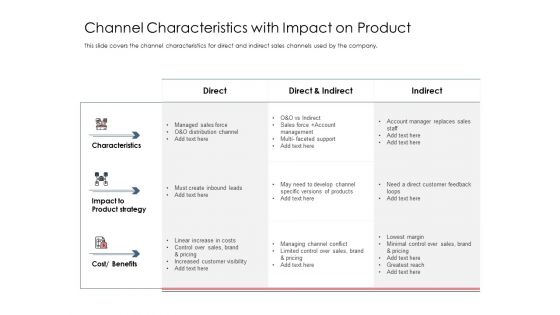
Best Practices Increase Revenue Out Indirect Channel Characteristics With Impact On Product Pictures PDF
Deliver an awe inspiring pitch with this creative best practices increase revenue out indirect channel characteristics with impact on product pictures pdf bundle. Topics like characteristics, product strategy, cost or benefits can be discussed with this completely editable template. It is available for immediate download depending on the needs and requirements of the user.
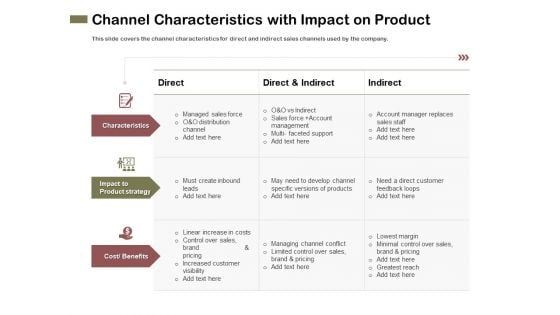
Promotional Channels And Action Plan For Increasing Revenues Channel Characteristics With Impact On Product Formats PDF
Deliver an awe inspiring pitch with this creative promotional channels and action plan for increasing revenues channel characteristics with impact on product formats pdf bundle. Topics like characteristics, product strategy, cost or benefits can be discussed with this completely editable template. It is available for immediate download depending on the needs and requirements of the user.

Unconventional Source Of Real Estate Finance Venture Capital Backed Company Loans Ppt Slides Backgrounds PDF
Deliver an awe inspiring pitch with this creative unconventional source of real estate finance venture capital backed company loans ppt slides backgrounds pdf bundle. Topics like key benefits of venture capital backed, expansion opportunity, personal assets dont need to be pledged can be discussed with this completely editable template. It is available for immediate download depending on the needs and requirements of the user.

Management Team Template 6 Ppt PowerPoint Presentation Show Aids
This is a management team template 6 ppt powerpoint presentation show aids. This is a six stage process. The stages in this process are mary clark, john smith, charly doe, graphic designer, financial advisor.
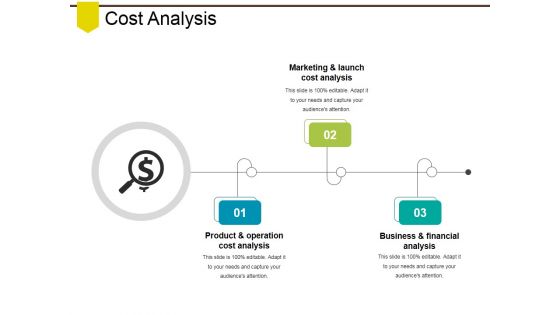
Cost Analysis Ppt PowerPoint Presentation Infographics Visual Aids
This is a cost analysis ppt powerpoint presentation infographics visual aids. This is a three stage process. The stages in this process are product and operation cost analysis, marketing and launch cost analysis, business and financial analysis.
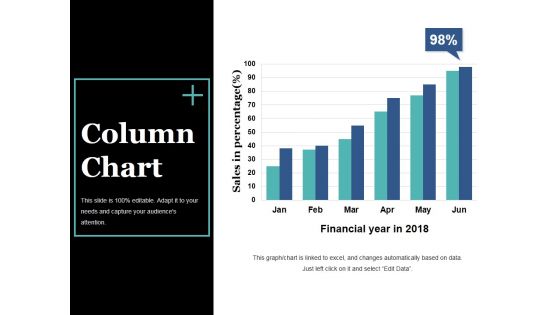
Column Chart Ppt PowerPoint Presentation Slides Visual Aids
This is a column chart ppt powerpoint presentation slides visual aids. This is a six stage process. The stages in this process are bar graph, growth, success, sales in percentage, financial year.

Investment Planning Factors Economy Trade Profit Ppt PowerPoint Presentation Ideas Slide
This is a investment planning factors economy trade profit ppt powerpoint presentation ideas slide. This is a eight stage process. The stages in this process are financial management, wealth management, investment management.
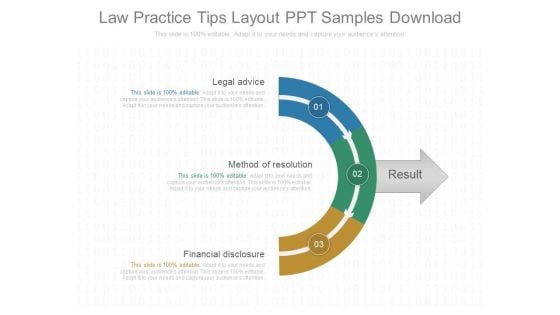
Law Practice Tips Layout Ppt Samples Download
This is a law practice tips layout ppt samples download. This is a three stage process. The stages in this process are legal advice, method of resolution, financial disclosure, result.
Money Ladders Ppt Icon For Ppt Templates And Slides S
Microsoft PowerPoint Template and Background with financial status Your audience will never be left with mixed feelings. Our Money Ladders Ppt Icon For Ppt Templates And Slides S will give them a clear choice.
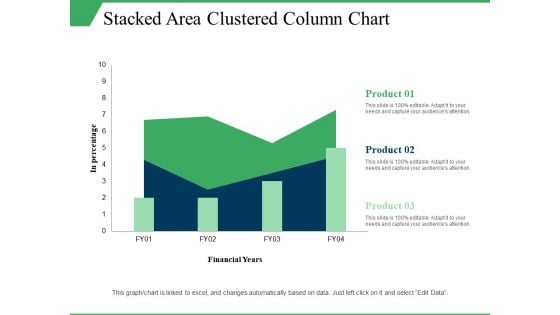
Stacked Area Clustered Column Chart Ppt PowerPoint Presentation Visual Aids Model
This is a stacked area clustered column chart ppt powerpoint presentation visual aids model. This is a three stage process. The stages in this process are in percentage, product, financial years, growth, column chart.

Business Growth02 Success PowerPoint Templates And PowerPoint Backgrounds 0611
Microsoft PowerPoint Template and Background with a depicting financial growth Do not let complacency set in. Our Business Growth02 Success PowerPoint Templates And PowerPoint Backgrounds 0611 will assist you in raising the bar.

Business Necessity Capabilities Powerpoint Slides Rules
This is a business necessity capabilities powerpoint slides rules. This is a six stage process. The stages in this process are greater financial impact, strategic support capabilities, advantage capabilities, greater strategic, essential capabilities, business necessity capabilities.
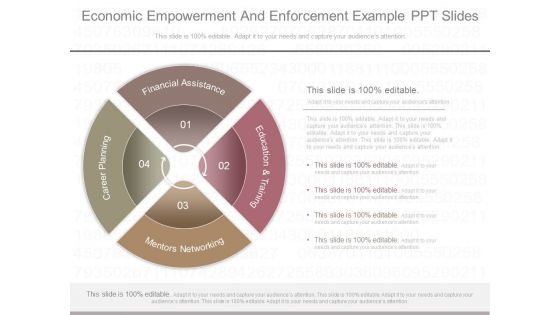
Economic Empowerment And Enforcement Example Ppt Slides
This is a economic empowerment and enforcement example ppt slides. This is a four stage process. The stages in this process are education and training, financial assistance, career planning, mentors networking.
Stock Market Analysis Magnifying Glass Over Bar Graph And Dollar Sign Ppt PowerPoint Presentation Icon Visual Aids
This is a stock market analysis magnifying glass over bar graph and dollar sign ppt powerpoint presentation icon visual aids. This is a four stage process. The stages in this process are stock market, financial markets, bull market.

Business Person With Big Dollar Sign Powerpoint Templates
Adjust the above diagram into your presentations to visually support your content. This slide has been professionally designed with graphics of business man with big dollar sign. This template offers an excellent background to display corporate financial management.
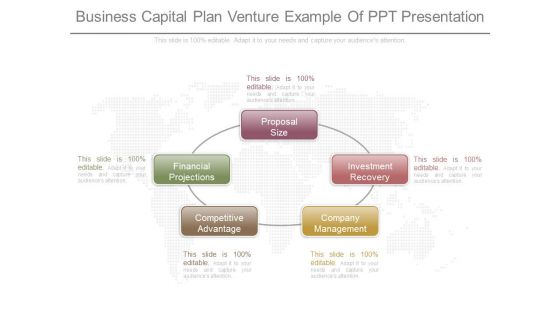
Business Capital Plan Venture Example Of Ppt Presentation
This is a business capital plan venture example of ppt presentation. This is a five stage process. The stages in this process are proposal size, financial projections, competitive advantage, company management, investment recovery.
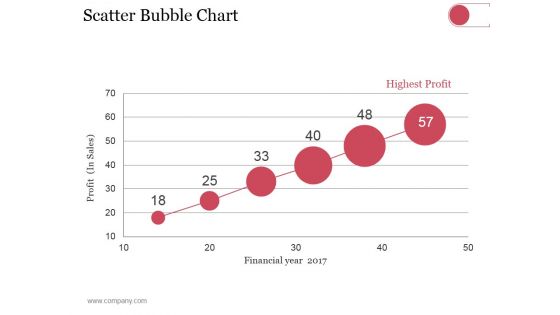
Scatter Bubble Chart Ppt PowerPoint Presentation Summary Pictures
This is a scatter bubble chart ppt powerpoint presentation summary pictures. This is a six stage process. The stages in this process are highest profit, financial year, profit in sales.
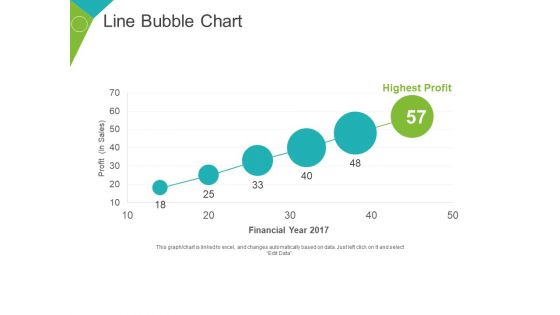
Line Bubble Chart Ppt PowerPoint Presentation Portfolio Slide Portrait
This is a line bubble chart ppt powerpoint presentation portfolio slide portrait. This is a six stage process. The stages in this process are highest profit, financial year, profit in sales, growth, business.

Scatter Bubble Chart Ppt PowerPoint Presentation Professional Graphics Pictures
This is a scatter bubble chart ppt powerpoint presentation professional graphics pictures. This is a one stage process. The stages in this process are profit in sales, financial year, highest profit, product.
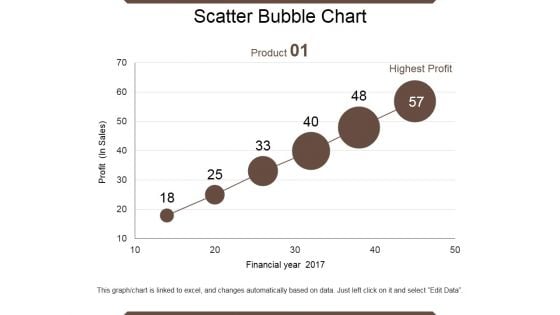
Scatter Bubble Chart Ppt PowerPoint Presentation Summary Files
This is a scatter bubble chart ppt powerpoint presentation summary files. This is a six stage process. The stages in this process are product, financial year, profit, highest profit.
Scatter Bubble Chart Ppt PowerPoint Presentation Icon Elements
This is a scatter bubble chart ppt powerpoint presentation icon elements. This is a six stage process. The stages in this process are highest profit, profit, financial year, product.
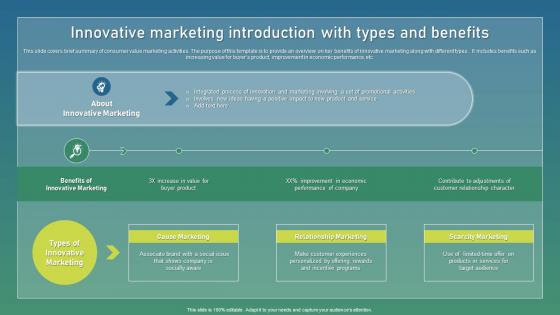
Innovative Marketing Introduction Strategic Guide For Sustainable Themes Pdf
This slide covers brief summary of consumer value marketing activities. The purpose of this template is to provide an overview on key benefits of innovative marketing along with different types . It includes benefits such as increasing value for buyers product, improvement in economic performance, etc. Formulating a presentation can take up a lot of effort and time, so the content and message should always be the primary focus. The visuals of the PowerPoint can enhance the presenters message, so our Innovative Marketing Introduction Strategic Guide For Sustainable Themes Pdf was created to help save time. Instead of worrying about the design, the presenter can concentrate on the message while our designers work on creating the ideal templates for whatever situation is needed. Slidegeeks has experts for everything from amazing designs to valuable content, we have put everything into Innovative Marketing Introduction Strategic Guide For Sustainable Themes Pdf This slide covers brief summary of consumer value marketing activities. The purpose of this template is to provide an overview on key benefits of innovative marketing along with different types . It includes benefits such as increasing value for buyers product, improvement in economic performance, etc.
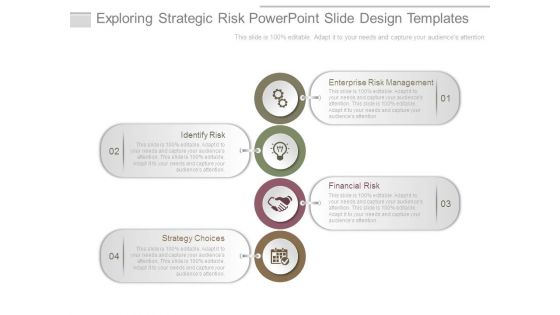
Exploring Strategic Risk Powerpoint Slide Design Templates
This is a exploring strategic risk powerpoint slide design templates. This is a four stage process. The stages in this process are enterprise risk management, identify risk, financial risk, strategy choices.
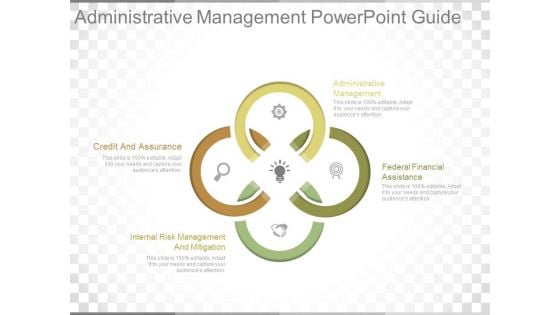
Administrative Management Powerpoint Guide
This is a administrative management powerpoint guide. This is a four stage process. The stages in this process are credit and assurance, internal risk management and mitigation, administrative management, federal financial assistance.
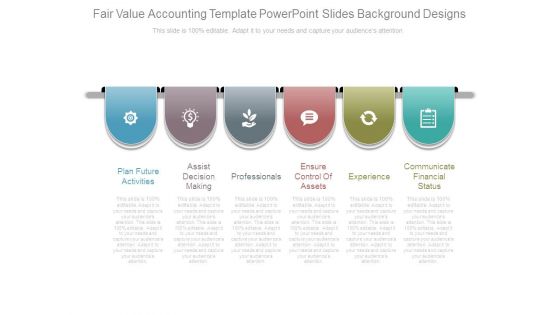
Fair Value Accounting Template Powerpoint Slides Background Designs
This is a fair value accounting template powerpoint slides background designs. This is a six stage process. The stages in this process are plan future activities, assist decision making, professionals, ensure control of assets, experience, communicate financial status.
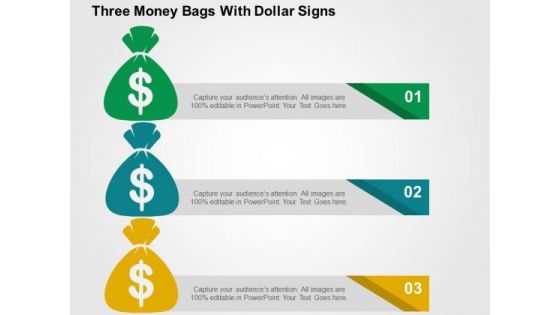
Three Money Bags With Dollar Signs PowerPoint Templates
This unique template displays diagram of three money bags with dollar symbol. This professional slide helps to represent financial planning and execution. This graphic slide is an effective tool to make your clients understand the topic.
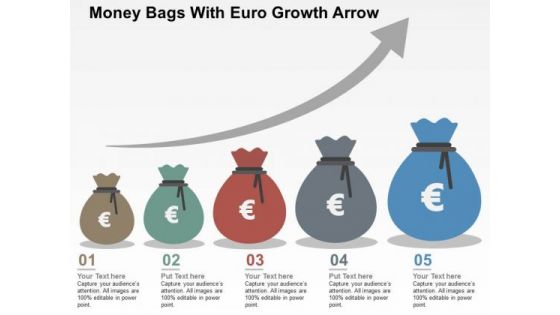
Money Bags With Euro Growth Arrow PowerPoint Templates
The above PPT slide contains graphics of money bag with Euro growth graph. This professionally designed slide may be used to depict financial growth analysis. This slide will help your viewers automatically empathize with your thoughts
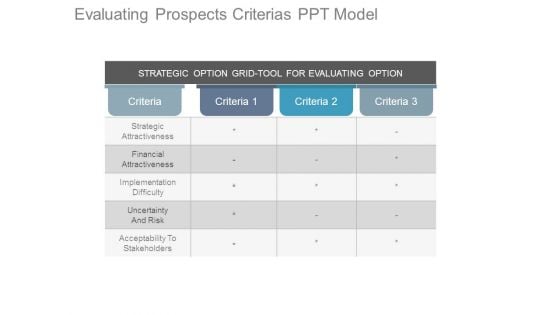
Evaluating Prospects Criterias Ppt Model
This is a evaluating prospects criterias ppt model. This is a three stage process. The stages in this process are strategic option grid tool for evaluating option, criteria, strategic attractiveness, financial attractiveness, implementation difficulty, uncertainty and risk, acceptability to stakeholders.

Evaluating Scores Ppt PowerPoint Presentationpictures Outline
This is a evaluating scores ppt powerpoint presentationpictures outline. This is a seven stage process. The stages in this process are strategic, product advantage, market attractiveness, leverage competencies, financial feasibility, operational feasibility.
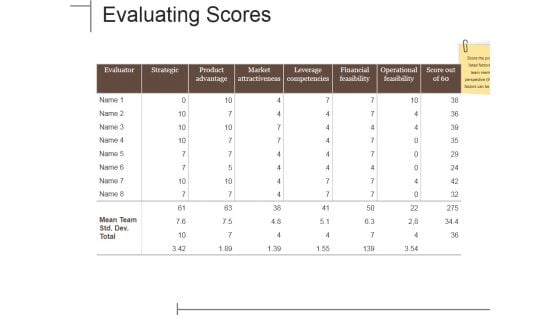
Evaluating Scores Ppt PowerPoint Presentation Infographics Rules
This is a evaluating scores ppt powerpoint presentation infographics rules. This is a seven stage process. The stages in this process are strategic, product advantage, market attractiveness, leverage competencies, financial feasibility, operational feasibility.

Evaluating Scores Ppt PowerPoint Presentation Inspiration Microsoft
This is a evaluating scores ppt powerpoint presentation inspiration microsoft. This is a seven stage process. The stages in this process are strategic, evaluator, product advantage, market attractiveness, financial feasibility, leverage competencies.
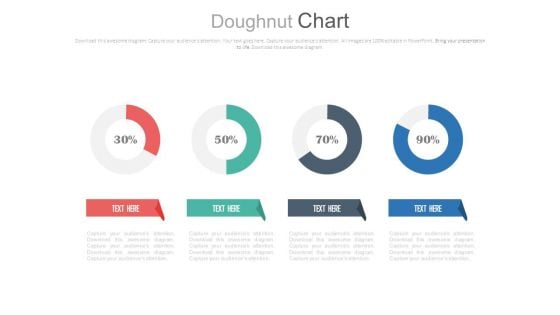
Four Circle Chart With Percentage Ratios Powerpoint Slides
This PowerPoint template has been designed with graphics of four circles and percentage ratios. You may use this dashboard slide design for topics like profit growth and financial planning. This PPT slide is powerful tool to describe your ideas.
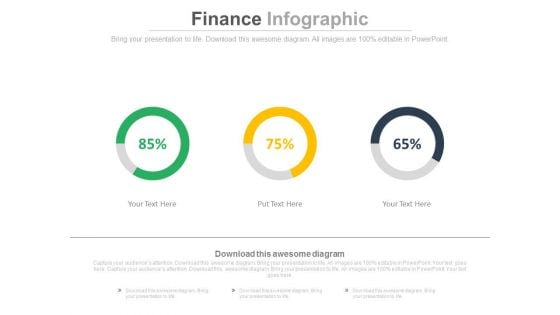
Linear Circles Percentage Analysis Charts Powerpoint Slides
This PowerPoint template has been designed with graphics of three circles and percentage ratios. You may use this dashboard slide design for topics like profit growth and financial planning. This PPT slide is powerful tool to describe your ideas.
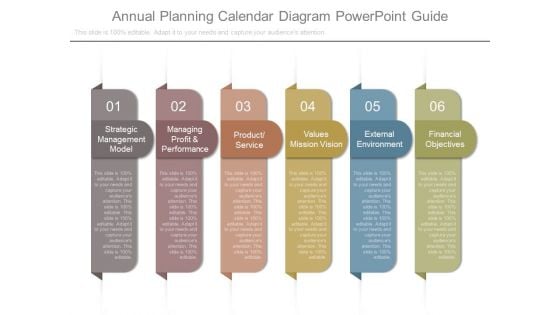
Annual Planning Calendar Diagram Powerpoint Guide
This is a annual planning calendar diagram powerpoint guide. This is a six stage process. The stages in this process are strategic management model, managing profit and performance, product service, values mission vision, external environment, financial objectives.

Scatter Bubble Chart Ppt PowerPoint Presentation Professional Model
This is a scatter bubble chart ppt powerpoint presentation professional model. This is a six stage process. The stages in this process are sales in profit, financial year, growth, business, marketing, strategy.
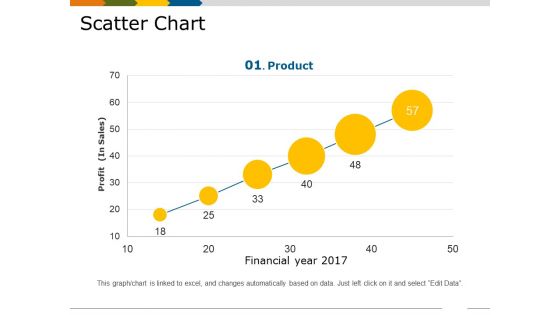
Scatter Chart Template 1 Ppt PowerPoint Presentation Show Slides
This is a scatter chart template 1 ppt powerpoint presentation show slides. This is a six stage process. The stages in this process are financial year, profit in sales, growth, business, marketing, product.
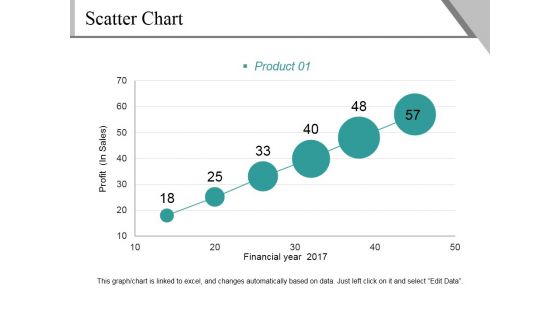
Scatter Chart Ppt PowerPoint Presentation File Background Image
This is a scatter chart ppt powerpoint presentation file background image. This is a six stage process. The stages in this process are profit, financial year, product, growth, success.
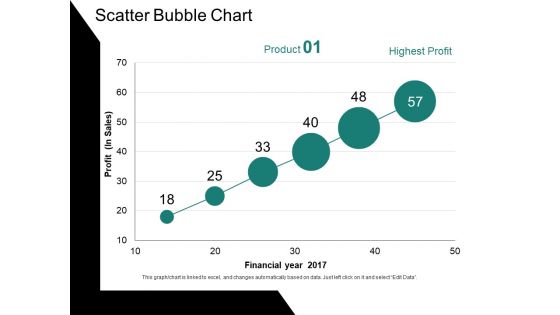
Scatter Bubble Chart Ppt PowerPoint Presentation Ideas Gallery
This is a scatter bubble chart ppt powerpoint presentation ideas gallery. This is a six stage process. The stages in this process are profit, financial year, chart, business, growth.
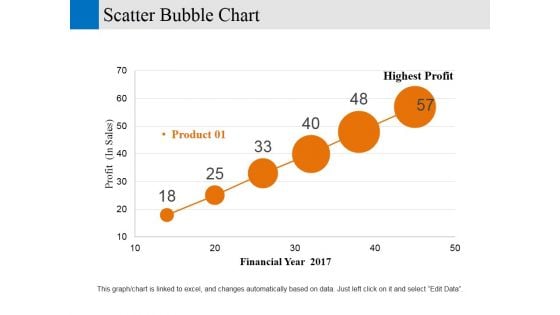
Scatter Bubble Chart Ppt PowerPoint Presentation Gallery Designs Download
This is a scatter bubble chart ppt powerpoint presentation gallery designs download. This is a six stage process. The stages in this process are financial year, profit, business, marketing, strategy.
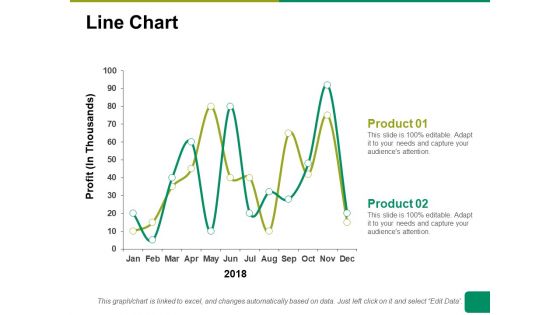
Line Chart Ppt PowerPoint Presentation Summary Ideas
This is a line chart ppt powerpoint presentation summary ideas. This is a two stage process. The stages in this process are line chart, profit, product, financial years, business.
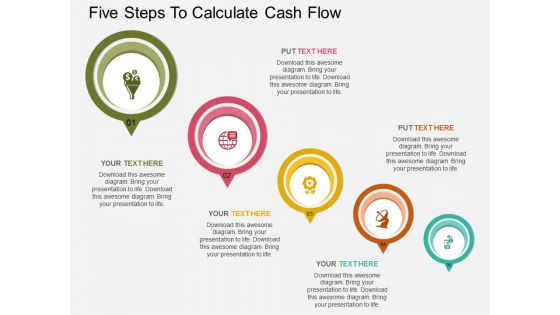
Five Steps To Calculate Cash Flow Powerpoint Template
This PPT slide has been designed with circles and financial icons. This template is designed to display finance and investment related topics. This professional slide helps in making an instant impact on viewers.
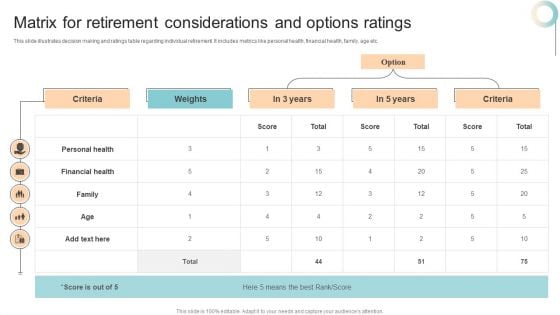
Matrix For Retirement Considerations And Options Ratings Infographics PDF
This slide illustrates decision making and ratings table regarding individual retirement. It includes metrics like personal health, financial health, family, age etc. Showcasing this set of slides titled Matrix For Retirement Considerations And Options Ratings Infographics PDF. The topics addressed in these templates are Personal Health, Financial Health, Family. All the content presented in this PPT design is completely editable. Download it and make adjustments in color, background, font etc. as per your unique business setting.
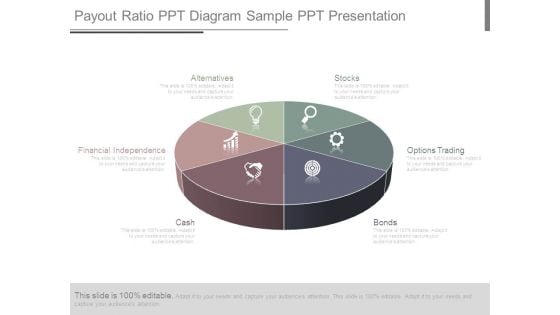
Payout Ratio Ppt Diagram Sample Ppt Presentation
This is a payout ratio ppt diagram sample ppt presentation. This is a six stage process. The stages in this process are stocks, options trading, bonds, cash, financial independence, alternatives.
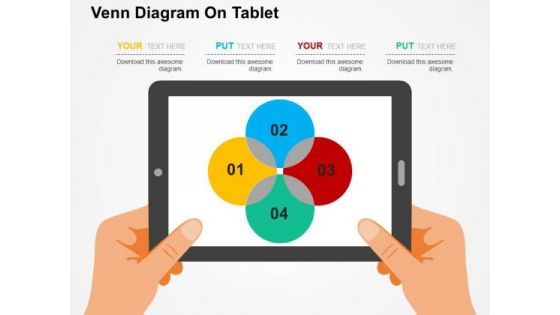
Venn Diagram On Tablet PowerPoint Template
Adjust the above image into your Presentations to visually support your content. This slide has been professionally designed with Venn diagram. This template offers an excellent background to display financial analysis.
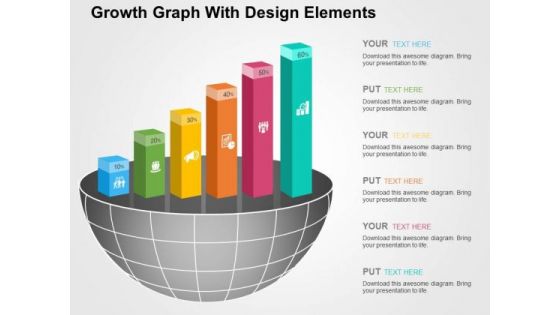
Growth Graph With Design Elements PowerPoint Templates
The above template displays growth bar graph. This PowerPoint template signifies the concept of business and financial planning. Adjust the above diagram in your business presentations to visually support your content.
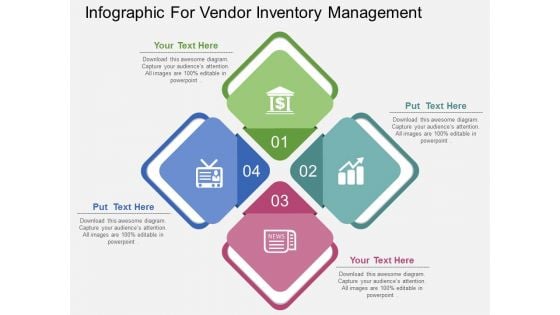
Infographic For Vendor Inventory Management Powerpoint Template
Our above slide display graphics of four connected steps with icons. Download this diagram slide to display financial management process. Adjust the above diagram in your business presentations to visually support your content.

Three Human Faces In Question Mark Shape Powerpoint Templates
Adjust the above image into your Presentations to visually support your content. This slide has been professionally designed to financial targets. This template offers an excellent background to build impressive presentation.
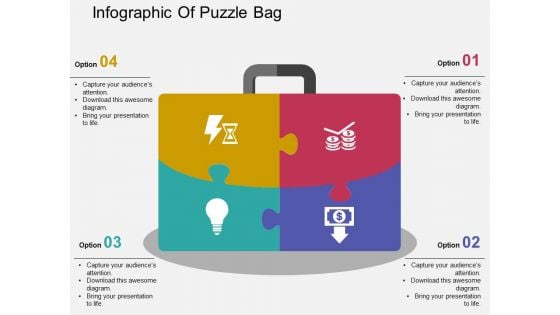
Infographic Of Puzzle Bag Powerpoint Templates
Adjust the above image into your presentations to visually support your content. This slide has been professionally designed with puzzle bag infographic. This template offers an excellent background to build financial target related presentation.
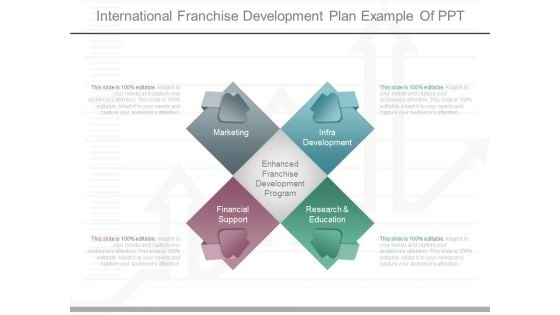
International Franchise Development Plan Example Of Ppt
This is a international franchise development plan example of ppt. This is a four stage process. The stages in this process are marketing, enhanced franchise development program, infra development, financial support, research and education.
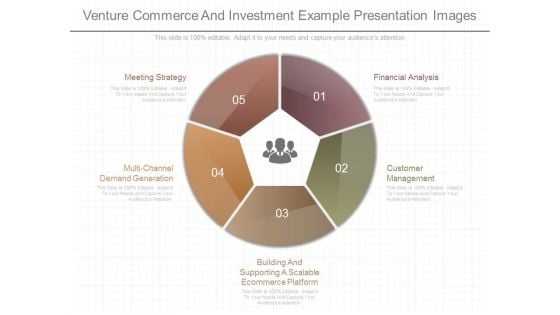
Venture Commerce And Investment Example Presentation Images
This is a venture commerce and investment example presentation images. This is a five stage process. The stages in this process are meeting strategy, multi channel demand generation, building and supporting a scalable ecommerce platform, customer management, financial analysis.

Earnings And Loss Summary For Operating Groups And Geographical Regions Portrait Pdf
The following slide displays a financial statement to analyze business profitability in various market segments. It includes details about communications, media And technology, financial services, health and public services, etc. Showcasing this set of slides titled Earnings And Loss Summary For Operating Groups And Geographical Regions Portrait Pdf. The topics addressed in these templates are Earnings And Loss Summary, Operating Groups, Geographical Regions. All the content presented in this PPT design is completely editable. Download it and make adjustments in color, background, font etc. as per your unique business setting. The following slide displays a financial statement to analyze business profitability in various market segments. It includes details about communications, media And technology, financial services, health and public services, etc.
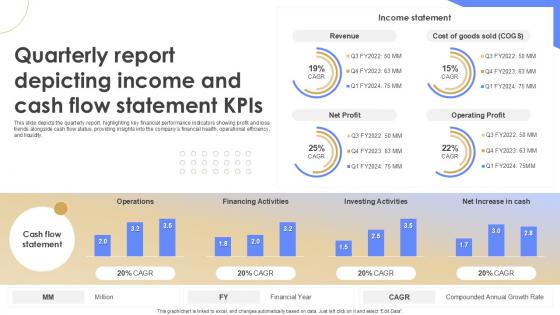
Quarterly Report Depicting Income And Cash Flow Statement KPIS Quarterly Report Ppt Example
This slide depicts the quarterly report, highlighting key financial performance indicators showing profit and loss trends alongside cash flow status, providing insights into the companys financial health, operational efficiency, and liquidity. Do you have an important presentation coming up Are you looking for something that will make your presentation stand out from the rest Look no further than Quarterly Report Depicting Income And Cash Flow Statement KPIS Quarterly Report Ppt Example With our professional designs, you can trust that your presentation will pop and make delivering it a smooth process. And with Slidegeeks, you can trust that your presentation will be unique and memorable. So why wait Grab Quarterly Report Depicting Income And Cash Flow Statement KPIS Quarterly Report Ppt Example today and make your presentation stand out from the rest This slide depicts the quarterly report, highlighting key financial performance indicators showing profit and loss trends alongside cash flow status, providing insights into the companys financial health, operational efficiency, and liquidity.
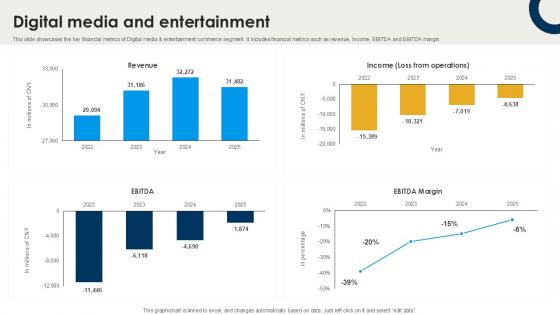
Digital Media And Entertainment International Trade Of Products And Services PPT Example CP SS V
This slide showcases the key financial metrics of Digital media and entertainment commerce segment. It includes financial metrics such as revenue, Income, EBITDA and EBITDA margin. Whether you have daily or monthly meetings, a brilliant presentation is necessary. Digital Media And Entertainment International Trade Of Products And Services PPT Example CP SS V can be your best option for delivering a presentation. Represent everything in detail using Digital Media And Entertainment International Trade Of Products And Services PPT Example CP SS V and make yourself stand out in meetings. The template is versatile and follows a structure that will cater to your requirements. All the templates prepared by Slidegeeks are easy to download and edit. Our research experts have taken care of the corporate themes as well. So, give it a try and see the results. This slide showcases the key financial metrics of Digital media and entertainment commerce segment. It includes financial metrics such as revenue, Income, EBITDA and EBITDA margin.
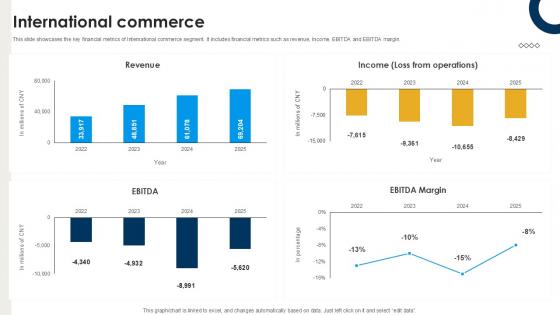
International Commerce International Trade Of Products And Services PPT Presentation CP SS V
This slide showcases the key financial metrics of International commerce segment. It includes financial metrics such as revenue, Income, EBITDA and EBITDA margin. Coming up with a presentation necessitates that the majority of the effort goes into the content and the message you intend to convey. The visuals of a PowerPoint presentation can only be effective if it supplements and supports the story that is being told. Keeping this in mind our experts created International Commerce International Trade Of Products And Services PPT Presentation CP SS V to reduce the time that goes into designing the presentation. This way, you can concentrate on the message while our designers take care of providing you with the right template for the situation. This slide showcases the key financial metrics of International commerce segment. It includes financial metrics such as revenue, Income, EBITDA and EBITDA margin.
Dollar Over Umbrella Currency Growth Filteration Ppt Slides Graphics
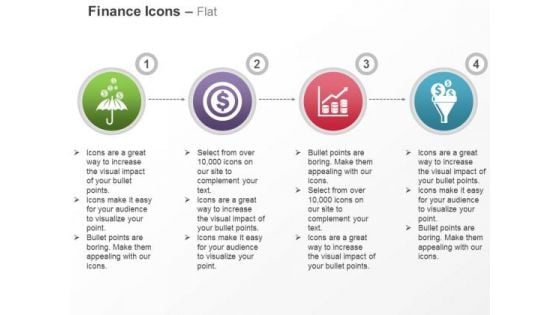
This PPT slide displays graphics of dollar with umbrella, dollar target and growth graph. This PPT helps to depict concepts of financial saving and security. This icon slide is innovatively designed to highlight your worthy views

Usage Of Conversational AI To Increase Sales Infographics Pdf
This slide showcases conversational AI software that can help organization to increase the sales of financial products and improve the revenue. Various use cases of conversational AI for increasing sales are customer acquisition and financial advising. This modern and well-arranged Usage Of Conversational AI To Increase Sales Infographics Pdf provides lots of creative possibilities. It is very simple to customize and edit with the Powerpoint Software. Just drag and drop your pictures into the shapes. All facets of this template can be edited with Powerpoint, no extra software is necessary. Add your own material, put your images in the places assigned for them, adjust the colors, and then you can show your slides to the world, with an animated slide included. This slide showcases conversational AI software that can help organization to increase the sales of financial products and improve the revenue. Various use cases of conversational AI for increasing sales are customer acquisition and financial advising.

Reporting Structure Automotive Manufacturing Company Profile CP SS V
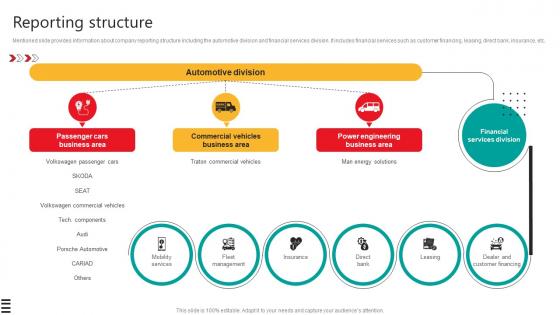
Mentioned slide provides information about company reporting structure including the automotive division and financial services division. It includes financial services such as customer financing, leasing, direct bank, insurance, etc.This Reporting Structure Automotive Manufacturing Company Profile CP SS V from Slidegeeks makes it easy to present information on your topic with precision. It provides customization options, so you can make changes to the colors, design, graphics, or any other component to create a unique layout. It is also available for immediate download, so you can begin using it right away. Slidegeeks has done good research to ensure that you have everything you need to make your presentation stand out. Make a name out there for a brilliant performance. Mentioned slide provides information about company reporting structure including the automotive division and financial services division. It includes financial services such as customer financing, leasing, direct bank, insurance, etc.
Reporting Structure Automobile Development Company Profile CP SS V
Mentioned slide provides information about company reporting structure including the automotive division and financial services division. It includes financial services such as customer financing, leasing, direct bank, insurance, etc.This Reporting Structure Automobile Development Company Profile CP SS V from Slidegeeks makes it easy to present information on your topic with precision. It provides customization options, so you can make changes to the colors, design, graphics, or any other component to create a unique layout. It is also available for immediate download, so you can begin using it right away. Slidegeeks has done good research to ensure that you have everything you need to make your presentation stand out. Make a name out there for a brilliant performance. Mentioned slide provides information about company reporting structure including the automotive division and financial services division. It includes financial services such as customer financing, leasing, direct bank, insurance, etc.
Local Consumer Services International Trade Of Products And Services PPT Example CP SS V
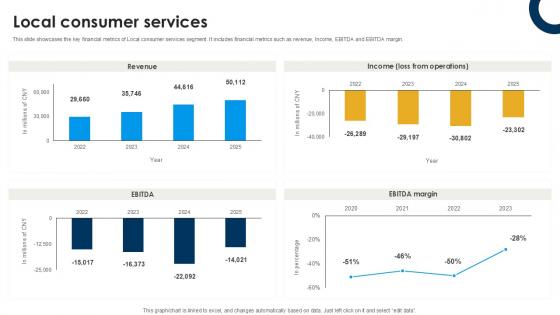
This slide showcases the key financial metrics of Local consumer services segment. It includes financial metrics such as revenue, Income, EBITDA and EBITDA margin. Welcome to our selection of the Local Consumer Services International Trade Of Products And Services PPT Example CP SS V. These are designed to help you showcase your creativity and bring your sphere to life. Planning and Innovation are essential for any business that is just starting out. This collection contains the designs that you need for your everyday presentations. All of our PowerPoints are 100Percent editable, so you can customize them to suit your needs. This multi-purpose template can be used in various situations. Grab these presentation templates today. This slide showcases the key financial metrics of Local consumer services segment. It includes financial metrics such as revenue, Income, EBITDA and EBITDA margin.


 Continue with Email

 Home
Home


