Financial Budget
Business Crisis Global PowerPoint Templates And PowerPoint Backgrounds 0611
Microsoft PowerPoint Template and Background with concept of business man stopping the financial crisis Play by the book with our Business Crisis Global PowerPoint Templates And PowerPoint Backgrounds 0611. They advocate a fair and square approach.

Pie Chart02 Business PowerPoint Templates And PowerPoint Backgrounds 0611
Microsoft PowerPoint Template and Background with pie chart business concept financial management Cast our Pie Chart02 Business PowerPoint Templates And PowerPoint Backgrounds 0611 in your act. The audience will call for an encore.
Persons On Chart Success PowerPoint Templates And PowerPoint Backgrounds 0711
Microsoft PowerPoint Template and Background with pie chart with people financial Our Persons On Chart Success PowerPoint Templates And PowerPoint Backgrounds 0711 are extremely compatible. Your thoughts will find them absolutely amenable.
Growth Graph New Business PowerPoint Templates And PowerPoint Backgrounds 0711
Microsoft PowerPoint Template and Background with graph of business and financial growth Be atypical with our Growth Graph New Business PowerPoint Templates And PowerPoint Backgrounds 0711. Sometimes it's better not to confirm.
Crisis Business PowerPoint Templates And PowerPoint Backgrounds 0911
Microsoft PowerPoint Template and Background with of business man stopping the financial crisis Learning from failures leads to success. Assimilate the lessons with our Crisis Business PowerPoint Templates And PowerPoint Backgrounds 0911.
Stock Market Crash Business PowerPoint Themes And PowerPoint Slides 0511
Microsoft PowerPoint Theme and Slide with financial concept of the stock market on fire Dream big wins with our Stock Market Crash Business PowerPoint Themes And PowerPoint Slides 0511. You will come out on top.

Business Growth People PowerPoint Themes And PowerPoint Slides 0511
Microsoft PowerPoint Slide and Theme with business concept financial conference Take control of your fate. Determine your destiny with our Business Growth People PowerPoint Themes And PowerPoint Slides 0511.
Crisis Business PowerPoint Themes And PowerPoint Slides 0911
Microsoft PowerPoint Theme and Slide with of business man stopping the financial crisis Our Crisis Business PowerPoint Themes And PowerPoint Slides 0911 are able catalysts. They will churn your thoughts and extract good plans.
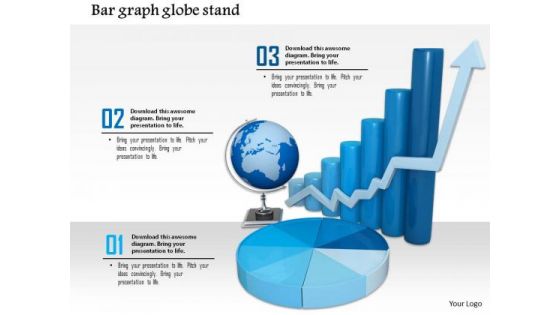
Stock Photo Graphics For Business Reports And Charts PowerPoint Slide
This image contains graphics of business reports and charts. Download this image for business and sales presentations where you have to focus on financial growth. Dazzle the audience with your thoughts.
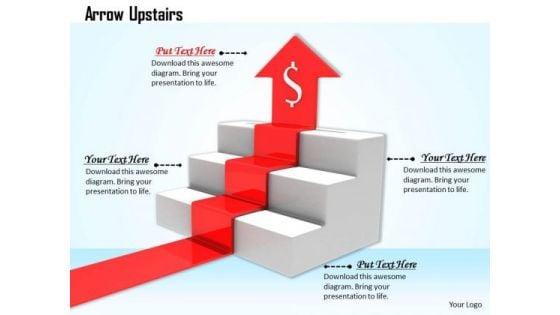
Stock Photo Red Arrow Moving Upwards In Stairs PowerPoint Slide
This image has been designed with red arrow moving upward on stairs with dollar symbol. This Image clearly relates to concept of financial growth. Use our image to drive the point to your audience and constantly attract their attention.
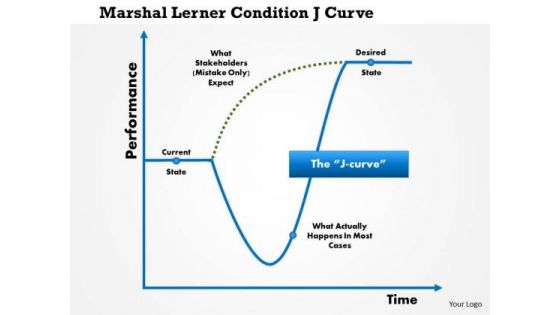
Business Framework Marshall Lerner Condition Ju Curve PowerPoint Presentation
Explain the Marshall Lerner condition and J-curve with suitable graphics. This business framework has been crafted with j-curve graphics. Use this PPT in your financial presentation to explain the depreciation and devaluation of currency for any country.
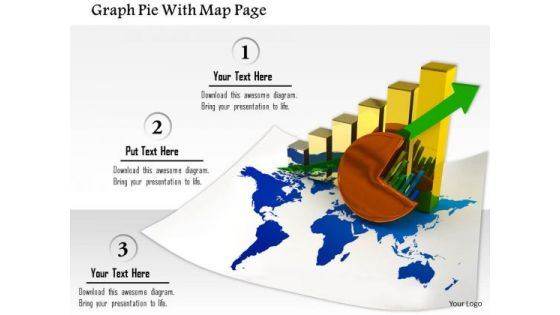
Stock Photo Graph Pie With Map Page PowerPoint Slide
This image slide contains business charts on world map. This image is designed with bar graph and pie chart on world map depicting global economy. Use this image slide to represent financial growth in any business presentation.
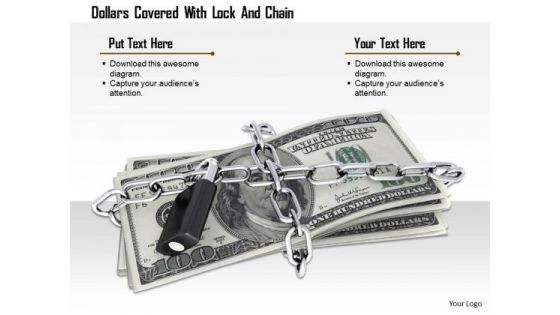
Stock Photo Dollars Covered With Lock And Chain PowerPoint Slide
This Power Point image template has been designed with graphic of dollar and chain. In this image dollar is covered with chain which shows the concept of safety. Use this image template financial security related presentations.
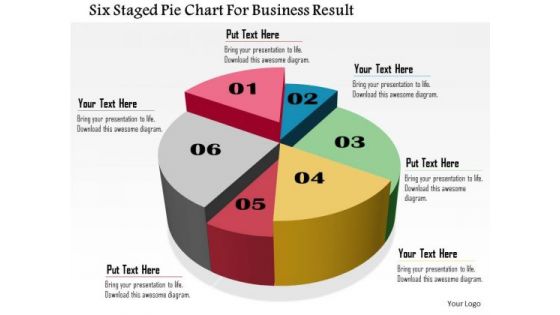
Business Daigram Six Staged Pie Chart For Business Result Presentation Templets
Six staged pie chart is used to design this business slide. Download this diagram to make business and financial reports. Use our above diagram to express information in a visual way.

Illustration Of Dollar Growth Graph PowerPoint Template
This business slide contains graphics of dollar symbols on graph. This diagram helps to portray concept of financial planning. Present your views using this innovative slide and be assured of leaving a lasting impression.
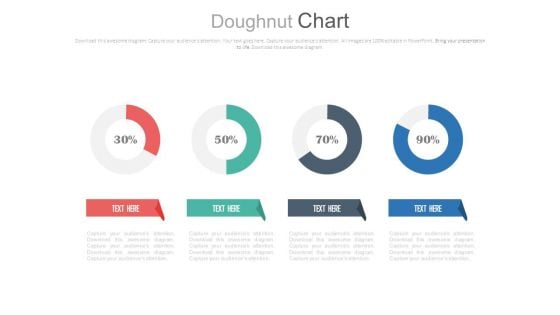
Four Circle Chart With Percentage Ratios Powerpoint Slides
This PowerPoint template has been designed with graphics of four circles and percentage ratios. You may use this dashboard slide design for topics like profit growth and financial planning. This PPT slide is powerful tool to describe your ideas.
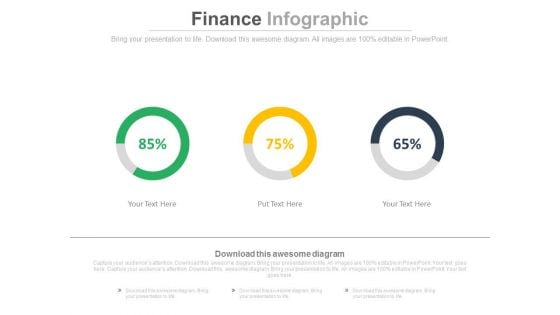
Linear Circles Percentage Analysis Charts Powerpoint Slides
This PowerPoint template has been designed with graphics of three circles and percentage ratios. You may use this dashboard slide design for topics like profit growth and financial planning. This PPT slide is powerful tool to describe your ideas.
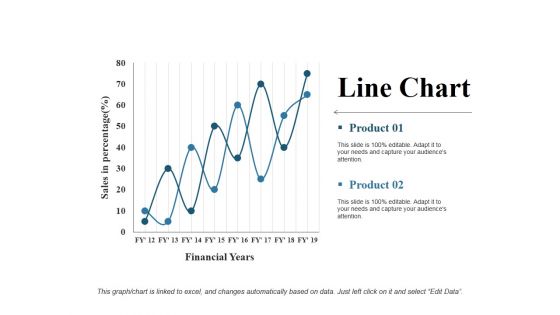
Line Chart Ppt PowerPoint Presentation Gallery Rules
This is a line chart ppt powerpoint presentation gallery rules. This is a two stage process. The stages in this process are financial years, product, sales in percentage, line chart, growth.
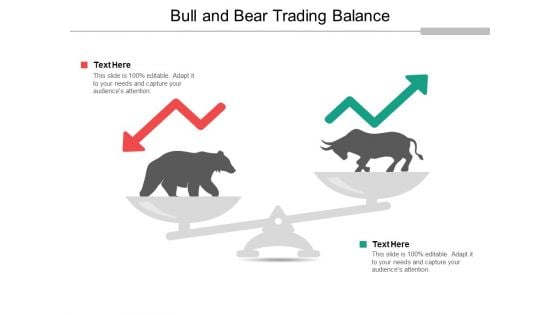
Bull And Bear Trading Balance Ppt Powerpoint Presentation Infographics Designs
This is a bull and bear trading balance ppt powerpoint presentation infographics designs. This is a two stage process. The stages in this process are stock market, financial market, bull market.
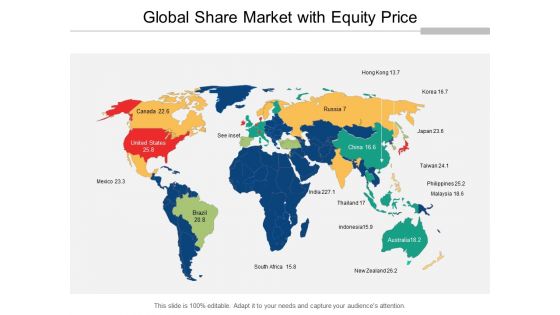
Global Share Market With Equity Price Ppt Powerpoint Presentation Inspiration Mockup
This is a global share market with equity price ppt powerpoint presentation inspiration mockup. This is a five stage process. The stages in this process are stock market, financial market, bull market.
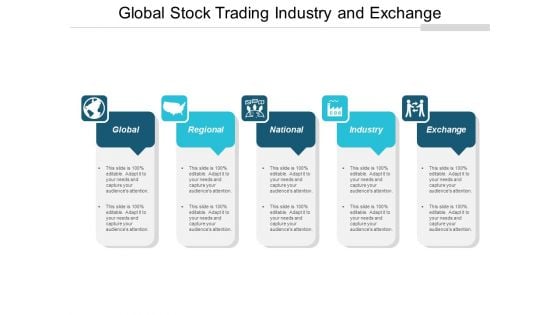
Global Stock Trading Industry And Exchange Ppt Powerpoint Presentation Ideas Summary
This is a global stock trading industry and exchange ppt powerpoint presentation ideas summary. This is a five stage process. The stages in this process are stock market, financial market, bull market.

Stock Market Trend Dollar Sign On Bar Graph Ppt Powerpoint Presentation Show Deck
This is a stock market trend dollar sign on bar graph ppt powerpoint presentation show deck. This is a four stage process. The stages in this process are stock market, financial market, bull market.
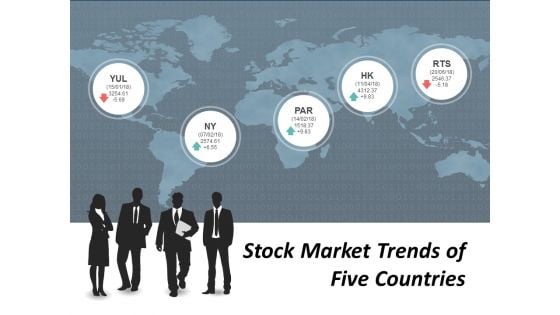
Stock Market Trends Of Five Countries Ppt Powerpoint Presentation Model Guidelines
This is a stock market trends of five countries ppt powerpoint presentation model guidelines. This is a four stage process. The stages in this process are stock market, financial market, bull market.
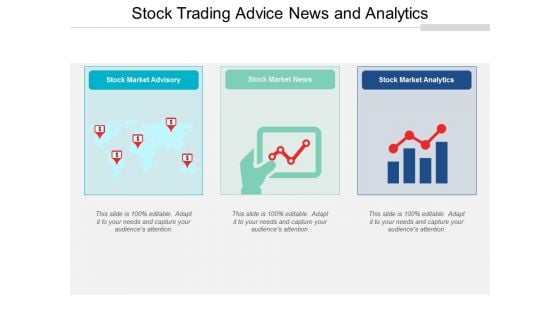
Stock Trading Advice News And Analytics Ppt Powerpoint Presentation Show Design Inspiration
This is a stock trading advice news and analytics ppt powerpoint presentation show design inspiration. This is a three stage process. The stages in this process are stock market, financial market, bull market.
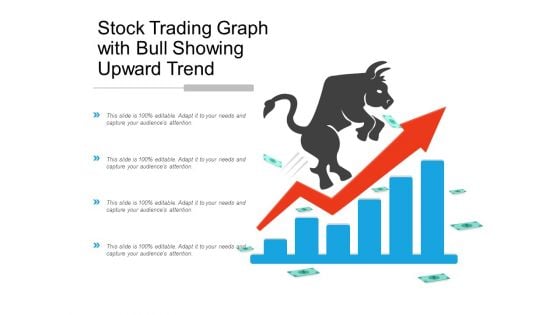
Stock Trading Graph With Bull Showing Upward Trend Ppt Powerpoint Presentation Pictures Outfit
This is a stock trading graph with bull showing upward trend ppt powerpoint presentation pictures outfit. This is a four stage process. The stages in this process are stock market, financial market, bull market.
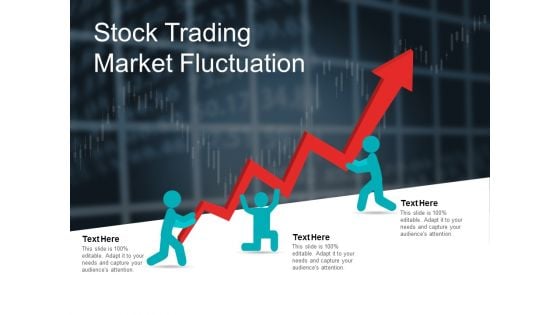
Stock Trading Market Fluctuation Ppt Powerpoint Presentation Professional Visuals
This is a stock trading market fluctuation ppt powerpoint presentation professional visuals. This is a three stage process. The stages in this process are stock market, financial market, bull market.
Annual Report Vector Icon Ppt Powerpoint Presentation File Gridlines
This is a annual report vector icon ppt powerpoint presentation file gridlines. This is a three stage process. The stages in this process are financial statements icon, accounting ratio icon, balance sheet icon.
Balance Sheet Vector Icon Ppt Powerpoint Presentation Designs Download
This is a balance sheet vector icon ppt powerpoint presentation designs download. This is a three stage process. The stages in this process are financial statements icon, accounting ratio icon, balance sheet icon.
Business Report Vector Icon Ppt Powerpoint Presentation Summary Guidelines
This is a business report vector icon ppt powerpoint presentation summary guidelines. This is a three stage process. The stages in this process are financial statements icon, accounting ratio icon, balance sheet icon.
Growth Arrow On Bar Graph Icon Ppt Powerpoint Presentation Infographic Template Clipart
This is a growth arrow on bar graph icon ppt powerpoint presentation infographic template clipart. This is a three stage process. The stages in this process are financial statements icon, accounting ratio icon, balance sheet icon.
Income Statement And Auditing Vector Icon Ppt Powerpoint Presentation Clipart
This is a income statement and auditing vector icon ppt powerpoint presentation clipart. This is a three stage process. The stages in this process are financial statements icon, accounting ratio icon, balance sheet icon.
Stock Market Analysis Magnifying Glass Over Bar Graph And Dollar Sign Ppt PowerPoint Presentation Icon Visual Aids
This is a stock market analysis magnifying glass over bar graph and dollar sign ppt powerpoint presentation icon visual aids. This is a four stage process. The stages in this process are stock market, financial markets, bull market.
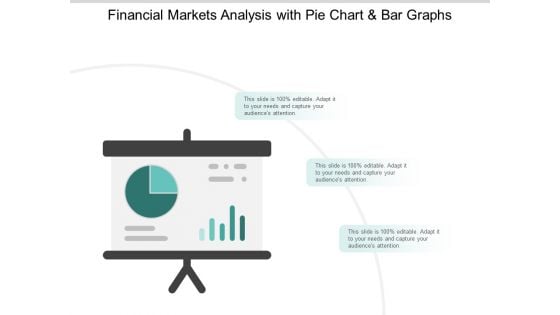
Stock Market Survey Reporting With Pie Chat And Bar Graph Ppt PowerPoint Presentation Infographic Template Example 2015
This is a stock market survey reporting with pie chat and bar graph ppt powerpoint presentation infographic template example 2015. This is a three stage process. The stages in this process are stock market, financial markets, bull market.
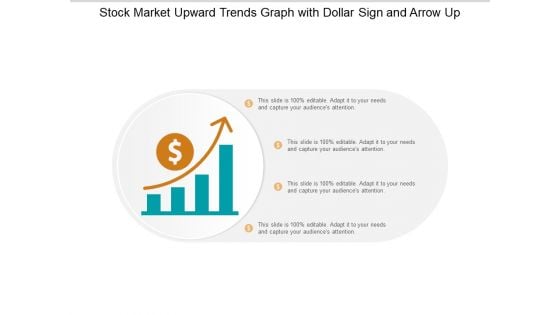
Stock Market Upward Trends Graph With Dollar Sign And Arrow Up Ppt PowerPoint Presentation Professional Graphics Download
This is a stock market upward trends graph with dollar sign and arrow up ppt powerpoint presentation professional graphics download. This is a four stage process. The stages in this process are stock market, financial markets, bull market.
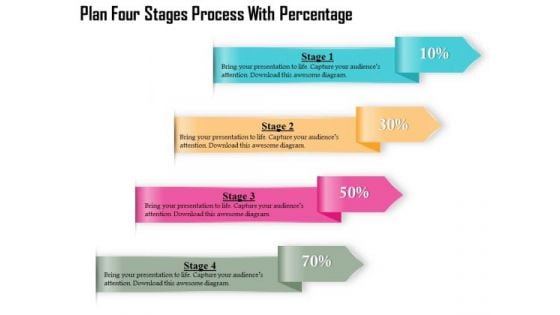
Business Diagram Four Stages Process With Percentage Presentation Template
Four multicolored tags in vertical order has been used to decorate this business diagram. This diagram contains the concept of financial data display with percent values. This diagram can be used for management and finance related presentations.

Business Diagram Three Stages Process Percentage Presentation Template
Three multicolored tags in vertical order has been used to decorate this business diagram. This diagram contains the concept of financial data display with percent values. This diagram can be used for management and finance related presentations.
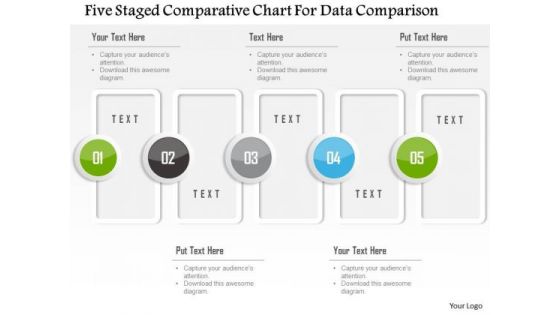
Business Diagram Five Staged Comparative Chart For Data Comparison Presentation Template
Five staged comparative chart has been used to design this power point template. This PPT contains the concept of data comparison. Use this PPT for your business and finance based data comparison in any financial presentation.
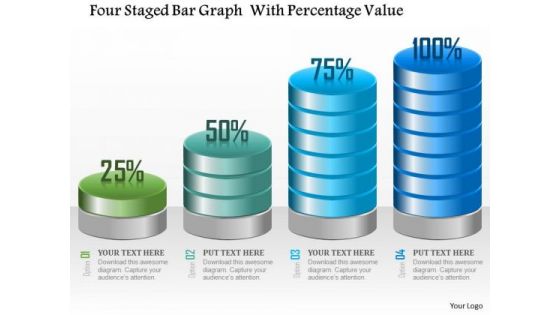
Business Diagram Four Staged Bar Graph With Percentage Value Presentation Template
Four staged bar graph with percentage value has been used to craft this power point template. This PPT contains the concept of making financial timeline and result analysis. This PPT can be used for business and finance related presentations.
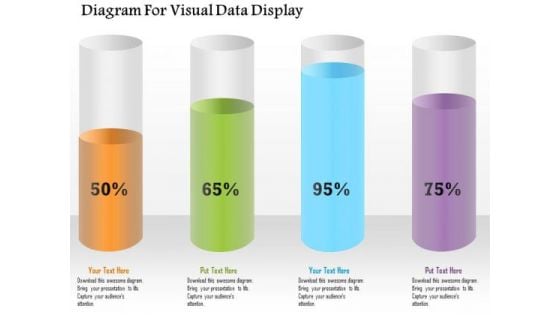
Business Diagram Diagram For Visual Data Display Presentation Template
Four colored cylindrical bars with percentage values are used to design this power point template. This diagram slide helps to display financial data analysis. Use this diagram for your business and finance related presentations.
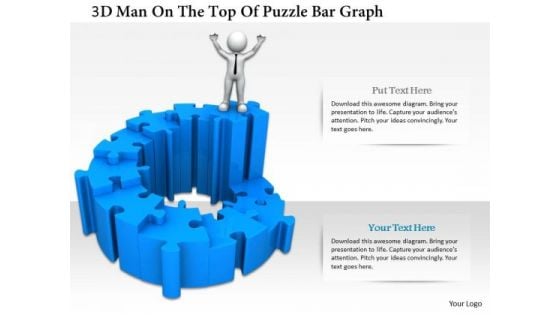
3d Man On The Top Of Puzzle Bar Graph
This PPT has been designed with graphic of 3d man and puzzle are graph. This PPT displays the concept of result analysis and financial growth. Use this PPT for your business and finance related presentations.
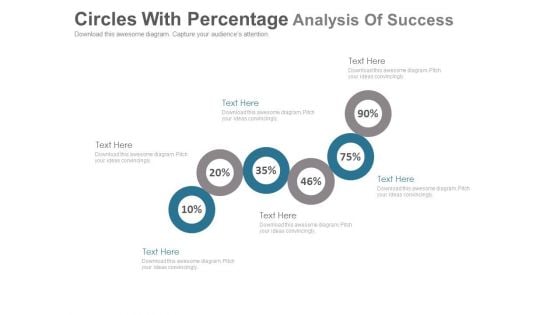
Six Circles For Percentage Value Analysis Powerpoint Slides
This PowerPoint template has been designed with six circles and percentage values. This PPT slide can be used to display financial ratio analysis. You can download finance PowerPoint template to prepare awesome presentations.
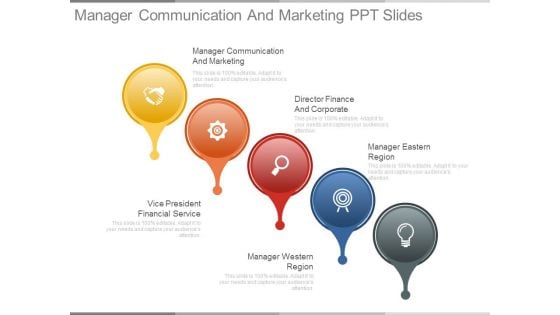
Manager Communication And Marketing Ppt Slides
This is a manager communication and marketing ppt slides. This is a five stage process. The stages in this process are manager communication and marketing, director finance and corporate, manager eastern region, vice president financial service, manager western region.
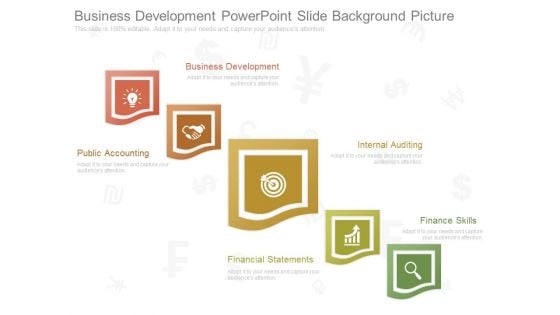
Business Development Powerpoint Slide Background Picture
This is a business development powerpoint slide background picture. This is a five stage process. The stages in this process are business development, public accounting, internal auditing, finance skills, financial statements.
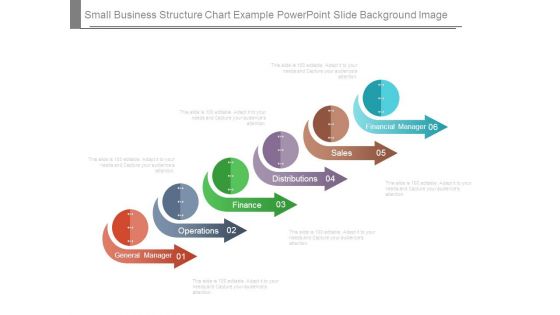
Small Business Structure Chart Example Powerpoint Slide Background Image
This is a small business structure chart example powerpoint slide background image. This is a six stage process. The stages in this process are financial manager, sales, distributions, finance, operations, general manager.
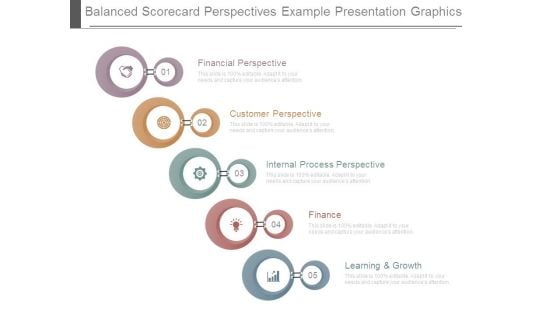
Balanced Scorecard Perspectives Example Presentation Graphics
This is a balanced scorecard perspectives example presentation graphics. This is a five stage process. The stages in this process are financial perspective, customer perspective, internal process perspective, finance, learning and growth.

Our Team Ppt PowerPoint Presentation Show Sample
This is a our team ppt powerpoint presentation show sample. This is a seven stage process. The stages in this process are finance manager, web designer, financial advisor, sales marketing, product manager, graphic designer, editor, ceo.
Area Chart Ppt PowerPoint Presentation Gallery Icons
This is a area chart ppt powerpoint presentation gallery icons. This is a two stage process. The stages in this process are financial year, sales in percentage, product, finance, graph.
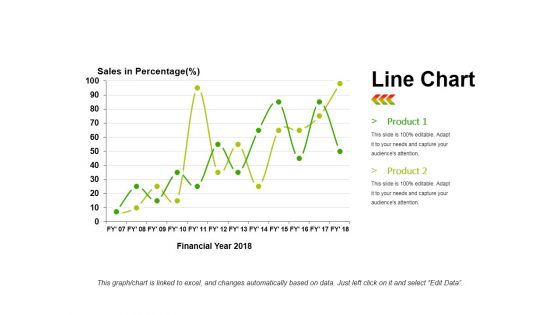
Line Chart Ppt PowerPoint Presentation Infographics Infographics
This is a line chart ppt powerpoint presentation infographics infographics. This is a two stage process. The stages in this process are product, sales in percentage, financial year, line chart, finance.
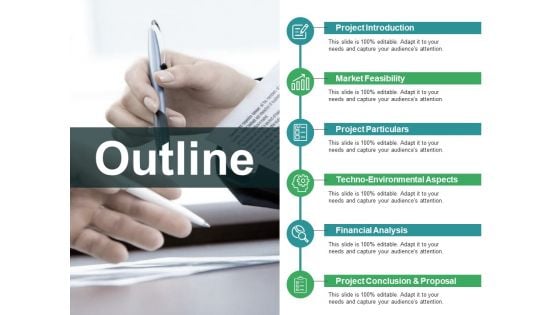
Outline Ppt PowerPoint Presentation Model Visual Aids
This is a outline ppt powerpoint presentation model visual aids. This is a six stage process. The stages in this process are project introduction, market feasibility, project particulars, financial analysis.
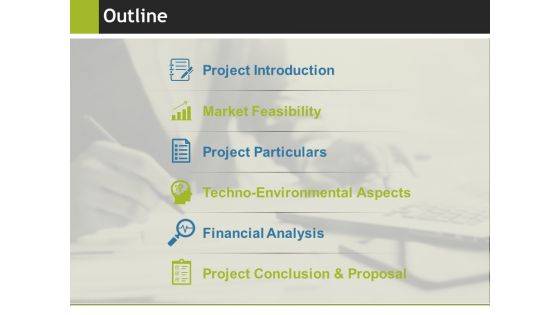
Outline Ppt PowerPoint Presentation Slides Show
This is a outline ppt powerpoint presentation slides show. This is a six stage process. The stages in this process are project introduction, market feasibility, project particulars, techno environmental aspects, financial analysis.
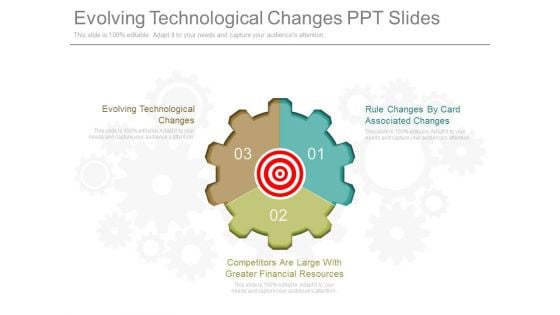
Evolving Technological Changes Ppt Slides
This is a evolving technological changes ppt slides. This is a three stage process. The stages in this process are evolving technological changes, competitors are large with greater financial resources, rule changes by card associated changes.

Competitive Advantage In Marketing Powerpoint Presentation
This is a competitive advantage in marketing powerpoint presentation. This is a six stage process. The stages in this process are sustainable competitive advantage, marketing strategy, operations strategy, innovation strategy, human resource strategy, financial strategy.

Customer Relationship Management Ppt Images
This is a customer relationship management ppt images. This is a four stage process. The stages in this process are customer relationship management, enterprise resource planning, business process redesign, financial management.
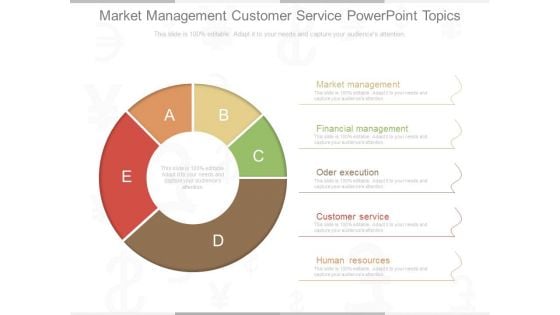
Market Management Customer Service Powerpoint Topics
This is a market management customer service powerpoint topics. This is a five stage process. The stages in this process are market management, financial management, oder execution, customer service, human resources.
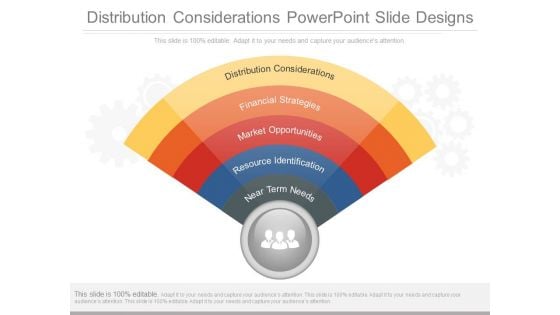
Distribution Considerations Powerpoint Slide Designs
This is a distribution considerations powerpoint slide designs. This is a five stage process. The stages in this process are distribution considerations, financial strategies, market opportunities, resource identification, near term needs.
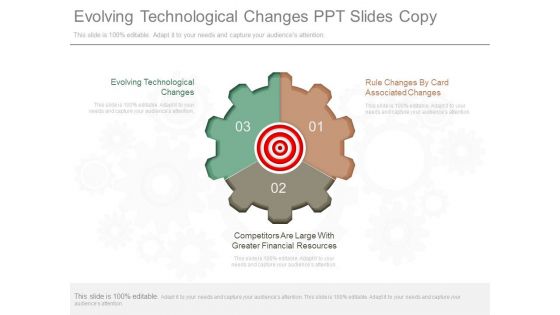
Evolving Technological Changes Ppt Slides Copy
This is a evolving technological changes ppt slides copy. This is a three stage process. The stages in this process are evolving technological changes, rule changes by card associated changes, competitors are large with greater financial resources.
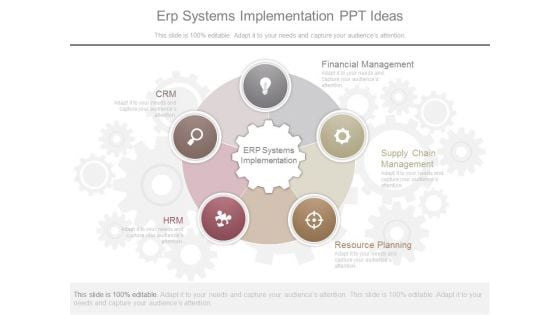
Erp Systems Implementation Ppt Ideas
This is a erp systems implementation ppt ideas. This is a five stage process. The stages in this process are crm, financial management, supply chain management, resource planning, hrm, erp systems implementation.\n\n\n \n
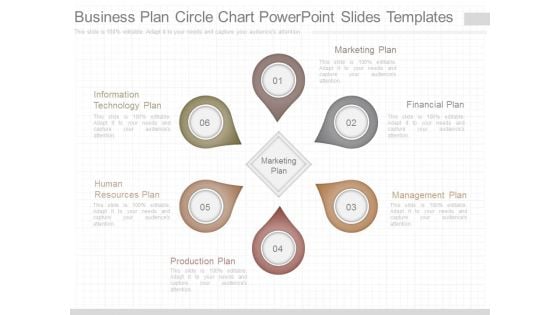
Business Plan Circle Chart Powerpoint Slides Templates
This is a business plan circle chart powerpoint slides templates. This is a six stage process. The stages in this process are information technology plan, human resources plan, production plan, marketing plan, marketing plan, financial plan, management plan.
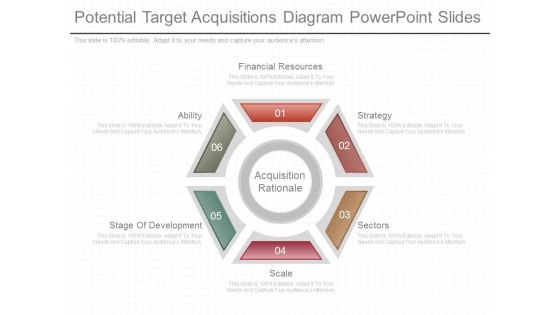
Potential Target Acquisitions Diagram Powerpoint Slides
This is a potential target acquisitions diagram powerpoint slides. This is a six stage process. The stages in this process are acquisition rationale, financial resources, strategy, sectors, scale, stage of development, ability.

Service Oriented Architecture Presentation Ideas
This is a service oriented architecture presentation ideas. This is a seven stage process. The stages in this process are service management system, outsourced services, centrique, other products, action planning, financial impact, change management, new products, payroll, human resource.


 Continue with Email

 Home
Home


