Financial Goals

Our Team Ppt PowerPoint Presentation Layouts Deck
This is a our team ppt powerpoint presentation layouts deck. This is a three stage process. The stages in this process are marketing manager, financial manager, product manager.
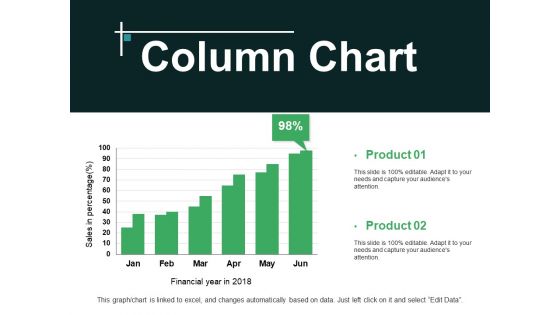
Column Chart Ppt PowerPoint Presentation Professional Aids
This is a column chart ppt powerpoint presentation professional aids. This is a two stage process. The stages in this process are product, sales in percentage, financial years.
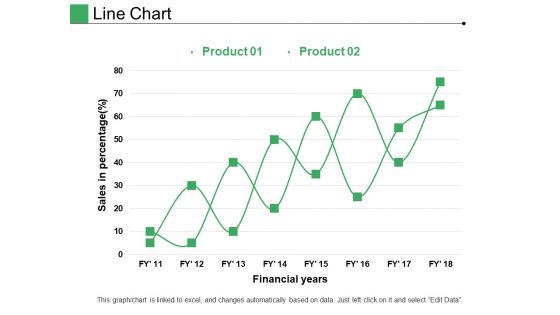
Line Chart Ppt PowerPoint Presentation Pictures Layout
This is a line chart ppt powerpoint presentation pictures layout. This is a two stage process. The stages in this process are product, financial years, sales in percentage.
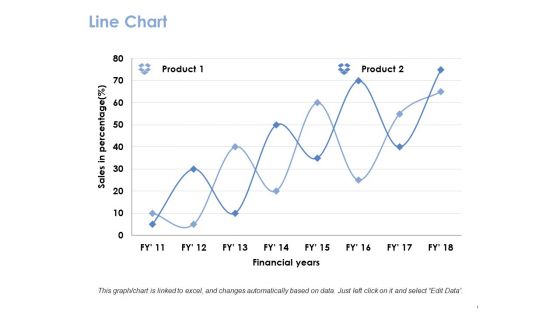
Line Chart Ppt PowerPoint Presentation Gallery Guide
This is a line chart ppt powerpoint presentation gallery guide. This is a two stage process. The stages in this process are product, financial years, sales in percentage.
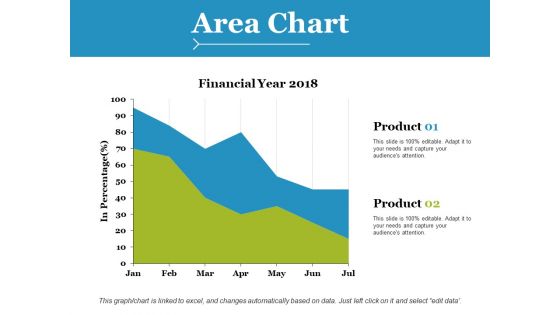
Area Chart Ppt PowerPoint Presentation Styles Brochure
This is a area chart ppt powerpoint presentation styles brochure. This is a two stage process. The stages in this process are product, financial years, in percentage.

Line Chart Ppt PowerPoint Presentation Gallery Example Introduction
This is a line chart ppt powerpoint presentation portfolio shapes. This is a two stage process. The stages in this process are product, financial years, line chart.
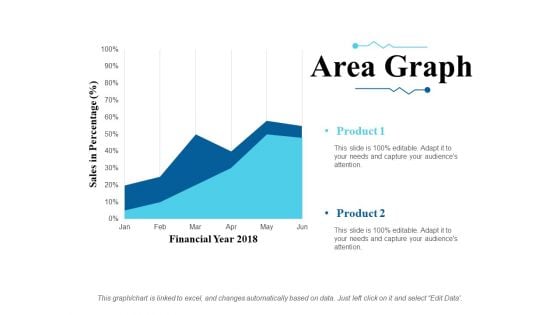
Area Graph Ppt PowerPoint Presentation Slides Ideas
This is a area graph ppt powerpoint presentation slides ideas. This is a two stage process. The stages in this process are sales in percentage, financial year, product.
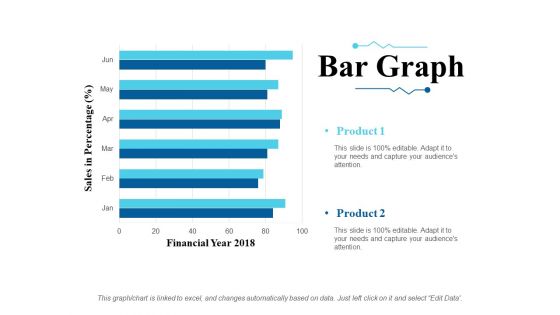
Bar Graph Ppt PowerPoint Presentation Inspiration Slides
This is a bar graph ppt powerpoint presentation inspiration slides. This is a six stage process. The stages in this process are sales in percentage, financial year, product.
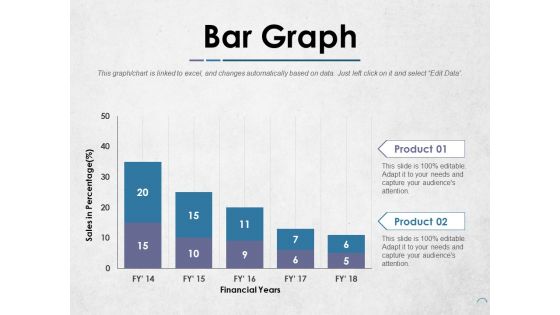
Bar Graph Ppt PowerPoint Presentation Infographics Templates
This is a bar graph ppt powerpoint presentation infographics templates. This is a two stage process. The stages in this process are product, financial years, sales in percentage.
Line Chart Ppt PowerPoint Presentation Icon Inspiration
This is a line chart ppt powerpoint presentation icon inspiration. This is a two stage process. The stages in this process are product, financial years, sales in percentage.
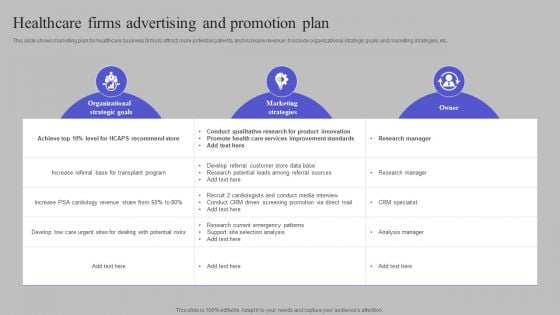
Healthcare Firms Advertising And Promotion Plan Background PDF
This slide shows marketing plan for healthcare business firms to attract more potential patients and increase revenue. It include organizational strategic goals and marketing strategies, etc. Showcasing this set of slides titled Healthcare Firms Advertising And Promotion Plan Background PDF. The topics addressed in these templates are Organizational Strategic Goals, Marketing Strategies, Owner. All the content presented in this PPT design is completely editable. Download it and make adjustments in color, background, font etc. as per your unique business setting.

Stock Photo Lifesaving Belts On Dollars PowerPoint Slide
Define your ideas in inspiring manner with this image of lifesaving belts with dollars. Use this image to describe the concept of financial crisis. You may use this image to share a plan to achieve the desired goals.
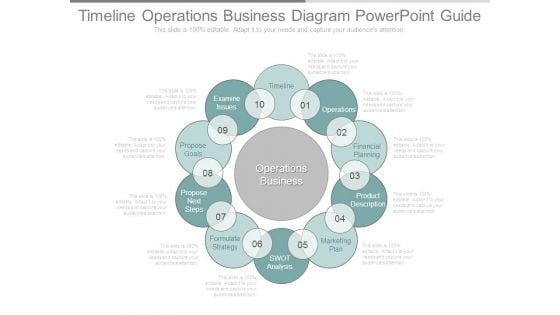
Timeline Operations Business Diagram Powerpoint Guide
This is a timeline operations business diagram powerpoint guide. This is a ten stage process. The stages in this process are examine issues, propose goals, propose next steps, formulate strategy, swot analysis, timeline, operations, financial planning, product description, marketing plan.
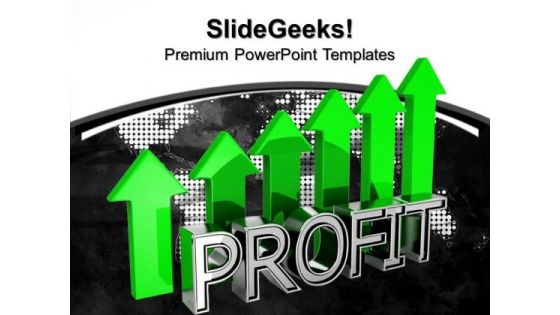
Profit Graph Business PowerPoint Templates And PowerPoint Themes 0912
Profit Graph Business PowerPoint Templates And PowerPoint Themes 0912-Microsoft Powerpoint Templates and Background with arrows pointing up business and financial growth concept-Arrows pointing up business and financial growth concept, business, arrows, success, finance, targets Enhance feasibility with our Profit Graph Business PowerPoint Templates And PowerPoint Themes 0912. Exhort your team to eventual success.
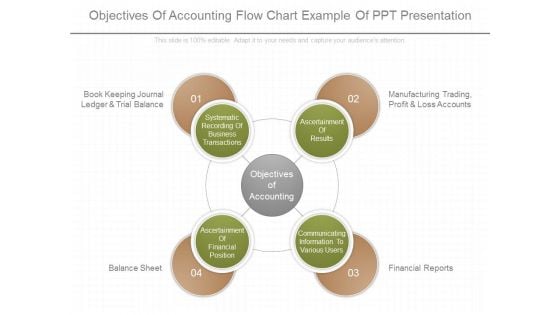
Objectives Of Accounting Flow Chart Example Of Ppt Presentation
This is a objectives of accounting flow chart example of ppt presentation. This is a four stage process. The stages in this process are book keeping journal ledger and trial balance, manufacturing trading profit and loss accounts, balance sheet, financial reports, systematic recording of business transactions, ascertainment of results, ascertainment of financial position, communicating information to various users, objectives of accounting.
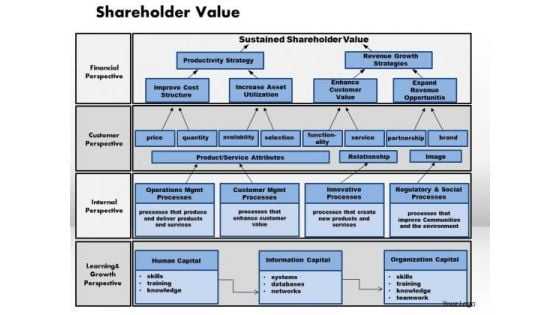
Business Framework Shareholder Value PowerPoint Presentation
Display the shareholder value and financial perspectives in your financial presentation by using this exclusive PPT. this business framework PPT contains the graphic of sequential network of shareholders. Use this PPT and build exclusive presentation for share value and customer perspective related topics.

Sustainable Development Plan Matrix For New Business Elements Pdf
This slide exhibits a sustainability plan to achieve targets and achieve environmental, financial, and social sustainability. it includes plan components such as develop company vision, mission, develop goals and objectives, analyse additional cost and etc. Showcasing this set of slides titled Sustainable Development Plan Matrix For New Business Elements Pdf. The topics addressed in these templates are Develop Company Vision, Develop Goals, Analyse Additional Cost . All the content presented in this PPT design is completely editable. Download it and make adjustments in color, background, font etc. as per your unique business setting. This slide exhibits a sustainability plan to achieve targets and achieve environmental, financial, and social sustainability. it includes plan components such as develop company vision, mission, develop goals and objectives, analyse additional cost and etc.
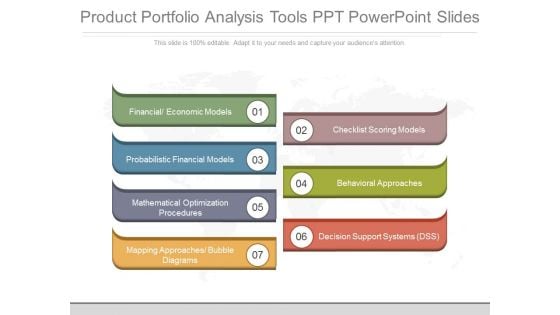
Product Portfolio Analysis Tools Ppt Powerpoint Slides
This is a product portfolio analysis tools ppt powerpoint slides. This is a seven stage process. The stages in this process are financial economic models, probabilistic financial models, mathematical optimization procedures, mapping approaches bubble diagrams, checklist scoring models, behavioral approaches, decision support systems dss.\n\n\n\n\n\n\n\n\n\n\n \n
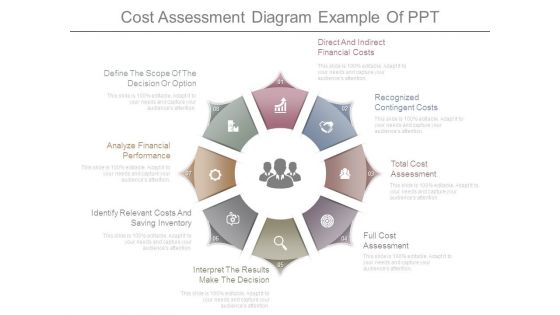
Cost Assessment Diagram Example Of Ppt
This is a cost assessment diagram example of ppt. This is a eight stage process. The stages in this process are define the scope of the decision or option, analyze financial performance, identify relevant costs and saving inventory, interpret the results make the decision, full cost assessment, total cost assessment, recognized contingent costs, direct and indirect financial costs.
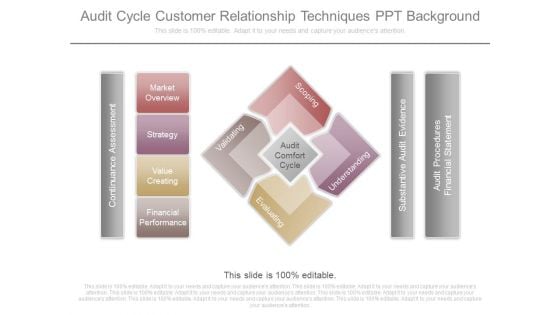
Audit Cycle Customer Relationship Techniques Ppt Background
This is a audit cycle customer relationship techniques ppt background. This is a four stage process. The stages in this process are market overview, strategy, value creating, financial performance, continuance assessment, scoping, validating, audit comfort cycle, evaluating, understanding, substantive audit evidence, audit procedures financial statement.
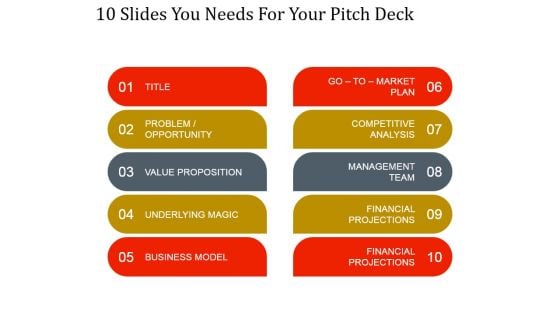
10 Slides You Needs For Your Pitch Deck Ppt PowerPoint Presentation Gallery
This is a 10 slides you needs for your pitch deck ppt powerpoint presentation gallery. This is a ten stage process. The stages in this process are title, problem opportunity, value proposition, underlying magic, business model, go to market plan, competitive analysis, management team, financial projections, financial projections.
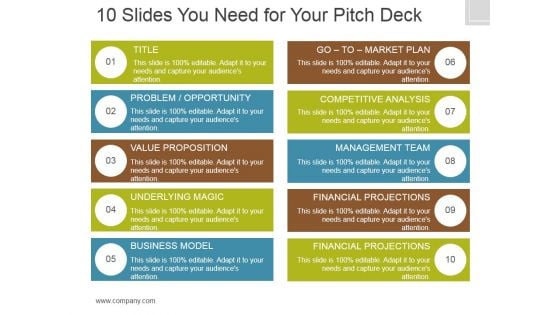
10 Slides You Need For Your Pitch Deck Ppt PowerPoint Presentation Samples
This is a 10 slides you need for your pitch deck ppt powerpoint presentation samples. This is a ten stage process. The stages in this process are title, problem opportunity, value proposition, underlying magic, business model, go to market plan, competitive analysis, management team, financial projections, financial projections.
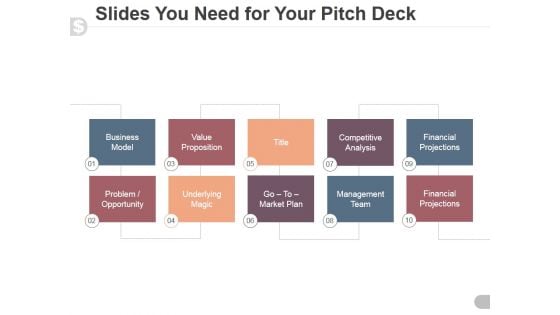
Slides You Need For Your Pitch Deck Ppt PowerPoint Presentation Ideas
This is a slides you need for your pitch deck ppt powerpoint presentation ideas. This is a ten stage process. The stages in this process are business model, value proposition, title, competitive analysis, financial projections, problem opportunity, underlying magic, go to market plan, management team, financial projections.
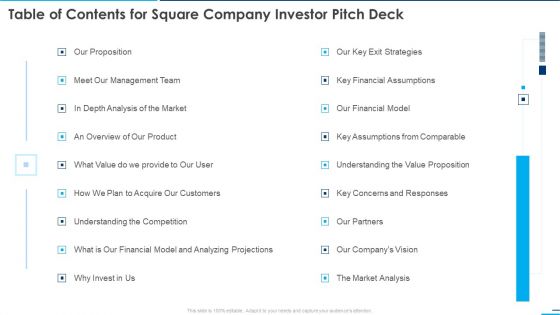
Table Of Contents For Square Company Investor Pitch Deck Ppt Outline Graphic Images PDF
Deliver an awe inspiring pitch with this creative table of contents for square company investor pitch deck ppt outline graphic images pdf bundle. Topics like management team, analysis, financial assumptions, financial model can be discussed with this completely editable template. It is available for immediate download depending on the needs and requirements of the user.
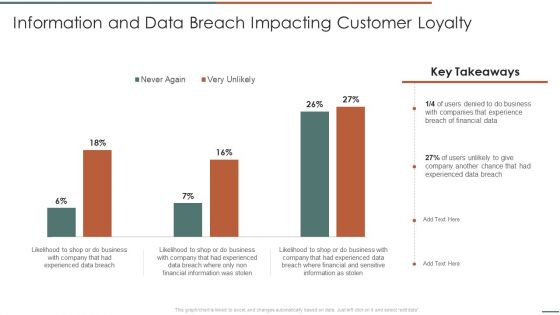
Information Security Risk Evaluation Information And Data Breach Impacting Customer Loyalty Structure PDF
Deliver an awe inspiring pitch with this creative Information Security Risk Evaluation Information And Data Breach Impacting Customer Loyalty Structure PDF bundle. Topics like Companies Experience, Financial Information, Breach Of Financial can be discussed with this completely editable template. It is available for immediate download depending on the needs and requirements of the user.
Market Leading Retail Capabilities Chart Powerpoint Slide Backgrounds
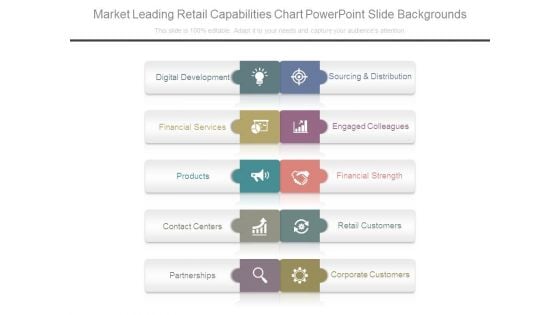
This is a market leading retail capabilities chart powerpoint slide backgrounds. This is a five stage process. The stages in this process are digital development, financial services, products, contact centers, partnerships, sourcing and distribution, engaged colleagues, financial strength, retail customers, corporate customers.
Monthly Event Management Process Stages Timeline For Customer Engagement Formats PDF
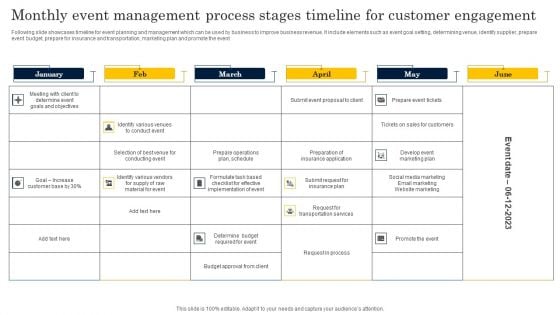
Following slide showcases timeline for event planning and management which can be used by business to improve business revenue. It include elements such as event goal setting, determining venue, identify supplier, prepare event budget, prepare for insurance and transportation, marketing plan and promote the event. Showcasing this set of slides titled Monthly Event Management Process Stages Timeline For Customer Engagement Formats PDF. The topics addressed in these templates are Meeting With Client, Determine Event, Goals Objectives . All the content presented in this PPT design is completely editable. Download it and make adjustments in color, background, font etc. as per your unique business setting.
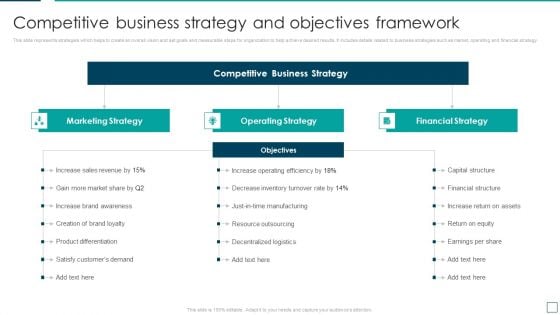
Enterprise Risk Management Competitive Business Strategy And Objectives Diagrams PDF
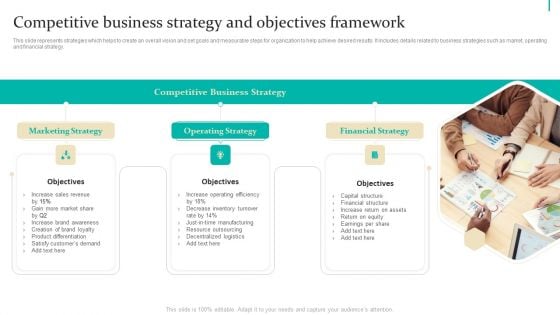
This slide represents strategies which helps to create an overall vision and set goals and measurable steps for organization to help achieve desired results. It includes details related to business strategies such as market, operating and financial strategy. Get a simple yet stunning designed Enterprise Risk Management Competitive Business Strategy And Objectives Diagrams PDF. It is the best one to establish the tone in your meetings. It is an excellent way to make your presentations highly effective. So, download this PPT today from Slidegeeks and see the positive impacts. Our easy-to-edit Enterprise Risk Management Competitive Business Strategy And Objectives Diagrams PDF can be your go-to option for all upcoming conferences and meetings. So, what are you waiting for Grab this template today.
Enterprise Risk Management And Mitigation Program Competitive Business Strategy And Objectives Framework Rules PDF
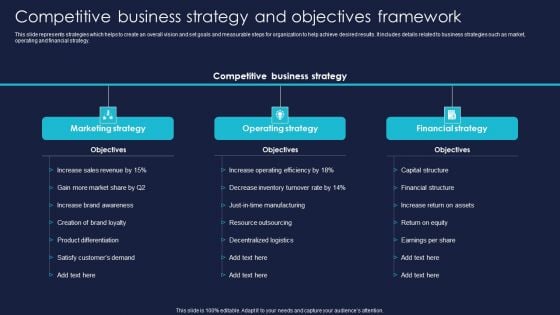
This slide represents strategies which helps to create an overall vision and set goals and measurable steps for organization to help achieve desired results. It includes details related to business strategies such as market, operating and financial strategy. If you are looking for a format to display your unique thoughts, then the professionally designed Enterprise Risk Management And Mitigation Program Competitive Business Strategy And Objectives Framework Rules PDF is the one for you. You can use it as a Google Slides template or a PowerPoint template. Incorporate impressive visuals, symbols, images, and other charts. Modify or reorganize the text boxes as you desire. Experiment with shade schemes and font pairings. Alter, share or cooperate with other people on your work. Download Enterprise Risk Management And Mitigation Program Competitive Business Strategy And Objectives Framework Rules PDF and find out how to give a successful presentation. Present a perfect display to your team and make your presentation unforgettable.
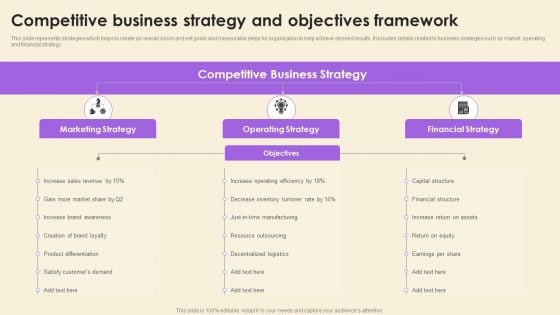
Strategic Risk Management And Mitigation Plan Competitive Business Strategy And Objectives Framework Clipart PDF
This slide represents strategies which helps to create an overall vision and set goals and measurable steps for organization to help achieve desired results. It includes details related to business strategies such as market, operating and financial strategy. If you are looking for a format to display your unique thoughts, then the professionally designed Strategic Risk Management And Mitigation Plan Competitive Business Strategy And Objectives Framework Clipart PDF is the one for you. You can use it as a Google Slides template or a PowerPoint template. Incorporate impressive visuals, symbols, images, and other charts. Modify or reorganize the text boxes as you desire. Experiment with shade schemes and font pairings. Alter, share or cooperate with other people on your work. Download Strategic Risk Management And Mitigation Plan Competitive Business Strategy And Objectives Framework Clipart PDF and find out how to give a successful presentation. Present a perfect display to your team and make your presentation unforgettable.
Operational Risk Assessment And Management Plan Competitive Business Strategy And Objectives Framework Ideas PDF
This slide represents strategies which helps to create an overall vision and set goals and measurable steps for organization to help achieve desired results. It includes details related to business strategies such as market, operating and financial strategy. Get a simple yet stunning designed Operational Risk Assessment And Management Plan Competitive Business Strategy And Objectives Framework Ideas PDF. It is the best one to establish the tone in your meetings. It is an excellent way to make your presentations highly effective. So, download this PPT today from Slidegeeks and see the positive impacts. Our easy-to-edit Operational Risk Assessment And Management Plan Competitive Business Strategy And Objectives Framework Ideas PDF can be your go-to option for all upcoming conferences and meetings. So, what are you waiting for. Grab this template today.
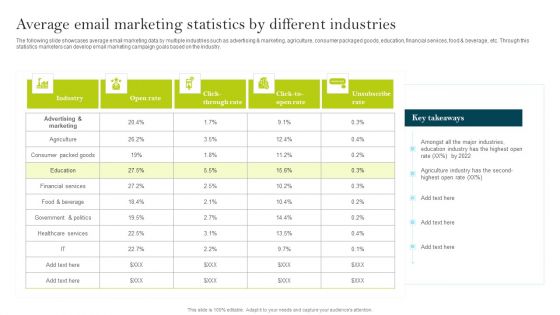
Average Email Marketing Statistics By Different Industries Ppt PowerPoint Presentation File Slides PDF
The following slide showcases average email marketing data by multiple industries such as advertising and marketing, agriculture, consumer packaged goods, education, financial services, food and beverage, etc. Through this statistics marketers can develop email marketing campaign goals based on the industry. Create an editable Average Email Marketing Statistics By Different Industries Ppt PowerPoint Presentation File Slides PDF that communicates your idea and engages your audience. Whether youre presenting a business or an educational presentation, pre designed presentation templates help save time. Average Email Marketing Statistics By Different Industries Ppt PowerPoint Presentation File Slides PDF is highly customizable and very easy to edit, covering many different styles from creative to business presentations. Slidegeeks has creative team members who have crafted amazing templates. So, go and get them without any delay.
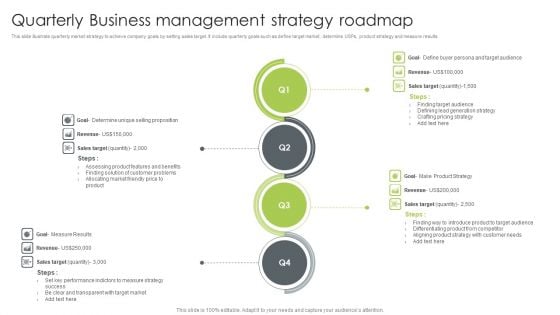
Quarterly Business Management Strategy Roadmap Mockup PDF
This slide illustrate quarterly market strategy to achieve company goals by setting sales target. It include quarterly goals such as define target market, determine USPs, product strategy and measure results. Persuade your audience using this Quarterly Business Management Strategy Roadmap Mockup PDF. This PPT design covers four stages, thus making it a great tool to use. It also caters to a variety of topics including Revenue, Goal, Sales Target. Download this PPT design now to present a convincing pitch that not only emphasizes the topic but also showcases your presentation skills.
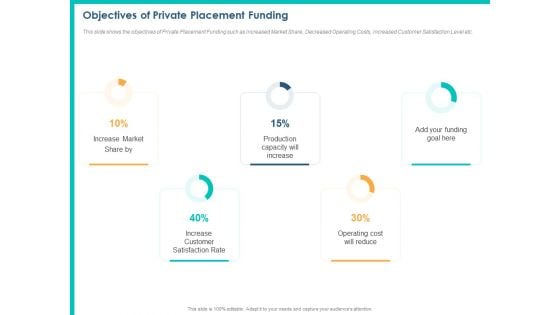
PPM Private Equity Objectives Of Private Placement Funding Ppt PowerPoint Presentation Portfolio Slide Portrait PDF
This slide shows the objectives of Private Placement Funding such as Increased Market Share, Decreased Operating Costs, Increased Customer Satisfaction Level etc. This is a ppm private equity objectives of private placement funding ppt powerpoint presentation portfolio slide portrait pdf template with various stages. Focus and dispense information on five stages using this creative set, that comes with editable features. It contains large content boxes to add your information on topics like increase market share, production capacity increase, funding goal , increase customer satisfaction rate, operating cost reduce. You can also showcase facts, figures, and other relevant content using this PPT layout. Grab it now.
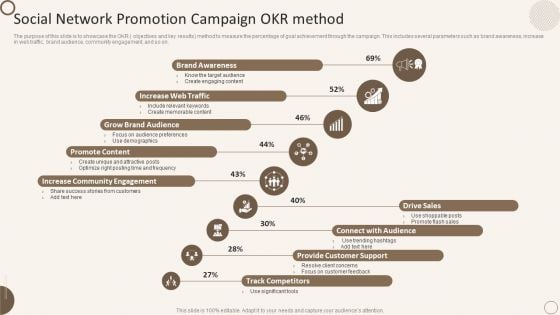
Social Network Promotion Campaign Okr Method Ppt Model Graphics Template PDF
The purpose of this slide is to showcase the OKR objectives and key results method to measure the percentage of goal achievement through the campaign. This includes several parameters such as brand awareness, increase in web traffic, brand audience, community engagement, and so on. Presenting Social Network Promotion Campaign Okr Method Ppt Model Graphics Template PDF to dispense important information. This template comprises nine stages. It also presents valuable insights into the topics including Promote Content, Brand Awareness, Increase Web Traffic. This is a completely customizable PowerPoint theme that can be put to use immediately. So, download it and address the topic impactfully.
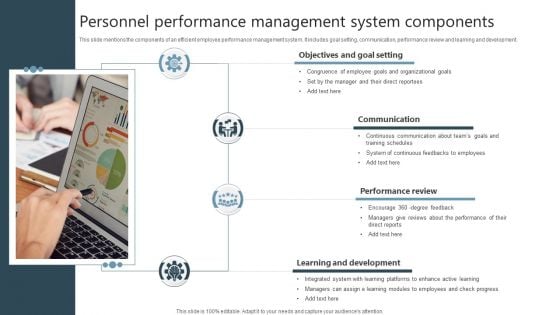
Personnel Performance Management System Components Designs PDF
This slide mentions the components of an efficient employee performance management system. It includes goal setting, communication, performance review and learning and development. Persuade your audience using this Personnel Performance Management System Components Designs PDF. This PPT design covers four stages, thus making it a great tool to use. It also caters to a variety of topics including Communication, Performance Review, Learning And Development. Download this PPT design now to present a convincing pitch that not only emphasizes the topic but also showcases your presentation skills.
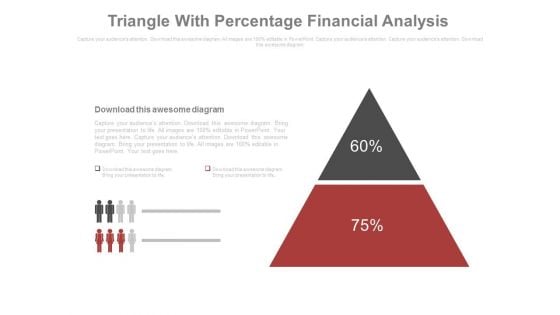
Triangle With Two Segments And Percentage Values Powerpoint Slides
This PowerPoint template contains graphics of triangle with two segments and percentage values. You may use this PPT slide for financial planning. The color coding of this template is specifically designed to highlight you points.
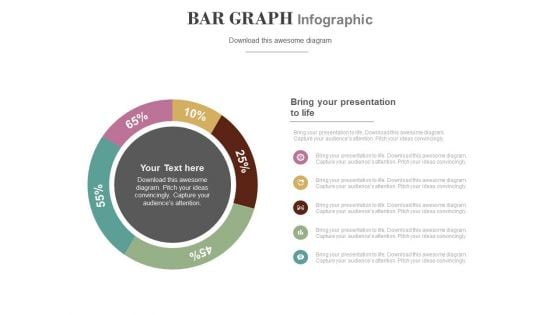
Circle Chart With Percentage Value Analysis Powerpoint Slides
This PowerPoint template has been designed with circular process diagram. This business diagram helps to exhibit financial process control and analysis. Use this diagram to visually support your content.
Market Trends Chart With Percentage And Icons Powerpoint Slides
This PowerPoint template has been designed with graphics of chart with percentage values and icons. This PowerPoint template may be used to market trends and financial analysis. Prove the viability of your ideas using this impressive slide.
Bar Chart Ppt PowerPoint Presentation Icon Demonstration
This is a bar chart ppt powerpoint presentation icon demonstration. This is a seven stage process. The stages in this process are product, sales in percentage, financial year, graph.
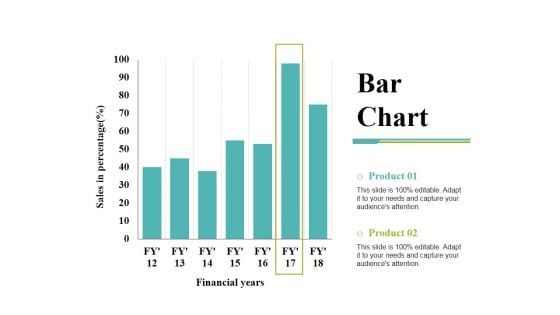
Bar Chart Ppt PowerPoint Presentation Inspiration Demonstration
This is a bar chart ppt powerpoint presentation inspiration demonstration. This is a two stage process. The stages in this process are bar chart, financial years, sales in percentage, product, finance.
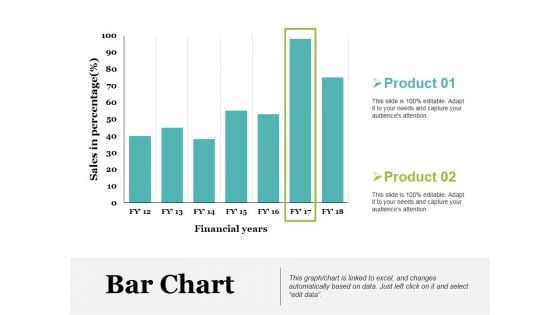
Bar Chart Ppt PowerPoint Presentation Model Picture
This is a bar chart ppt powerpoint presentation model picture. This is a two stage process. The stages in this process are product, sales in percentage, financial years, bar chart.
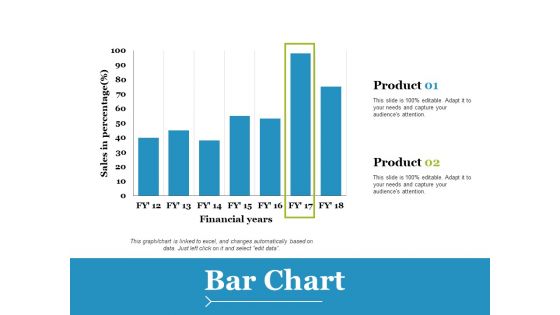
Bar Chart Ppt PowerPoint Presentation Slides Example File
This is a bar chart ppt powerpoint presentation slides example file. This is a two stage process. The stages in this process are product, financial years, sales in percentage.
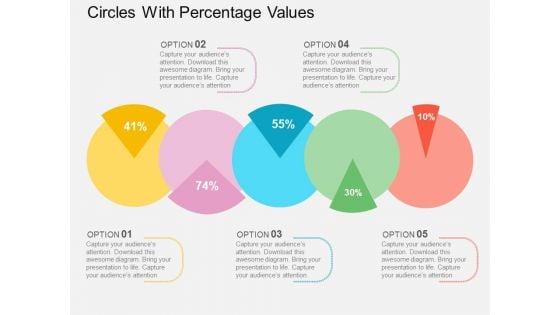
Circles With Percentage Values Powerpoint Templates
This PowerPoint template displays circles with percentage values. This business diagram is suitable for financial data analysis. Use this business diagram slide to highlight the key issues of your presentation.
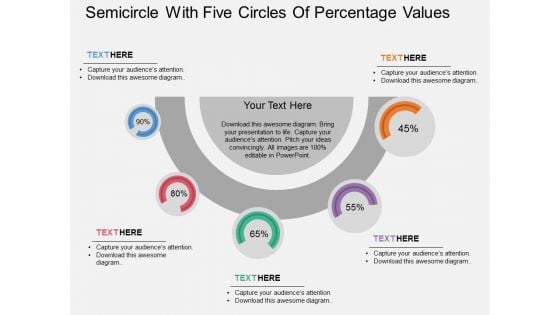
Semicircle With Five Circles Of Percentage Values Powerpoint Template
This PowerPoint template has been designed with graphics of semicircle with five percentage values. This business design can be used for financial ratio analysis. Capture the attention of your audience with this slide.
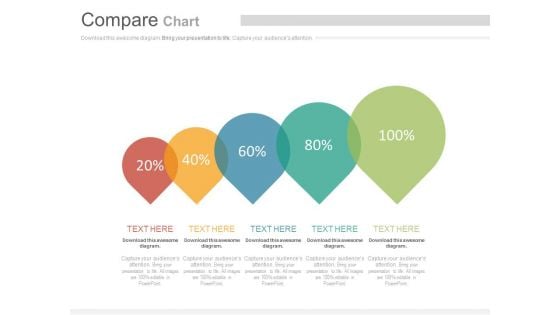
Balloons Steps With Percentage Growth Values Powerpoint Slides
This PowerPoint template contains graphics of balloons steps with percentage growth values. You may download this slide to display strategy steps for financial growth. You can easily customize this template to make it more unique as per your need.

Three Square Tags With Dollars Value Powerpoint Slides
This PowerPoint template contains three square tags with dollar value. You may download this PPT slide design to display financial analysis. You can easily customize this template to make it more unique as per your need.
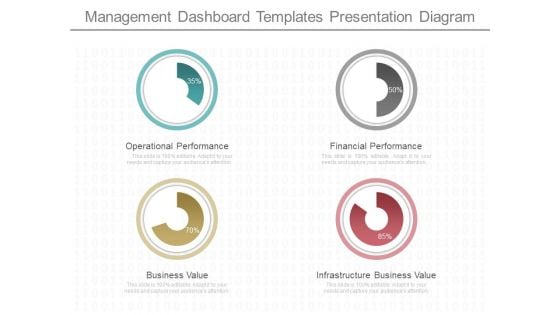
Management Dashboard Templates Presentation Diagram
This is a management dashboard templates presentation diagram. This is a four stage process. The stages in this process are operational performance, business value, financial performance, infrastructure business value.
Clustered Column Ppt PowerPoint Presentation Icon Design Inspiration
This is a clustered column ppt powerpoint presentation icon design inspiration. This is a two stage process. The stages in this process are product, financial year, sales in percentage, clustered column.
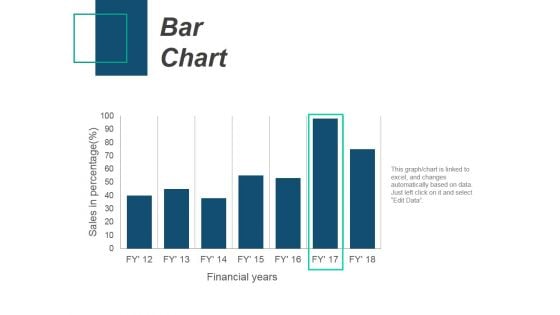
Bar Chart Ppt PowerPoint Presentation Professional Files
This is a bar chart ppt powerpoint presentation professional files. This is a seven stage process. The stages in this process are bar chart, product, sales in percentage, financial years.
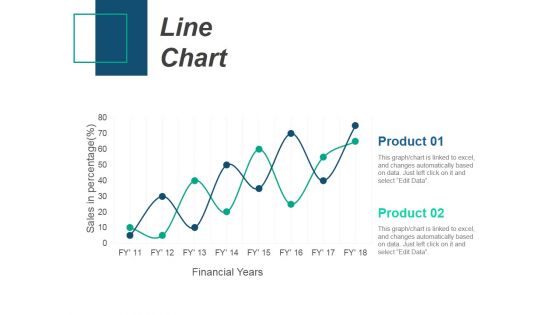
Line Chart Ppt PowerPoint Presentation Infographic Template Introduction
This is a line chart ppt powerpoint presentation infographic template introduction. This is a two stage process. The stages in this process are product, sales in percentage, financial years, line chart.
Line Chart Ppt PowerPoint Presentation Infographic Template Icons
This is a line chart ppt powerpoint presentation infographic template icons. This is a two stage process. The stages in this process are sales in percentage, financial years, product, line chart.
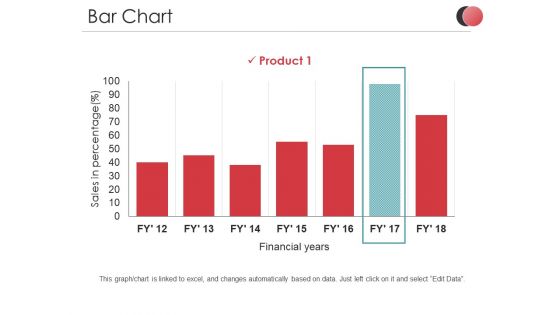
Bar Chart Ppt PowerPoint Presentation Outline Introduction
This is a bar chart ppt powerpoint presentation outline introduction. This is a one stage process. The stages in this process are sales in percentage, product, business, financial years, graph.
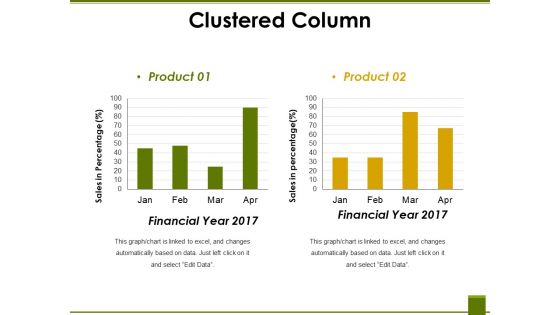
Clustered Column Ppt PowerPoint Presentation Ideas Graphic Tips
This is a clustered column ppt powerpoint presentation ideas graphic tips. This is a two stage process. The stages in this process are financial year, sales in percentage, product, graph, business.
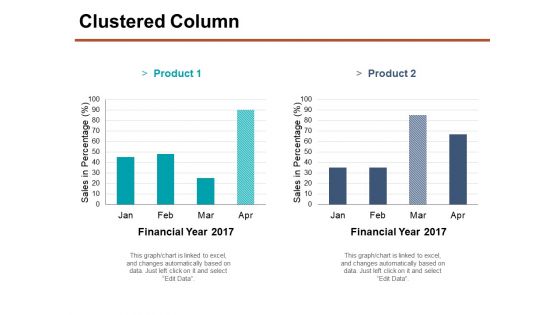
Clustered Column Ppt PowerPoint Presentation Portfolio Smartart
This is a clustered column ppt powerpoint presentation portfolio smartart. This is a two stage process. The stages in this process are financial year, product, sales in percentage, finance, business, graph.
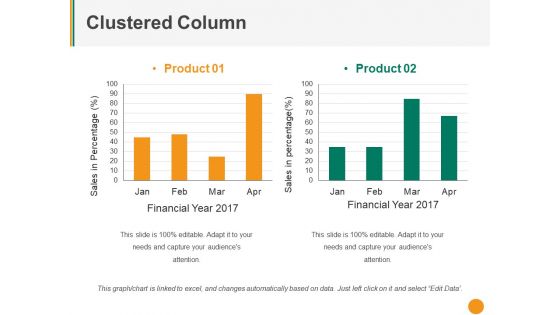
Clustered Column Ppt PowerPoint Presentation Pictures Mockup
This is a clustered column ppt powerpoint presentation pictures mockup. This is a two stage process. The stages in this process are product, sales in percentage, financial year, graph, business.
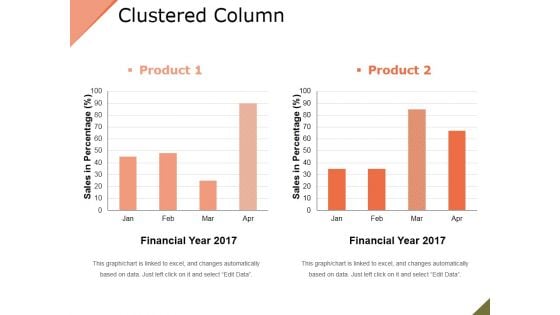
Clustered Column Ppt PowerPoint Presentation File Slide
This is a clustered column ppt powerpoint presentation file slide. This is a two stage process. The stages in this process are product, financial year, sales in percentage, bar graph.
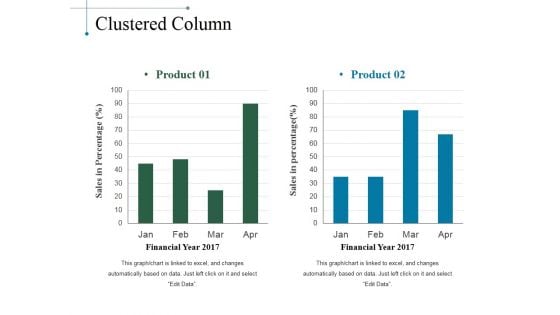
Clustered Column Ppt PowerPoint Presentation Slides Smartart
This is a clustered column ppt powerpoint presentation slides smartart. This is a two stage process. The stages in this process are product, sales in percentage, financial year, bar graph.
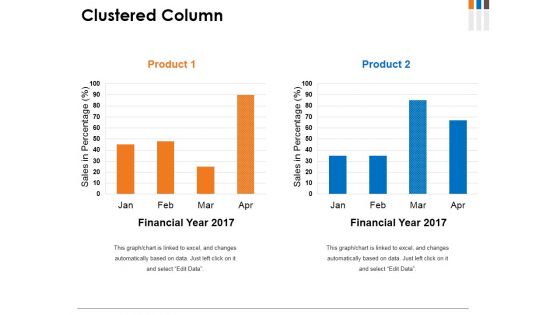
Clustered Column Ppt PowerPoint Presentation File Graphics
This is a clustered column ppt powerpoint presentation file graphics. This is a two stage process. The stages in this process are product, financial year, sales in percentage, graph, growth.
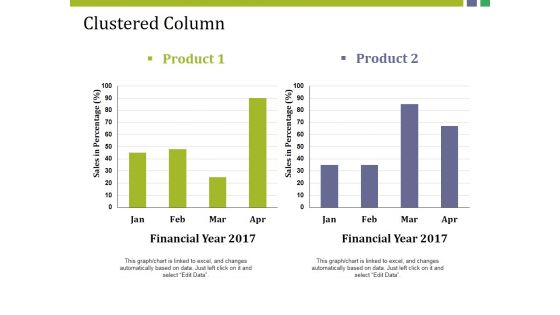
Clustered Column Ppt PowerPoint Presentation Gallery Structure
This is a clustered column ppt powerpoint presentation gallery structure. This is a two stage process. The stages in this process are product, sales in percentage, financial year, bar graph, finance.


 Continue with Email

 Home
Home


