Financial Goals

Client Testimonials Ppt PowerPoint Presentation Slides Objects
This is a client testimonials ppt powerpoint presentation slides objects. This is a two stage process. The stages in this process are john doe, julie star, ceo, financial advisor.
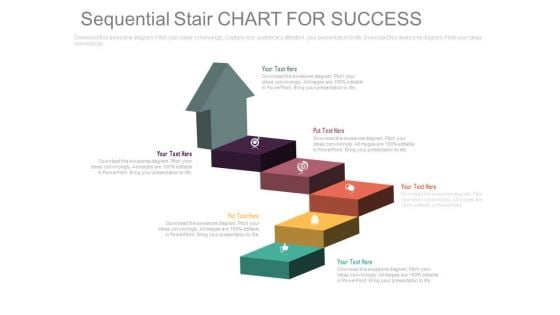
Arrow Steps Chart For Business Success Powerpoint Template
This PowerPoint template has been designed with graphics of arrow steps chart. Download this slide for planning of financial targets. Grab the attention of your listeners with this PPT slide.
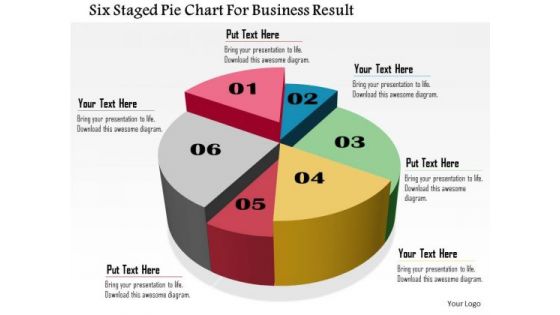
Business Daigram Six Staged Pie Chart For Business Result Presentation Templets
Six staged pie chart is used to design this business slide. Download this diagram to make business and financial reports. Use our above diagram to express information in a visual way.
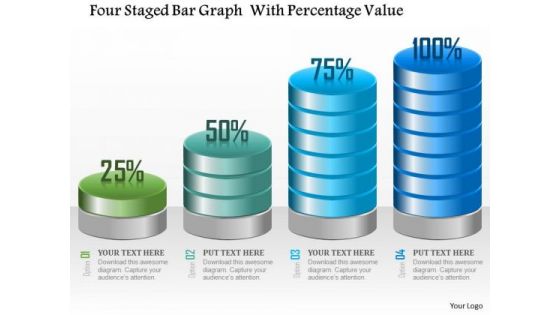
Business Diagram Four Staged Bar Graph With Percentage Value Presentation Template
Four staged bar graph with percentage value has been used to craft this power point template. This PPT contains the concept of making financial timeline and result analysis. This PPT can be used for business and finance related presentations.
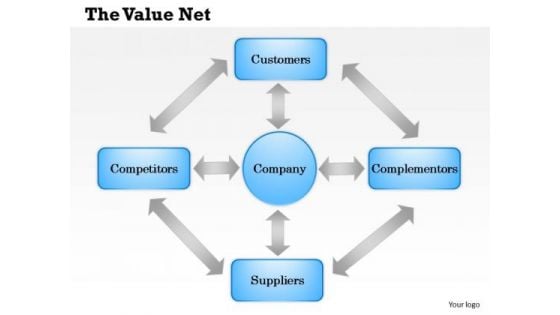
Business Framework The Value Net PowerPoint Presentation
This business power point diagram template has been designed with graphic of multiple staged. This diagram template can be used for value net calculation display in any financial and business presentations.
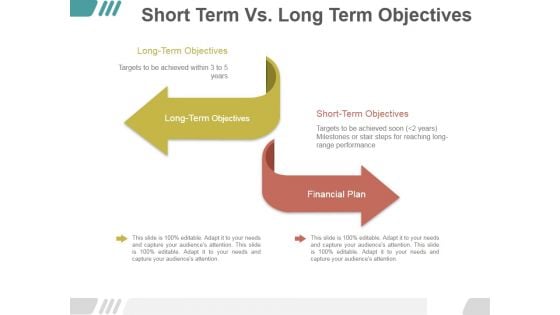
Short Term Vs Long Term Objectives Ppt PowerPoint Presentation Influencers
This is a short term vs long term objectives ppt powerpoint presentation influencers. This is a two stage process. The stages in this process are long term objectives, financial plan, short term objectives, long term objectives.
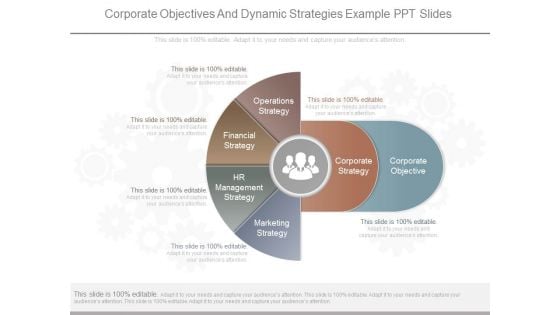
Corporate Objectives And Dynamic Strategies Example Ppt Slides
This is a corporate objectives and dynamic strategies example ppt slides. This is a six stage process. The stages in this process are operations strategy, financial strategy, hr management strategy, marketing strategy, corporate strategy, corporate objective.
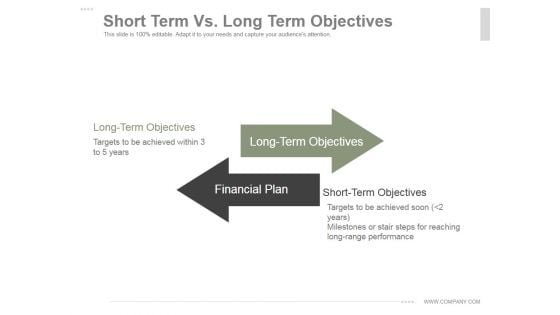
Short Term Vs Long Term Objectives Ppt PowerPoint Presentation Clipart
This is a short term vs long term objectives ppt powerpoint presentation clipart. This is a two stage process. The stages in this process are long term objectives, financial plan.
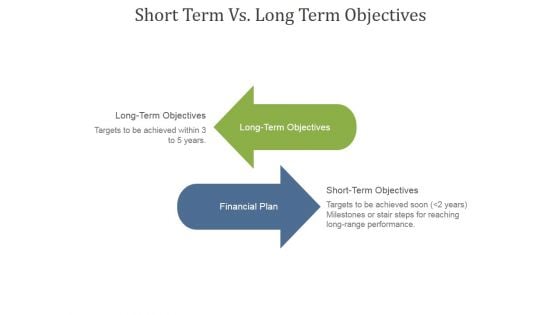
Short Term Vs Long Term Objectives Ppt PowerPoint Presentation Graphics
This is a short term vs long term objectives ppt powerpoint presentation graphics. This is a two stage process. The stages in this process are long term objectives, financial plan.
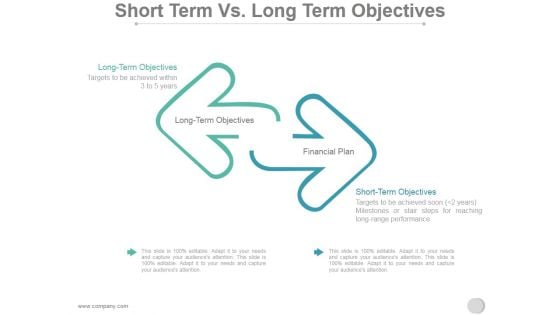
Short Term Vs Long Term Objectives Ppt PowerPoint Presentation Styles
This is a short term vs long term objectives ppt powerpoint presentation styles. This is a two stage process. The stages in this process are long term objectives, financial plan.
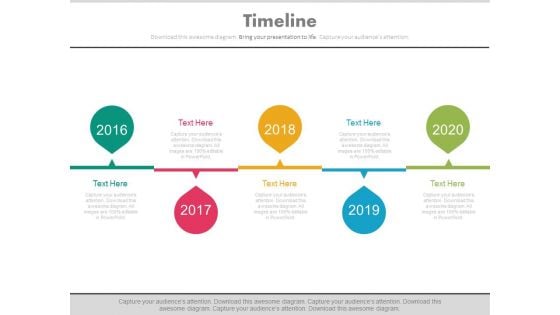
Linear Timeline For Specific Organizational Objectives Powerpoint Slides
This PowerPoint timeline template can be used for specific organizational objectives. This PPT slide may be helpful to display financial strategy timeline. Download this PowerPoint timeline template to make impressive presentations.
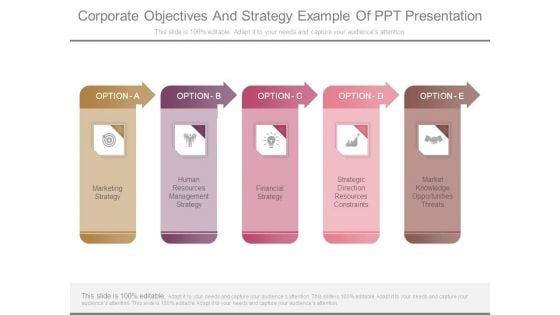
Corporate Objectives And Strategy Example Of Ppt Presentation
This is a corporate objectives and strategy example of ppt presentation. This is a five stage process. The stages in this process are marketing strategy, human resources management strategy, financial strategy, strategic direction resources constraints, market knowledge opportunities threats.
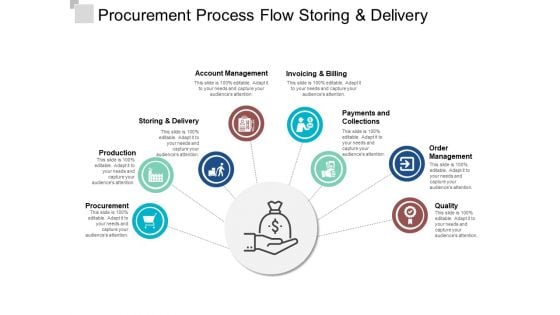
Procurement Process Flow Storing And Delivery Ppt PowerPoint Presentation Outline Objects
This is a procurement process flow storing and delivery ppt powerpoint presentation outline objects. This is a eight stage process. The stages in this process are financial capital, working capital management, companys managerial accounting.
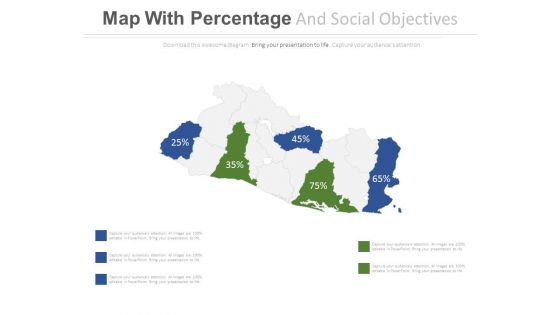
Map With Highlighted Areas And Percentage Values Powerpoint Slides
This PowerPoint template displays map diagram with highlighted areas and percentage values. You may use this PPT slide to exhibit area wise financial growth. Download this PowerPoint map diagram to build impressive presentations.
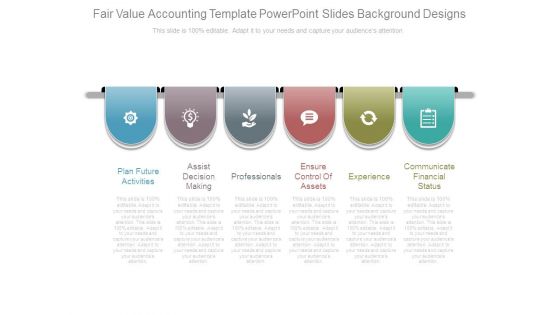
Fair Value Accounting Template Powerpoint Slides Background Designs
This is a fair value accounting template powerpoint slides background designs. This is a six stage process. The stages in this process are plan future activities, assist decision making, professionals, ensure control of assets, experience, communicate financial status.
Four Circles With Percentage Values And Icons Powerpoint Slides
This PowerPoint template displays info graphic diagram of linear circles. This diagram may be used to exhibit financial growth and analysis. Grab center stage with this slide and capture the attention of your audience.
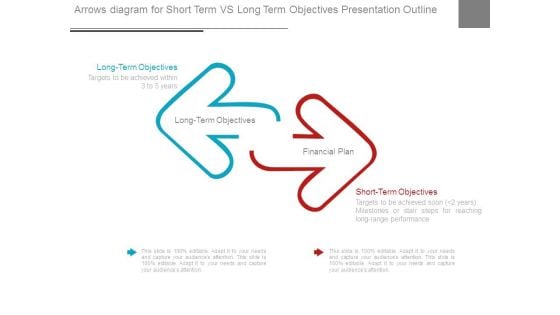
Arrows Diagram For Short Term Vs Long Term Objectives Presentation Outline
This is a arrows diagram for short term vs long term objectives presentation outline. This is a two stage process. The stages in this process are long term objectives, financial plan, short term objectives.

Short Term Vs Long Term Objectives Ppt PowerPoint Presentation Background Image
This is a short term vs long term objectives ppt powerpoint presentation background image. This is a two stage process. The stages in this process are long term objectives, financial plan.
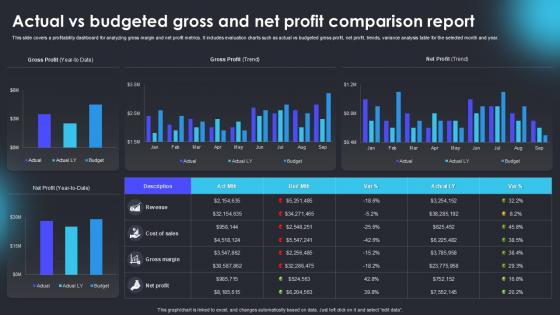
Actual Vs Budgeted Gross And Net Profit Comparison Report
Boost your pitch with our creative Actual Vs Budgeted Gross And Net Profit Comparison Report. Deliver an awe-inspiring pitch that will mesmerize everyone. Using these presentation templates you will surely catch everyones attention. You can browse the ppts collection on our website. We have researchers who are experts at creating the right content for the templates. So you do not have to invest time in any additional work. Just grab the template now and use them. This PowerPoint template is designed to present a detailed comparison between actual financial performance and budgeted projections for gross and net profit. It includes charts, graphs, and tables to effectively illustrate variances, percentage differences, and key financial insights. The template helps in identifying discrepancies, evaluating financial strategies, and guiding corrective measures. Ideal for finance professionals, analysts, and business executives for quarterly, annual, or project-based financial reviews.
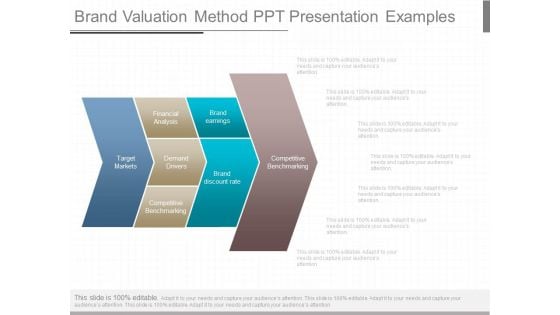
Brand Valuation Method Ppt Presentation Examples
This is a brand valuation method ppt presentation examples. This is a four stage process. The stages in this process are target markets, financial analysis, demand drivers, competitive benchmarking, brand earnings, brand discount rate, competitive benchmarking.
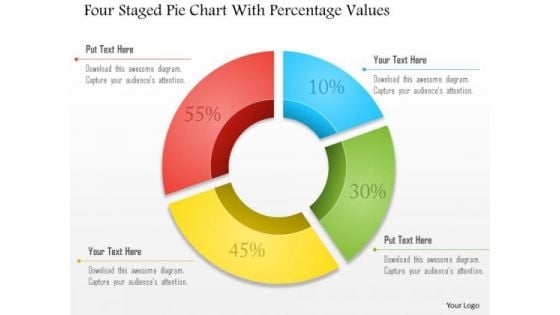
Business Diagram Four Staged Pie Chart With Percentage Values Presentation Template
Four staged pie chart and percentage values are used to design this business slide. Download this diagram to make business and financial reports. Use our above diagram to express information in a visual way.
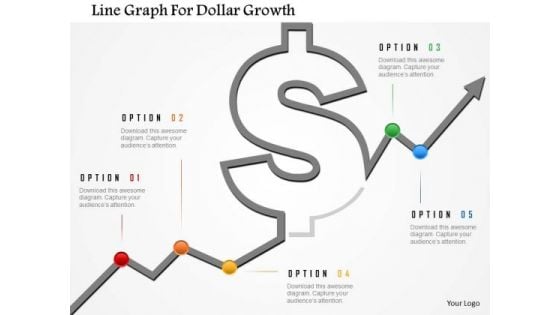
Business Diagram Line Graph For Dollar Growth Presentation Template
Graphic of dollar symbol and growth arrow has been used to design this power point template. This diagram contains the concept of financial result analysis. Use this business diagram for finance related presentations
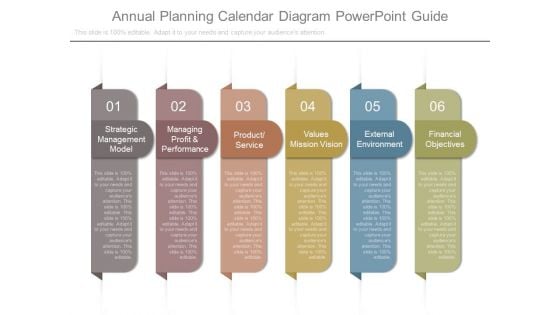
Annual Planning Calendar Diagram Powerpoint Guide
This is a annual planning calendar diagram powerpoint guide. This is a six stage process. The stages in this process are strategic management model, managing profit and performance, product service, values mission vision, external environment, financial objectives.
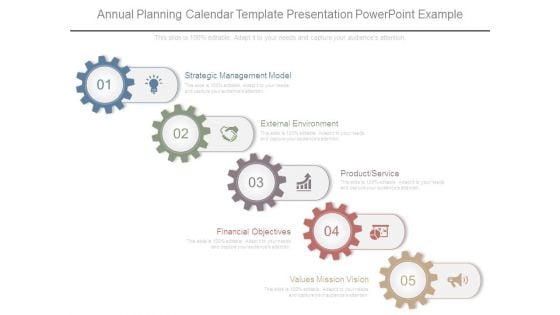
Annual Planning Calendar Template Presentation Powerpoint Example
This is a annual planning calendar template presentation powerpoint example. This is a five stage process. The stages in this process are strategic management model, external environment, product service, financial objectives, values mission vision.
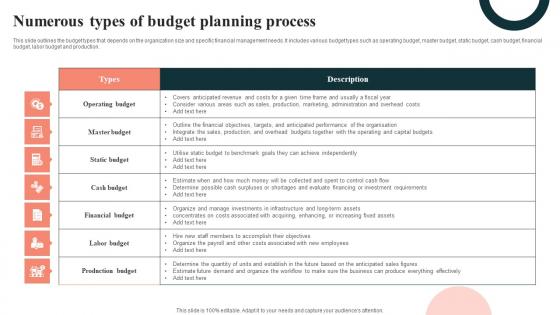
Numerous Types Of Budget Planning Process Slides Pdf
This slide outlines the budget types that depends on the organization size and specific financial management needs. It includes various budget types such as operating budget, master budget, static budget, cash budget, financial budget, labor budget and production. Pitch your topic with ease and precision using this Numerous Types Of Budget Planning Process Slides Pdf. This layout presents information on Operating Budget, Master Budget, Static Budget. It is also available for immediate download and adjustment. So, changes can be made in the color, design, graphics or any other component to create a unique layout. This slide outlines the budget types that depends on the organization size and specific financial management needs. It includes various budget types such as operating budget, master budget, static budget, cash budget, financial budget, labor budget and production.
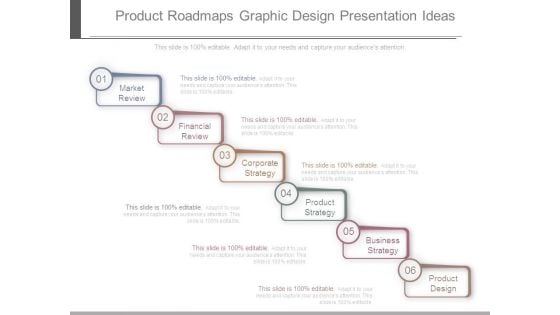
Product Roadmaps Graphic Design Presentation Ideas
This is a product roadmaps graphic design presentation ideas. This is a six stage process. The stages in this process are market review, financial review, corporate strategy, product strategy, business strategy, product design.
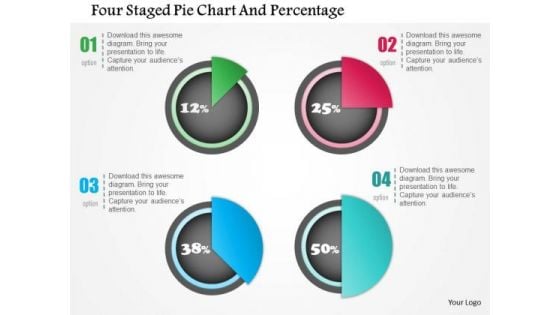
Business Diagram Four Staged Pie Chart And Percentage Presentation Template
Four staged pie chart and percentage values has been used to design this power point template. This PPT contains the concept of financial result analysis. Use this PPT for business and marketing related presentations.

Business Chart Finance PowerPoint Templates And PowerPoint Backgrounds 0211
Microsoft PowerPoint Template and Background with business chart shows financial success at the stock market Our Business Chart Finance PowerPoint Templates And PowerPoint Backgrounds 0211 will benefit your Ideas. They will deliver better dividends.
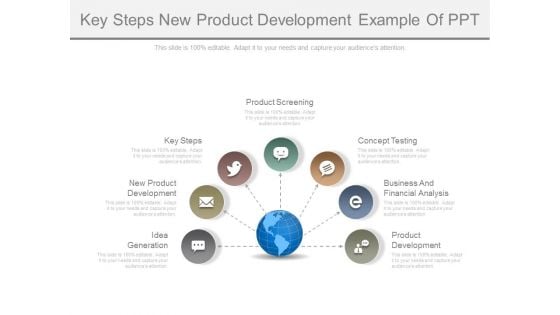
Key Steps New Product Development Example Of Ppt
This is a key steps new product development example of ppt. This is a seven stage process. The stages in this process are idea generation, new product development, key steps, product screening, concept testing, business and financial analysis, product development.
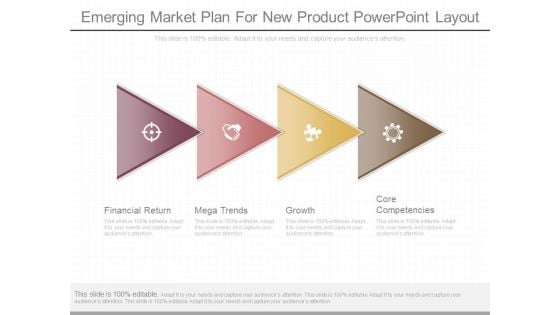
Emerging Market Plan For New Product Powerpoint Layout
This is a emerging market plan for new product powerpoint layout. This is a four stage process. The stages in this process are financial return, mega trends, growth, core competencies.
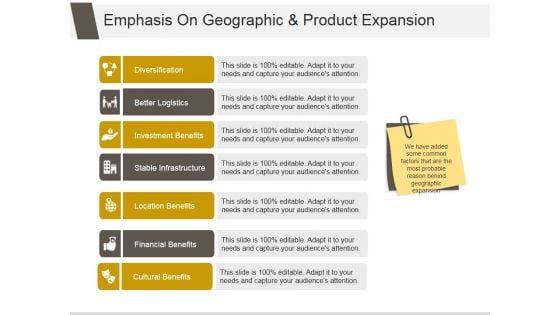
Emphasis On Geographic And Product Expansion Ppt PowerPoint Presentation Templates
This is a emphasis on geographic and product expansion ppt powerpoint presentation templates. This is a seven stage process. The stages in this process are diversification, better logistics, investment benefits, stable infrastructure, location benefits, financial benefits, cultural benefits.
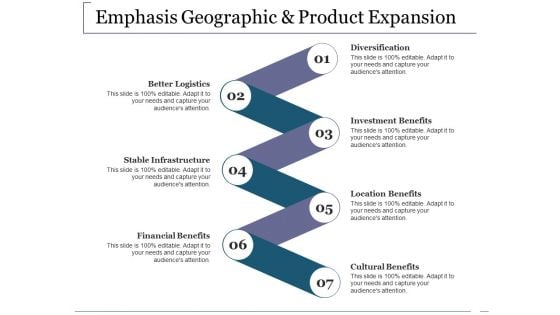
Emphasis Geographic And Product Expansion Ppt PowerPoint Presentation Inspiration Good
This is a emphasis geographic and product expansion ppt powerpoint presentation inspiration good. This is a seven stage process. The stages in this process are better logistics, stable infrastructure, financial benefits, diversification, investment benefits.
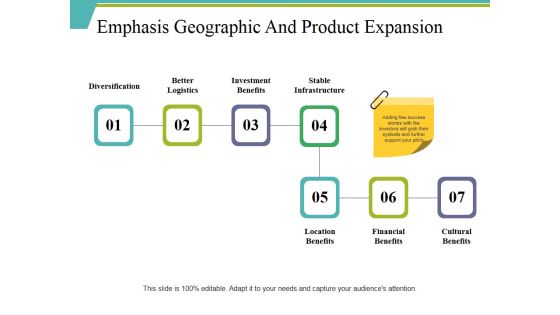
Emphasis Geographic And Product Expansion Ppt PowerPoint Presentation Gallery Rules
This is a emphasis geographic and product expansion ppt powerpoint presentation gallery rules. This is a seven stage process. The stages in this process are diversification, investment benefits, stable infrastructure, financial benefits, cultural benefits.
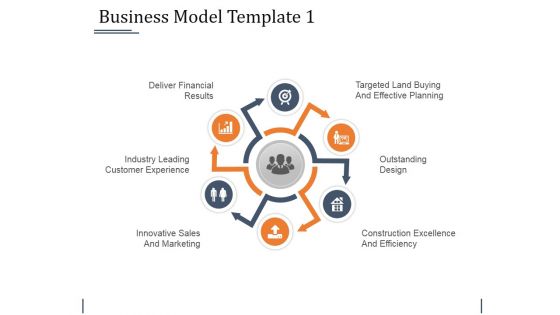
Business Model Template 1 Ppt PowerPoint Presentation Infographic Template File Formats
This is a business model template 1 ppt powerpoint presentation infographic template file formats. This is a six stage process. The stages in this process are outstanding design, deliver financial results, industry leading customer experience, innovative sales and marketing.

Basic Money Management Illustration Powerpoint Graphics
This is a basic money management illustration powerpoint graphics. This is a five stage process. The stages in this process are understanding money, selecting financial products suitable for you, understanding yourself, your rights and responsibilities, planning ahead, managing everyday money.
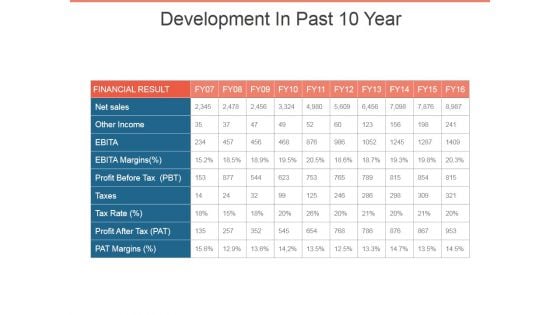
Development In Past 10 Year Template 2 Ppt PowerPoint Presentation Infographic Template Example
This is a development in past 10 year template 2 ppt powerpoint presentation infographic template example. This is a ten stage process. The stages in this process are other income, net sales, ebita margins, taxes, financial result.
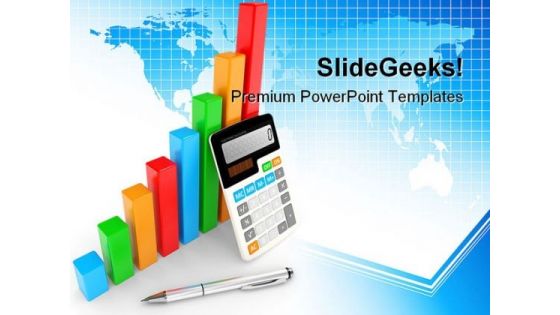
Business Chart Showing Finance PowerPoint Templates And PowerPoint Backgrounds 0411
Microsoft PowerPoint Template and Background with business chart showing financial success objects Deliver your ideas decisively with our Business Chart Showing Finance PowerPoint Templates And PowerPoint Backgrounds 0411. They help you look the audience in the eye.
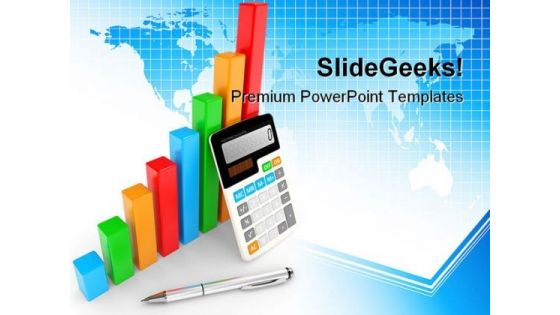
Business Chart Showing Finance PowerPoint Themes And PowerPoint Slides 0411
Microsoft PowerPoint Theme and Slide with business chart showing financial success objects Take care of your organizationwith our Business Chart Showing Finance PowerPoint Themes And PowerPoint Slides 0411. You'll deliver your best presentation yet.
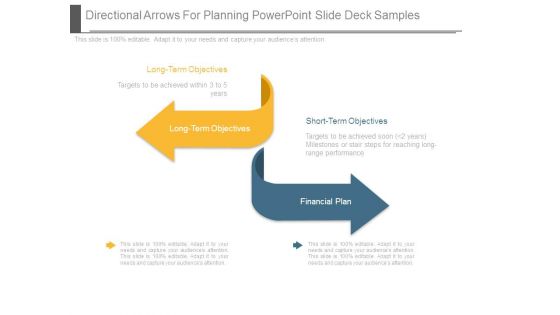
Directional Arrows For Planning Powerpoint Slide Deck Samples
This is a directional arrows for planning powerpoint slide deck samples. This is a two stage process. The stages in this process are long term objectives, short term objectives, financial plan.
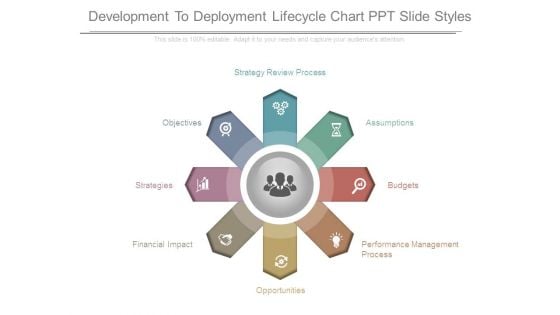
Development To Deployment Lifecycle Chart Ppt Slide Styles
This is a development to deployment lifecycle chart ppt slide styles. This is a eight stage process. The stages in this process are performance management process, opportunities, financial impact, strategies, objectives, strategy review process, assumptions, budgets.

Emphasis On Geographic And Product Expansion Ppt Powerpoint Presentation Outline Samples
This is a emphasis on geographic and product expansion ppt powerpoint presentation outline samples. This is a seven stage process. The stages in this process are better logistics, stable infrastructure, financial benefits.
Emphasis On Geographic And Product Expansion Ppt PowerPoint Presentation Icon Mockup
This is a emphasis on geographic and product expansion ppt powerpoint presentation icon mockup. This is a seven stage process. The stages in this process are investment benefits, better logistics, diversification, stable infrastructure, location benefits, financial benefits, cultural benefits.

Outline Overview Ppt Powerpoint Presentation Summary Graphics Design
This is a outline overview ppt powerpoint presentation summary graphics design. This is a two stage process. The stages in this process are financial instruments, time value of money, cash flow, fixed capital analysis, inventory management, commodity exchange.
Jobs Burning People PowerPoint Template 0910
Burning word job as a result of the financial crisis. Count on our Jobs Burning People PowerPoint Template 0910 to carry the can. They will never belie your faith.
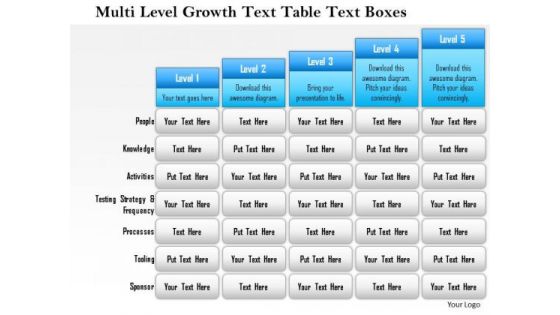
Business Framework Multi Level Growth Text Table Text Boxes 2 PowerPoint Presentation
Five staged text box style chart in bar graph design has been used to decorate this power point template slide. This diagram slide contains the multilevel growth concept. Use this PPT slide for financial growth and result analysis related topics.
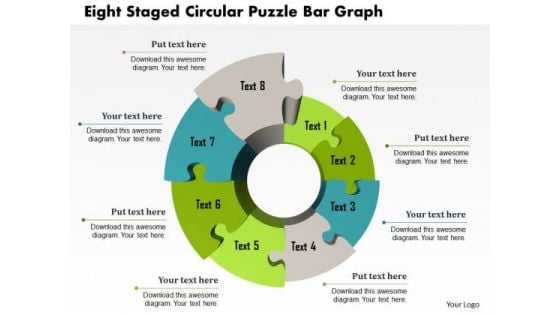
Business Diagram Eight Staged Circular Puzzle Bar Graph Presentation Template
This Power Point template has been crafted with graphic of eight staged circular puzzle and bar graph. This PPT contains the financial result analysis related concept. Use this PPT for your business and success related presentations.
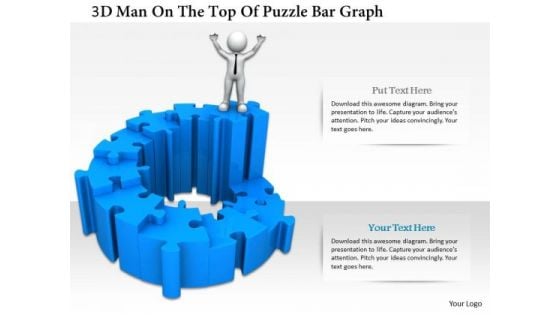
3d Man On The Top Of Puzzle Bar Graph
This PPT has been designed with graphic of 3d man and puzzle are graph. This PPT displays the concept of result analysis and financial growth. Use this PPT for your business and finance related presentations.

Knowledge Management Process Model Ppt Slides
This is a knowledge management process model ppt slides. This is a six stage process. The stages in this process are knowledge manager, reports dashboard, metrics manager, financial tracker, resource manager, project tracker, result, strategy, execution.
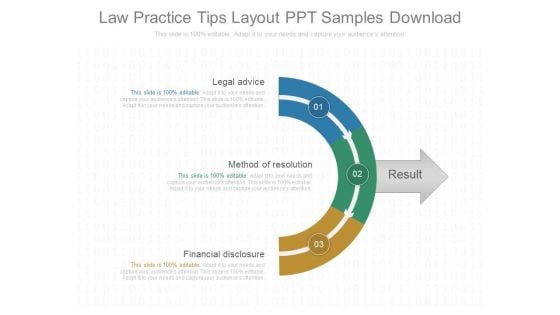
Law Practice Tips Layout Ppt Samples Download
This is a law practice tips layout ppt samples download. This is a three stage process. The stages in this process are legal advice, method of resolution, financial disclosure, result.
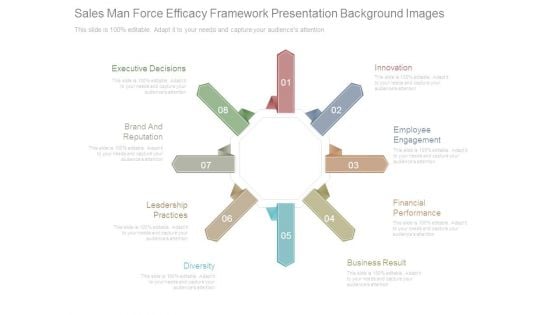
Sales Man Force Efficacy Framework Presentation Background Images
This is a sales man force efficacy framework presentation background images. This is a eight stage process. The stages in this process are innovation, employee engagement, financial performance, business result, diversity, leadership practices, brand and reputation, executive decisions.
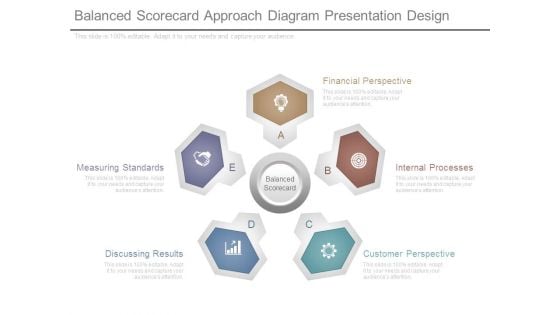
Balanced Scorecard Approach Diagram Presentation Design
This is a balanced scorecard approach diagram presentation design. This is a five stage process. The stages in this process are measuring standards, discussing results, customer perspective, internal processes, financial perspective, balanced scorecard.
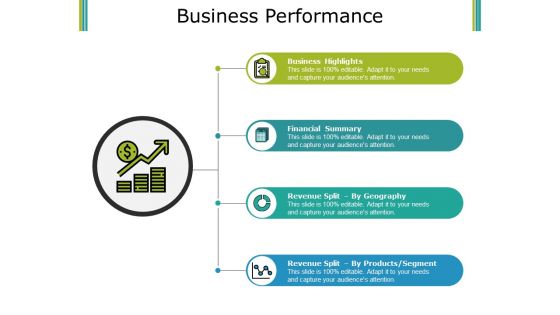
Business Performance Ppt PowerPoint Presentation File Graphics
This is a business performance ppt powerpoint presentation file graphics. This is a four stage process. The stages in this process are business highlights, financial summary, revenue split by geography, revenue split by products.
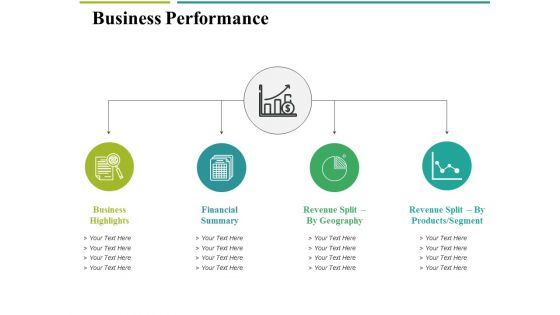
Business Performance Ppt PowerPoint Presentation Professional Visual Aids
This is a business performance ppt powerpoint presentation professional visual aids. This is a four stage process. The stages in this process are business, business highlights, financial summary, revenue split by geography, revenue split by products segment.
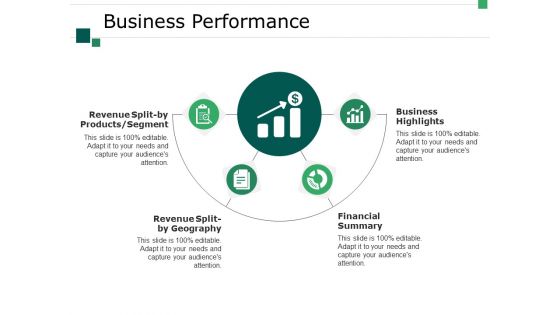
Business Performance Ppt PowerPoint Presentation Inspiration Examples
This is a business performance ppt powerpoint presentation inspiration examples. This is a four stage process. The stages in this process are business, revenue split by geography, financial summary, business highlights, revenue split by products segment.
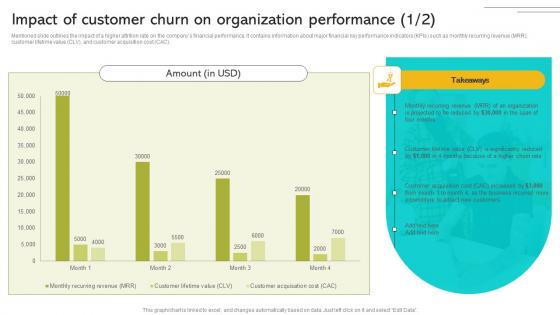
Implementing Strategies To Enhance Impact Of Customer Churn On Organization Performance Infographics PDF
Mentioned slide outlines the impact of a higher attrition rate on the companys financial performance. It contains information about major financial key performance indicators KPIs such as monthly recurring revenue MRR, customer lifetime value CLV, and customer acquisition cost CAC. Make sure to capture your audiences attention in your business displays with our gratis customizable Implementing Strategies To Enhance Impact Of Customer Churn On Organization Performance Infographics PDF These are great for business strategies, office conferences, capital raising or task suggestions. If you desire to acquire more customers for your tech business and ensure they stay satisfied, create your own sales presentation with these plain slides. Mentioned slide outlines the impact of a higher attrition rate on the companys financial performance. It contains information about major financial key performance indicators KPIs such as monthly recurring revenue MRR, customer lifetime value CLV, and customer acquisition cost CAC.
Business Chart Showing Finance PowerPoint Presentation Slides C
Microsoft Powerpoint Slides and Backgrounds with business chart showing financial success. objects on a white Your customer is the center of it all. Our Business Chart Showing Finance PowerPoint Presentation Slides C will concentrate on him.
Business Chart Showing Finance PowerPoint Presentation Slides Cc
Microsoft Powerpoint Slides and Backgrounds with business chart showing financial success. objects on a white Get rid of all fetters with our Business Chart Showing Finance PowerPoint Presentation Slides Cc. Clear all the blockades with your ideas.
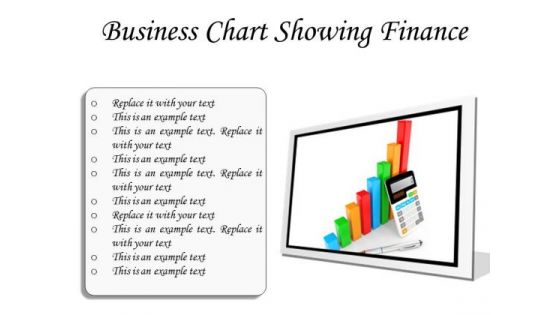
Business Chart Showing Finance PowerPoint Presentation Slides F
Microsoft Powerpoint Slides and Backgrounds with business chart showing financial success. objects on a white Add to your exhibition with our Business Chart Showing Finance PowerPoint Presentation Slides F. Your audience will find it cool.
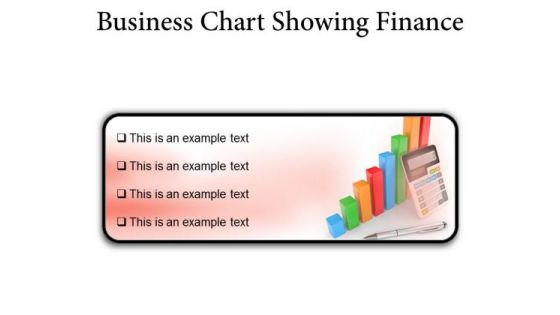
Business Chart Showing Finance PowerPoint Presentation Slides R
Microsoft Powerpoint Slides and Backgrounds with business chart showing financial success. objects on a white Put your team out to field with our Business Chart Showing Finance PowerPoint Presentation Slides R. They will catch everything you throw at them.

Business Chart Showing Finance PowerPoint Presentation Slides S
Microsoft Powerpoint Slides and Backgrounds with business chart showing financial success. objects on a white Our Business Chart Showing Finance PowerPoint Presentation Slides S don't fiddle with facts. They are fearlessly factual.


 Continue with Email

 Home
Home


