Financial Graphs
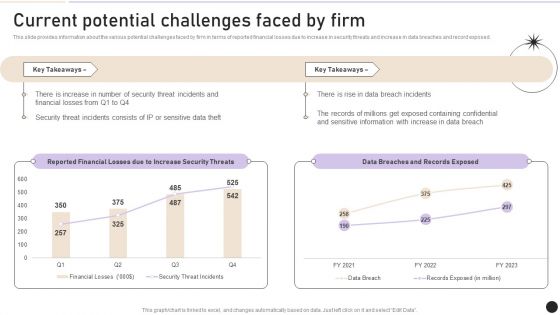
Current Potential Challenges Faced By Firm Topics PDF
This slide provides information about the various potential challenges faced by firm in terms of reported financial losses due to increase in security threats and increase in data breaches and record exposed. Want to ace your presentation in front of a live audience Our Current Potential Challenges Faced By Firm Topics PDF can help you do that by engaging all the users towards you. Slidegeeks experts have put their efforts and expertise into creating these impeccable powerpoint presentations so that you can communicate your ideas clearly. Moreover, all the templates are customizable, and easy to edit and downloadable. Use these for both personal and commercial use.
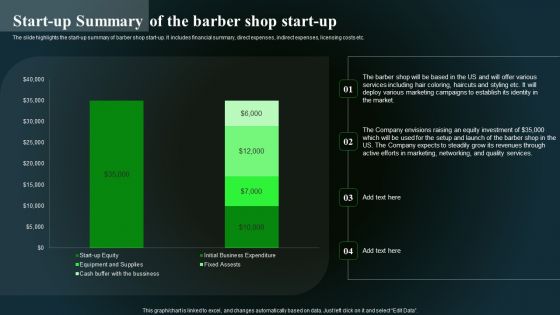
Start Up Summary Of The Barber Shop Start Up Slides PDF
The slide highlights the start-up summary of barber shop start-up. It includes financial summary, direct expenses, indirect expenses, licensing costs etc. From laying roadmaps to briefing everything in detail, our templates are perfect for you. You can set the stage with your presentation slides. All you have to do is download these easy to edit and customizable templates. Start Up Summary Of The Barber Shop Start Up Slides PDF will help you deliver an outstanding performance that everyone would remember and praise you for. Do download this presentation today.
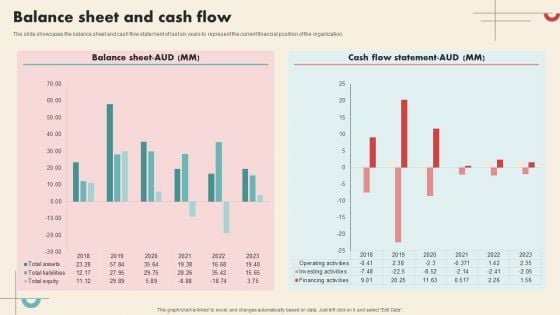
Data Driven Marketing Solutions Firm Company Profile Balance Sheet And Cash Flow Guidelines PDF
The slide showcases the balance sheet and cash flow statement of last six years to represent the current financial position of the organization. Boost your pitch with our creative Data Driven Marketing Solutions Firm Company Profile Balance Sheet And Cash Flow Guidelines PDF. Deliver an awe-inspiring pitch that will mesmerize everyone. Using these presentation templates you will surely catch everyones attention. You can browse the ppts collection on our website. We have researchers who are experts at creating the right content for the templates. So you do not have to invest time in any additional work. Just grab the template now and use them.
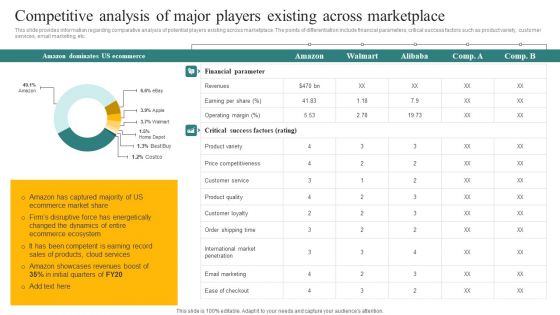
Competitive Analysis Of Major Players Existing Across Marketplace Ppt File Graphics Design PDF
This slide provides information regarding comparative analysis of potential players existing across marketplace. The points of differentiation include financial parameters, critical success factors such as product variety, customer services, email marketing, etc. Boost your pitch with our creative Competitive Analysis Of Major Players Existing Across Marketplace Ppt File Graphics Design PDF. Deliver an awe inspiring pitch that will mesmerize everyone. Using these presentation templates you will surely catch everyones attention. You can browse the ppts collection on our website. We have researchers who are experts at creating the right content for the templates. So you do not have to invest time in any additional work. Just grab the template now and use them.
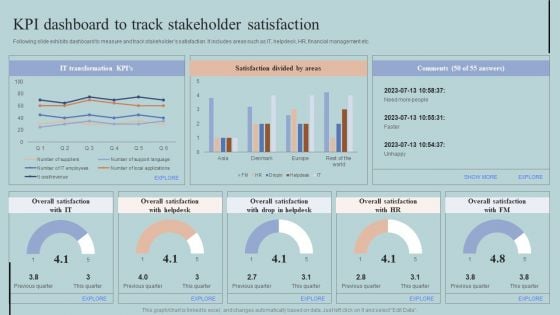
KPI Dashboard To Track Stakeholder Satisfaction Structure PDF
Following slide exhibits dashboard to measure and track stakeholders satisfaction. It includes areas such as IT, helpdesk, HR, financial management etc. The best PPT templates are a great way to save time, energy, and resources. Slidegeeks have 100 percent editable powerpoint slides making them incredibly versatile. With these quality presentation templates, you can create a captivating and memorable presentation by combining visually appealing slides and effectively communicating your message. Download KPI Dashboard To Track Stakeholder Satisfaction Structure PDF from Slidegeeks and deliver a wonderful presentation.
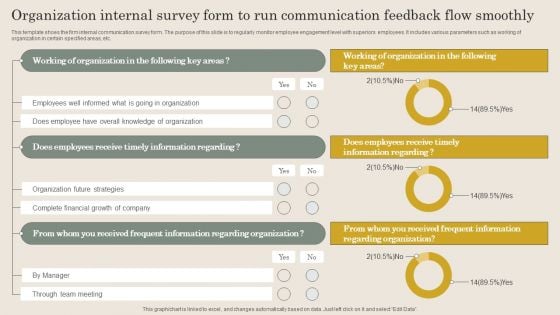
Organization Internal Survey Form To Run Communication Feedback Flow Smoothly Introduction PDF
This template shoes the firm internal communication survey form. The purpose of this slide is to regularly monitor employee engagement level with superiors employees. It includes various parameters such as working of organization in certain specified areas, etc. Showcasing this set of slides titled Organization Internal Survey Form To Run Communication Feedback Flow Smoothly Introduction PDF. The topics addressed in these templates are Employees Receive, Frequent Information Regarding, Financial Growth Company. All the content presented in this PPT design is completely editable. Download it and make adjustments in color, background, font etc. as per your unique business setting.
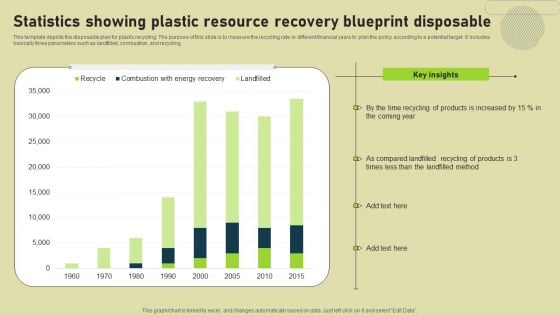
Statistics Showing Plastic Resource Recovery Blueprint Disposable Elements PDF
This template depicts the disposable plan for plastic recycling. The purpose of this slide is to measure the recycling rate in different financial years to plan the policy according to a potential target. It includes basically three parameters such as landfilled, combustion, and recycling. Pitch your topic with ease and precision using this Statistics Showing Plastic Resource Recovery Blueprint Disposable Elements PDF. This layout presents information on Products, Key Insights, Resource Recovery Blueprint Disposable. It is also available for immediate download and adjustment. So, changes can be made in the color, design, graphics or any other component to create a unique layout.
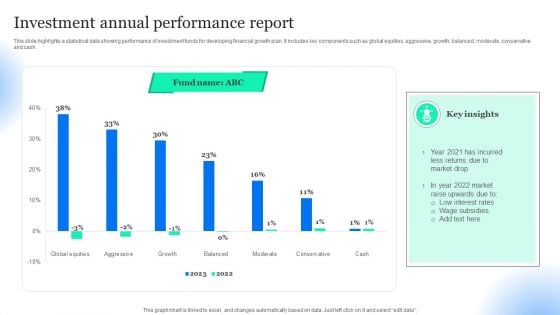
Investment Annual Performance Report Pictures PDF
This slide highlights a statistical data showing performance of investment funds for developing financial growth plan. It includes key components such as global equities, aggressive, growth, balanced, moderate, conservative and cash. Pitch your topic with ease and precision using this Investment Annual Performance Report Pictures PDF. This layout presents information on Low Interest Rates, Wage Subsidies, Returns Due Market Drop. It is also available for immediate download and adjustment. So, changes can be made in the color, design, graphics or any other component to create a unique layout.
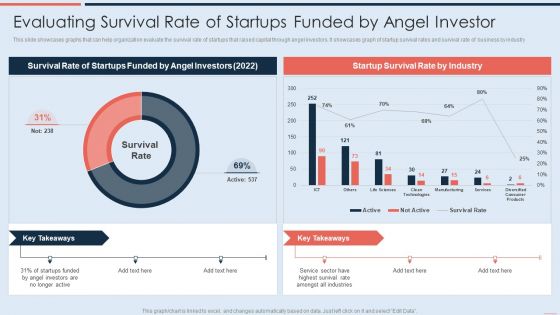
Evaluating Survival Rate Of Startups Funded By Angel Investor Mockup PDF
This slide showcases graphs that can help organization evaluate the survival rate of startups that raised capital through angel investors. It showcases graph of startup survival rates and survival rate of business by industry Deliver and pitch your topic in the best possible manner with this Evaluating Survival Rate Of Startups Funded By Angel Investor Mockup PDF. Use them to share invaluable insights on Survival Rate, Service, Angel Investors and impress your audience. This template can be altered and modified as per your expectations. So, grab it now.
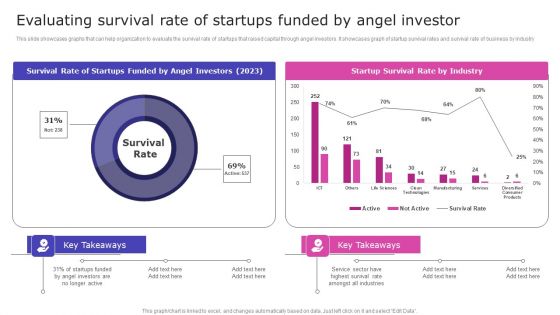
Evaluating Survival Rate Of Startups Funded By Angel Investor Microsoft PDF
This slide showcases graphs that can help organization to evaluate the survival rate of startups that raised capital through angel investors. It showcases graph of startup survival rates and survival rate of business by industry. Boost your pitch with our creative Evaluating Survival Rate Of Startups Funded By Angel Investor Microsoft PDF. Deliver an awe-inspiring pitch that will mesmerize everyone. Using these presentation templates you will surely catch everyones attention. You can browse the ppts collection on our website. We have researchers who are experts at creating the right content for the templates. So you do not have to invest time in any additional work. Just grab the template now and use them.
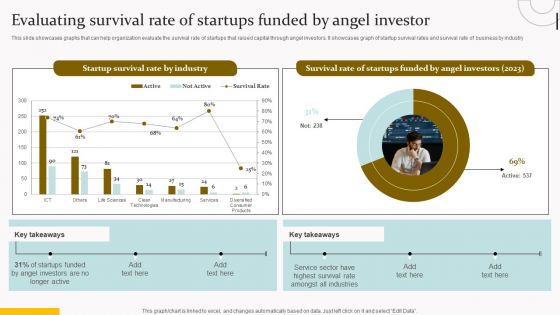
Evaluating Survival Rate Of Startups Funded By Angel Investor Topics PDF
This slide showcases graphs that can help organization evaluate the survival rate of startups that raised capital through angel investors. It showcases graph of startup survival rates and survival rate of business by industry. Want to ace your presentation in front of a live audience Our Evaluating Survival Rate Of Startups Funded By Angel Investor Topics PDF can help you do that by engaging all the users towards you. Slidegeeks experts have put their efforts and expertise into creating these impeccable powerpoint presentations so that you can communicate your ideas clearly. Moreover, all the templates are customizable, and easy to edit and downloadable. Use these for both personal and commercial use.
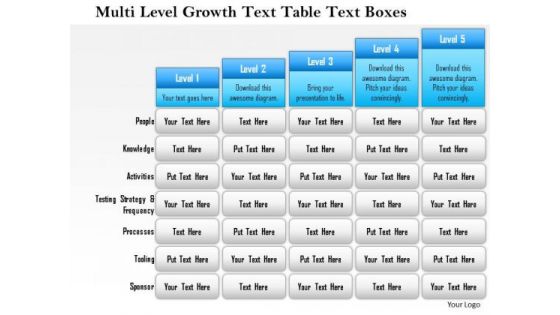
Business Framework Multi Level Growth Text Table Text Boxes 2 PowerPoint Presentation
Five staged text box style chart in bar graph design has been used to decorate this power point template slide. This diagram slide contains the multilevel growth concept. Use this PPT slide for financial growth and result analysis related topics.
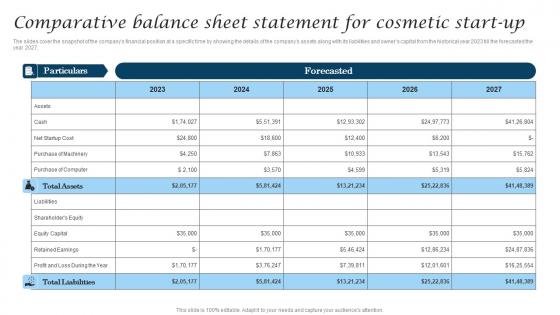
Comparative Balance Sheet Statement For Cosmetic Industry Business Information Pdf
The slides cover the snapshot of the companys financial position at a specific time by showing the details of the companys assets along with its liabilities and owners capital from the historical year 2023 till the forecasted the year 2027. Get a simple yet stunning designed Comparative Balance Sheet Statement For Cosmetic Industry Business Information Pdf. It is the best one to establish the tone in your meetings. It is an excellent way to make your presentations highly effective. So, download this PPT today from Slidegeeks and see the positive impacts. Our easy-to-edit Comparative Balance Sheet Statement For Cosmetic Industry Business Information Pdf can be your go-to option for all upcoming conferences and meetings. So, what are you waiting for Grab this template today. The slides cover the snapshot of the companys financial position at a specific time by showing the details of the companys assets along with its liabilities and owners capital from the historical year 2023 till the forecasted the year 2027.
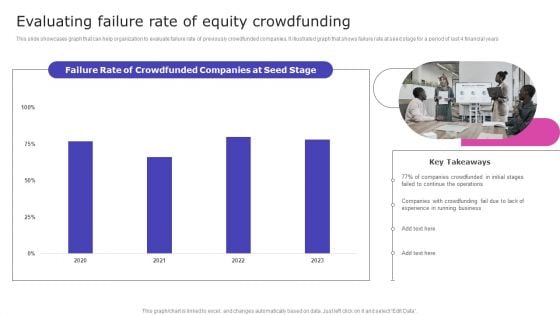
Strategic Fund Acquisition Plan For Business Opertions Expansion Evaluating Failure Rate Of Equity Crowdfunding Information PDF
This slide showcases graph that can help organization to evaluate failure rate of previously crowdfunded companies. It illustrated graph that shows failure rate at seed stage for a period of last 4 financial years. Slidegeeks is one of the best resources for PowerPoint templates. You can download easily and regulate Strategic Fund Acquisition Plan For Business Opertions Expansion Evaluating Failure Rate Of Equity Crowdfunding Information PDF for your personal presentations from our wonderful collection. A few clicks is all it takes to discover and get the most relevant and appropriate templates. Use our Templates to add a unique zing and appeal to your presentation and meetings. All the slides are easy to edit and you can use them even for advertisement purposes.
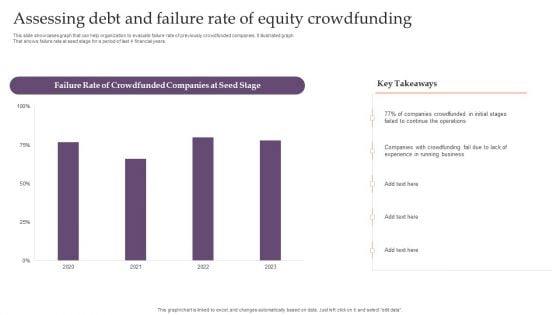
Assessing Debt And Equity Fundraising Alternatives For Business Growth Assessing Debt And Failure Rate Pictures PDF
This slide showcases graph that can help organization to evaluate failure rate of previously crowdfunded companies. It illustrated graph That shows failure rate at seed stage for a period of last 4 financial years. Here you can discover an assortment of the finest PowerPoint and Google Slides templates. With these templates, you can create presentations for a variety of purposes while simultaneously providing your audience with an eye catching visual experience. Download Assessing Debt And Equity Fundraising Alternatives For Business Growth Assessing Debt And Failure Rate Pictures PDF to deliver an impeccable presentation. These templates will make your job of preparing presentations much quicker, yet still, maintain a high level of quality. Slidegeeks has experienced researchers who prepare these templates and write high quality content for you. Later on, you can personalize the content by editing the Assessing Debt And Equity Fundraising Alternatives For Business Growth Assessing Debt And Failure Rate Pictures PDF.
Clustered Column Ppt PowerPoint Presentation Icon Design Inspiration
This is a clustered column ppt powerpoint presentation icon design inspiration. This is a two stage process. The stages in this process are product, financial year, sales in percentage, clustered column.
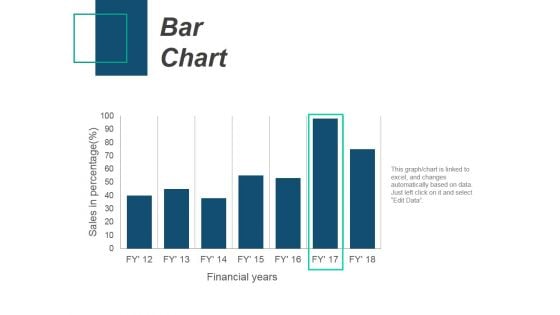
Bar Chart Ppt PowerPoint Presentation Professional Files
This is a bar chart ppt powerpoint presentation professional files. This is a seven stage process. The stages in this process are bar chart, product, sales in percentage, financial years.
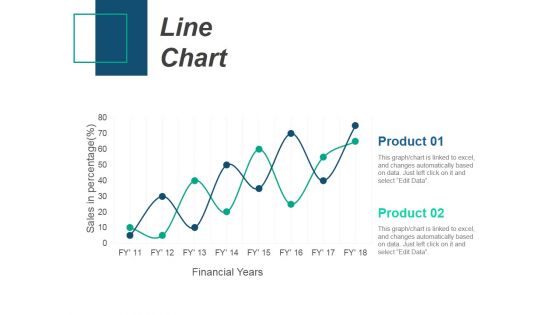
Line Chart Ppt PowerPoint Presentation Infographic Template Introduction
This is a line chart ppt powerpoint presentation infographic template introduction. This is a two stage process. The stages in this process are product, sales in percentage, financial years, line chart.
Line Chart Ppt PowerPoint Presentation Infographic Template Icons
This is a line chart ppt powerpoint presentation infographic template icons. This is a two stage process. The stages in this process are sales in percentage, financial years, product, line chart.
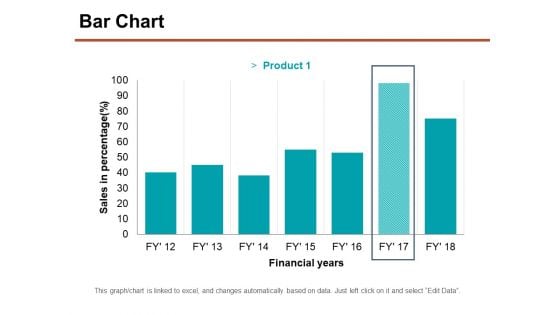
Bar Chart Ppt PowerPoint Presentation Professional Graphics Download
This is a bar chart ppt powerpoint presentation professional graphics download. This is a seven stage process. The stages in this process are sales in percentage, financial years, chart, business.
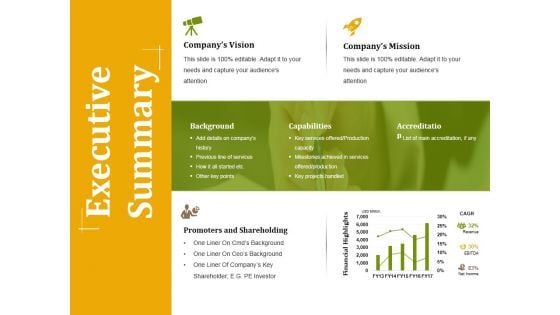
Executive Summary Ppt PowerPoint Presentation Professional Example
This is a executive summary ppt powerpoint presentation professional example. This is a four stage process. The stages in this process are background, capabilities, accreditation, promoters and shareholding, financial highlights.
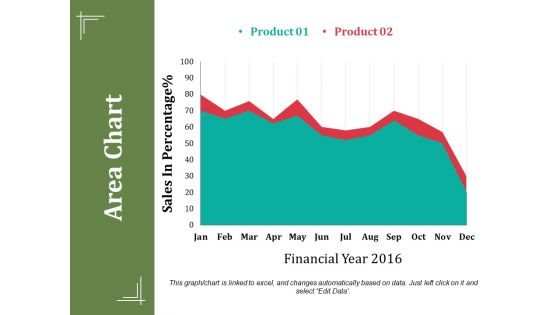
Area Chart Ppt PowerPoint Presentation Summary Show
This is a area chart ppt powerpoint presentation summary show. This is a two stage process. The stages in this process are sales in percentage, financial year, business, marketing, finance.
Bar Chart Ppt PowerPoint Presentation Icon Layout
This is a bar chart ppt powerpoint presentation icon layout. This is a one stage process. The stages in this process are sales in percentage, financial years, bar chart, finance, marketing.
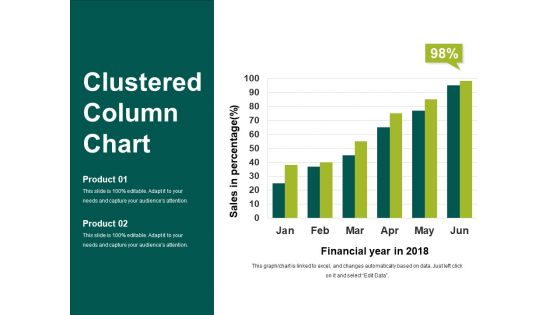
Clustered Column Chart Ppt PowerPoint Presentation Show Slideshow
This is a clustered column chart ppt powerpoint presentation show slideshow. This is a six stage process. The stages in this process are financial year in, sales in percentage, business, marketing, finance.
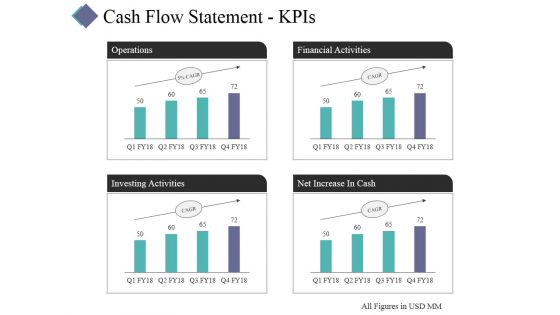
Cash Flow Statement Kpis Template 2 Ppt PowerPoint Presentation Layouts Visuals
This is a cash flow statement kpis template 2 ppt powerpoint presentation layouts visuals. This is a four stage process. The stages in this process are operations, financial activities, investing activities, net increase in cash.
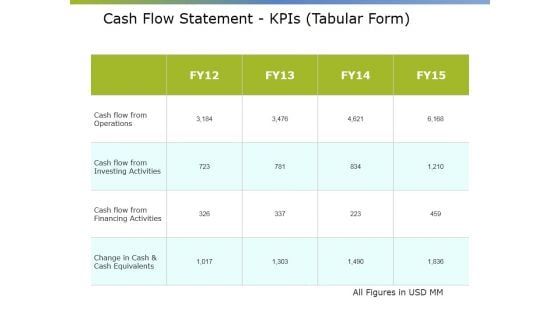
Cash Flow Statement Kpis Tabular Form Ppt PowerPoint Presentation Summary Elements
This is a cash flow statement kpis tabular form ppt powerpoint presentation summary elements. This is a four stage process. The stages in this process are net increase cash, financial activities, operations, investing activities.
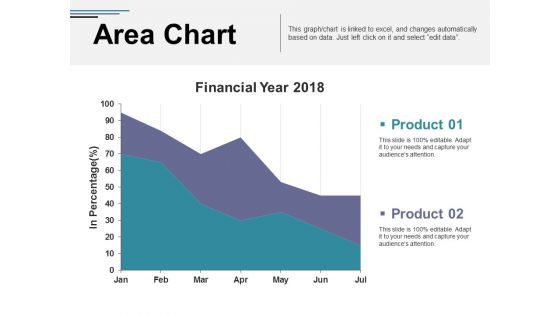
Area Chart Ppt PowerPoint Presentation Inspiration Professional
This is a area chart ppt powerpoint presentation inspiration professional. This is a two stage process. The stages in this process are financial year, in percentage, area chart, finance, business, marketing.
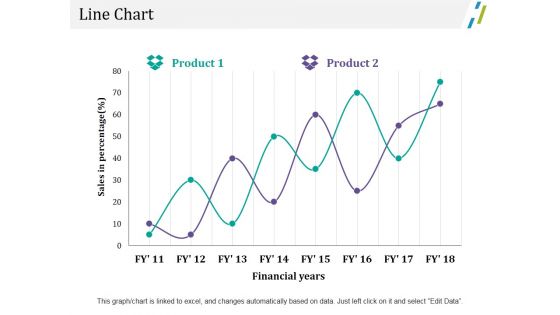
Line Chart Ppt PowerPoint Presentation Outline File Formats
This is a line chart ppt powerpoint presentation outline file formats. This is a two stage process. The stages in this process are business, marketing, sales in percentage, financial years, chart.
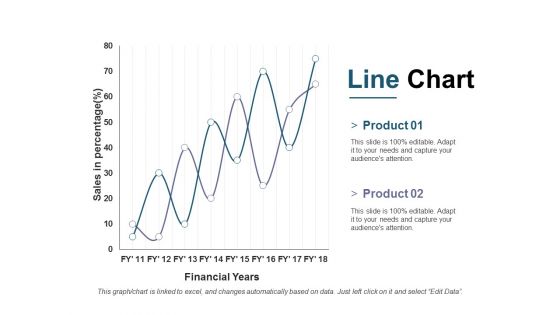
Line Chart Ppt PowerPoint Presentation Outline Ideas
This is a line chart ppt powerpoint presentation outline ideas. This is a two stage process. The stages in this process are business, marketing, financial years, sales in percentage, strategy.
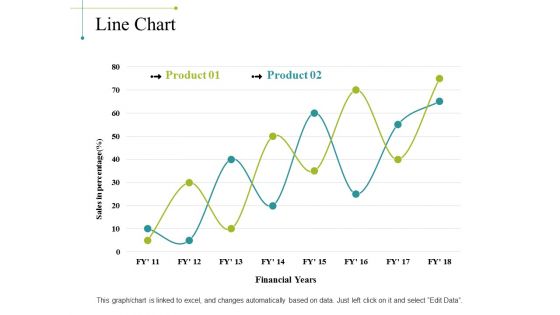
Line Chart Ppt PowerPoint Presentation Portfolio Background Image
This is a line chart ppt powerpoint presentation portfolio background image. This is a two stage process. The stages in this process are sales in percentage, financial years, chart, business, marketing, finance.
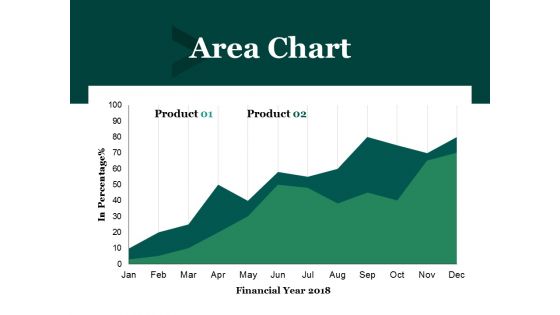
Area Chart Ppt PowerPoint Presentation Outline Graphics Pictures
This is a area chart ppt powerpoint presentation outline graphics pictures. This is a two stage process. The stages in this process are financial year, in percentage, business, marketing, finance.
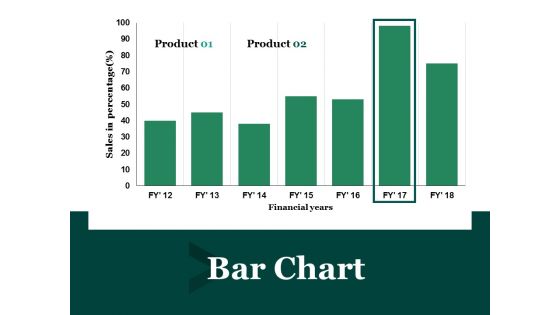
Bar Chart Ppt PowerPoint Presentation Layouts Template
This is a bar chart ppt powerpoint presentation layouts template. This is a two stage process. The stages in this process are financial year, sales in percentage, business, marketing, finance.
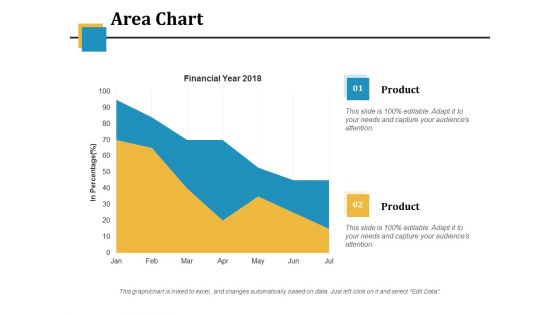
Area Chart Ppt PowerPoint Presentation Model Inspiration
This is a area chart ppt powerpoint presentation model inspiration. This is a two stage process. The stages in this process are financial year, in percentage, area chart, business, marketing.
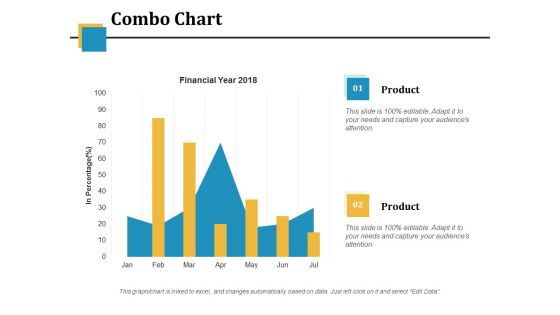
Combo Chart Ppt PowerPoint Presentation Model Vector
This is a combo chart ppt powerpoint presentation model vector. This is a two stage process. The stages in this process are financial year, in percentage, business, marketing, combo chart.
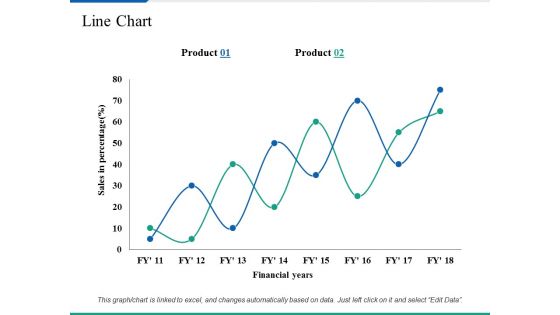
Line Chart Ppt PowerPoint Presentation Summary Clipart Images
This is a line chart ppt powerpoint presentation summary clipart images. This is a two stage process. The stages in this process are business, marketing, sales in percentage, financial years, strategy.
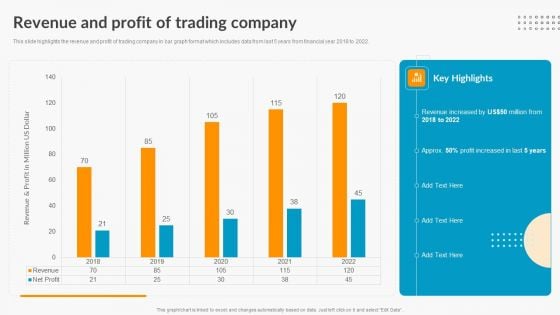
Revenue And Profit Of Trading Company Export Trade Business Profile Ideas PDF
This slide highlights the revenue and profit of trading company in bar graph format which includes data from last 5 years from financial year 2018 to 2022.Are you searching for a Revenue And Profit Of Trading Company Export Trade Business Profile Ideas PDF that is uncluttered, straightforward, and original Its easy to edit, and you can change the colors to suit your personal or business branding. For a presentation that expresses how much effort you ve put in, this template is ideal With all of its features, including tables, diagrams, statistics, and lists, its perfect for a business plan presentation. Make your ideas more appealing with these professional slides. Download Revenue And Profit Of Trading Company Export Trade Business Profile Ideas PDF from Slidegeeks today.
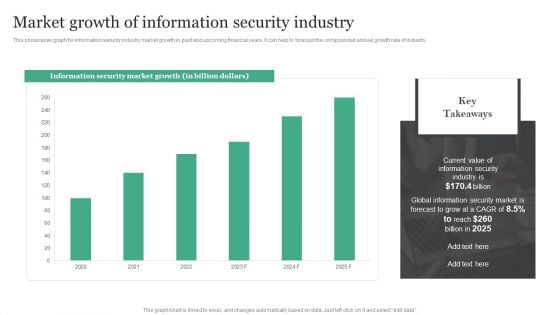
Market Growth Of Information Security Industry Information Security Risk Administration Rules PDF
This showcases graph for information security industry market growth in past and upcoming financial years. It can help to forecast the compounded annual growth rate of industry. This Market Growth Of Information Security Industry Information Security Risk Administration Rules PDF is perfect for any presentation, be it in front of clients or colleagues. It is a versatile and stylish solution for organizing your meetings. The Market Growth Of Information Security Industry Information Security Risk Administration Rules PDF features a modern design for your presentation meetings. The adjustable and customizable slides provide unlimited possibilities for acing up your presentation. Slidegeeks has done all the homework before launching the product for you. So, do not wait, grab the presentation templates today

Market Growth Of Information Security Industry Cybersecurity Risk Assessment Portrait PDF
This slide showcases graph for information security industry market growth in past and upcoming financial years. It can help to forecast the compounded annual growth rate of industry. Do you know about Slidesgeeks Market Growth Of Information Security Industry Cybersecurity Risk Assessment Portrait PDF These are perfect for delivering any kind od presentation. Using it, create PowerPoint presentations that communicate your ideas and engage audiences. Save time and effort by using our pre-designed presentation templates that are perfect for a wide range of topic. Our vast selection of designs covers a range of styles, from creative to business, and are all highly customizable and easy to edit. Download as a PowerPoint template or use them as Google Slides themes.
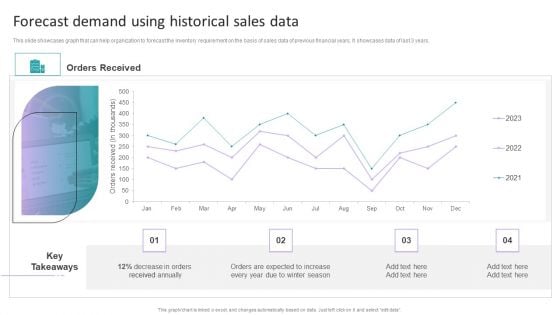
Stock Inventory Acquisition Forecast Demand Using Historical Sales Data Themes PDF
This slide showcases graph that can help organization to forecast the inventory requirement on the basis of sales data of previous financial years. It showcases data of last 3 years. This Stock Inventory Acquisition Forecast Demand Using Historical Sales Data Themes PDF from Slidegeeks makes it easy to present information on your topic with precision. It provides customization options, so you can make changes to the colors, design, graphics, or any other component to create a unique layout. It is also available for immediate download, so you can begin using it right away. Slidegeeks has done good research to ensure that you have everything you need to make your presentation stand out. Make a name out there for a brilliant performance.
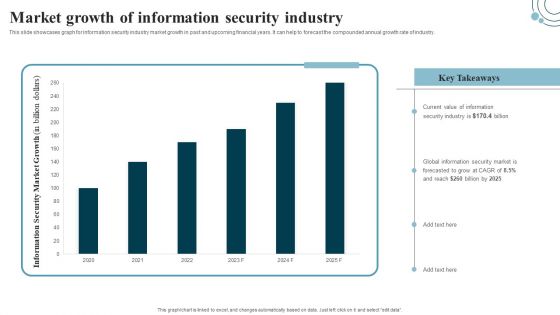
Developing IT Security Strategy Market Growth Of Information Security Industry Ideas PDF
This slide showcases graph for information security industry market growth in past and upcoming financial years. It can help to forecast the compounded annual growth rate of industry. Whether you have daily or monthly meetings, a brilliant presentation is necessary. Developing IT Security Strategy Market Growth Of Information Security Industry Ideas PDF can be your best option for delivering a presentation. Represent everything in detail using Developing IT Security Strategy Market Growth Of Information Security Industry Ideas PDF and make yourself stand out in meetings. The template is versatile and follows a structure that will cater to your requirements. All the templates prepared by Slidegeeks are easy to download and edit. Our research experts have taken care of the corporate themes as well. So, give it a try and see the results.
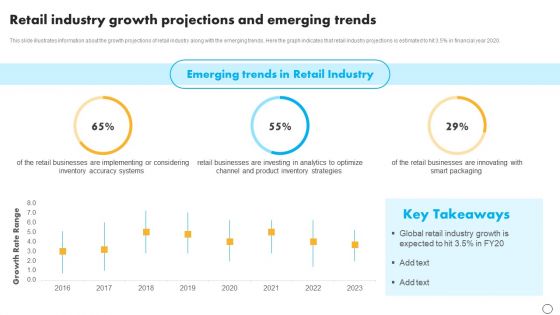
Retail Business Optimization Through Operational Excellence Strategy Retail Industry Growth Projections Professional PDF
This slide illustrates information about the growth projections of retail industry along with the emerging trends. Here the graph indicates that retail industry projections is estimated to hit 3.5 percent in financial year 2020. Get a simple yet stunning designed Retail Business Optimization Through Operational Excellence Strategy Retail Industry Growth Projections Professional PDF. It is the best one to establish the tone in your meetings. It is an excellent way to make your presentations highly effective. So, download this PPT today from Slidegeeks and see the positive impacts. Our easy to edit Retail Business Optimization Through Operational Excellence Strategy Retail Industry Growth Projections Professional PDF can be your go to option for all upcoming conferences and meetings. So, what are you waiting for Grab this template today.
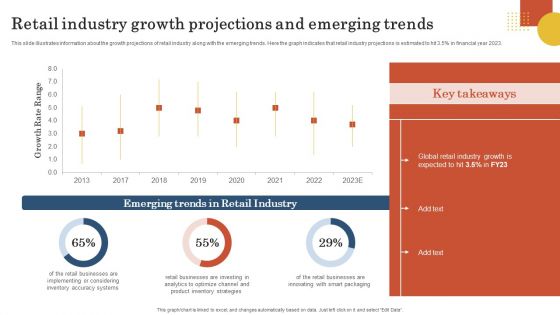
Retail Business Operation Management To Optimize Customer Experience Retail Industry Growth Projections Elements PDF
This slide illustrates information about the growth projections of retail industry along with the emerging trends. Here the graph indicates that retail industry projections is estimated to hit 3.5 percent in financial year 2023. This Retail Business Operation Management To Optimize Customer Experience Retail Industry Growth Projections Elements PDF is perfect for any presentation, be it in front of clients or colleagues. It is a versatile and stylish solution for organizing your meetings. The Retail Business Operation Management To Optimize Customer Experience Retail Industry Growth Projections Elements PDF features a modern design for your presentation meetings. The adjustable and customizable slides provide unlimited possibilities for acing up your presentation. Slidegeeks has done all the homework before launching the product for you. So, do not wait, grab the presentation templates today
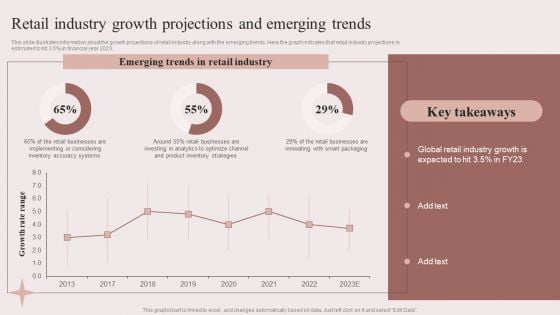
Enhancing Retail Process By Effective Inventory Management Retail Industry Growth Projections Emerging Slides PDF
This slide illustrates information about the growth projections of retail industry along with the emerging trends. Here the graph indicates that retail industry projections is estimated to hit 3.5 percent in financial year 2023. This Enhancing Retail Process By Effective Inventory Management Retail Industry Growth Projections Emerging Slides PDF is perfect for any presentation, be it in front of clients or colleagues. It is a versatile and stylish solution for organizing your meetings. The Enhancing Retail Process By Effective Inventory Management Retail Industry Growth Projections Emerging Slides PDF features a modern design for your presentation meetings. The adjustable and customizable slides provide unlimited possibilities for acing up your presentation. Slidegeeks has done all the homework before launching the product for you. So, do not wait, grab the presentation templates today
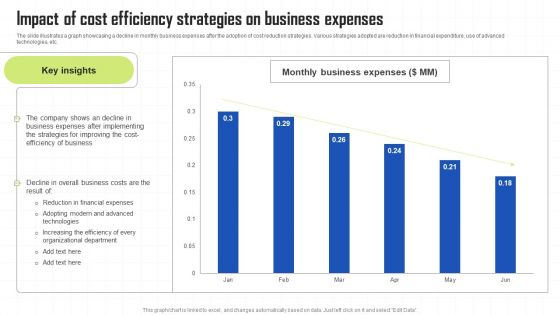
Key Techniques To Enhance Cost Efficiency Impact Of Cost Efficiency Strategies On Business Expenses Summary PDF
The slide illustrates a graph showcasing a decline in monthly business expenses after the adoption of cost reduction strategies. Various strategies adopted are reduction in financial expenditure, use of advanced technologies, etc. Explore a selection of the finest Key Techniques To Enhance Cost Efficiency Impact Of Cost Efficiency Strategies On Business Expenses Summary PDF here. With a plethora of professionally designed and pre made slide templates, you can quickly and easily find the right one for your upcoming presentation. You can use our Key Techniques To Enhance Cost Efficiency Impact Of Cost Efficiency Strategies On Business Expenses Summary PDF to effectively convey your message to a wider audience. Slidegeeks has done a lot of research before preparing these presentation templates. The content can be personalized and the slides are highly editable. Grab templates today from Slidegeeks.
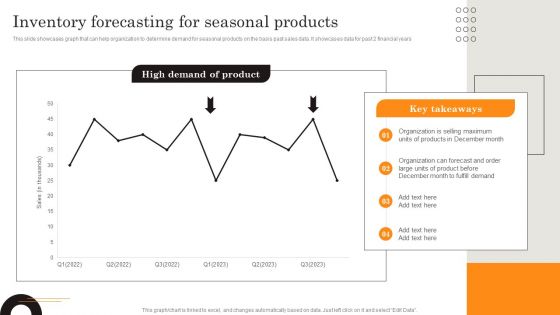
Procurement Strategies For Reducing Stock Wastage Inventory Forecasting For Seasonal Ideas PDF
This slide showcases graph that can help organization to determine demand for seasonal products on the basis past sales data. It showcases data for past 2 financial years. Do you have to make sure that everyone on your team knows about any specific topic I yes, then you should give Procurement Strategies For Reducing Stock Wastage Inventory Forecasting For Seasonal Ideas PDF a try. Our experts have put a lot of knowledge and effort into creating this impeccable Procurement Strategies For Reducing Stock Wastage Inventory Forecasting For Seasonal Ideas PDF. You can use this template for your upcoming presentations, as the slides are perfect to represent even the tiniest detail. You can download these templates from the Slidegeeks website and these are easy to edit. So grab these today.
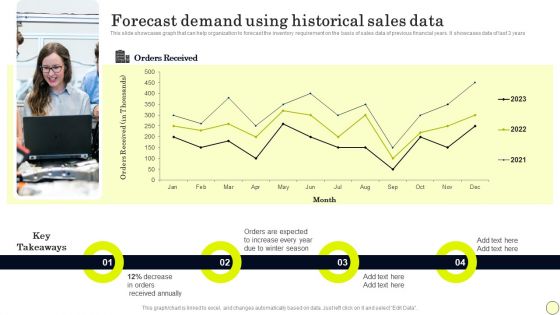
Strategies To Order And Manage Ideal Inventory Levels Forecast Demand Using Historical Template PDF
This slide showcases graph that can help organization to forecast the inventory requirement on the basis of sales data of previous financial years. It showcases data of last 3 years. Do you know about Slidesgeeks Strategies To Order And Manage Ideal Inventory Levels Forecast Demand Using Historical Template PDF These are perfect for delivering any kind od presentation. Using it, create PowerPoint presentations that communicate your ideas and engage audiences. Save time and effort by using our pre designed presentation templates that are perfect for a wide range of topic. Our vast selection of designs covers a range of styles, from creative to business, and are all highly customizable and easy to edit. Download as a PowerPoint template or use them as Google Slides themes.
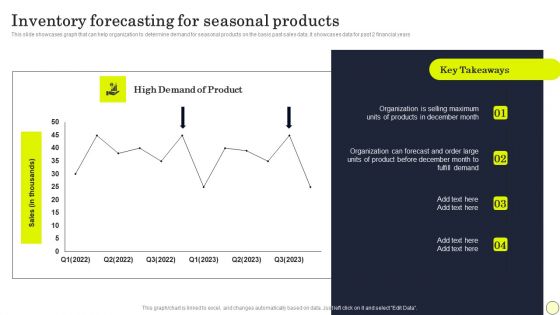
Strategies To Order And Manage Ideal Inventory Levels Inventory Forecasting Elements PDF
This slide showcases graph that can help organization to determine demand for seasonal products on the basis past sales data. It showcases data for past 2 financial years. Do you have to make sure that everyone on your team knows about any specific topic I yes, then you should give Strategies To Order And Manage Ideal Inventory Levels Inventory Forecasting Elements PDF a try. Our experts have put a lot of knowledge and effort into creating this impeccable Strategies To Order And Manage Ideal Inventory Levels Inventory Forecasting Elements PDF. You can use this template for your upcoming presentations, as the slides are perfect to represent even the tiniest detail. You can download these templates from the Slidegeeks website and these are easy to edit. So grab these today.
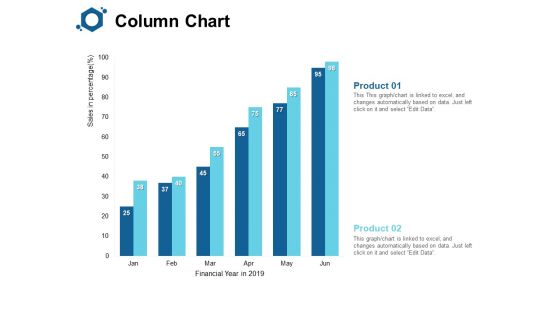
Column Chart Analysis Ppt PowerPoint Presentation Pictures Sample
Presenting this set of slides with name column chart analysis ppt powerpoint presentation pictures sample. The topics discussed in these slides are column chart, product, financial year, sales, marketing. This is a completely editable PowerPoint presentation and is available for immediate download. Download now and impress your audience.
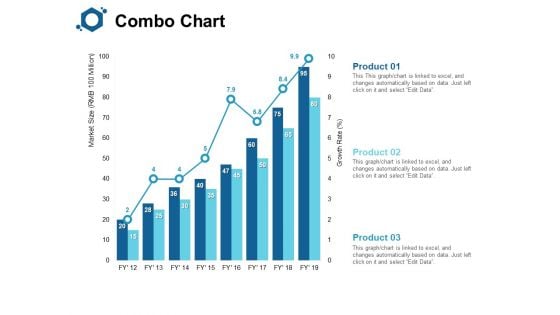
Combo Chart Finance Ppt PowerPoint Presentation Summary Images
Presenting this set of slides with name combo chart finance ppt powerpoint presentation summary images. The topics discussed in these slides are combo chart, product, growth rate, market size, financial year. This is a completely editable PowerPoint presentation and is available for immediate download. Download now and impress your audience.
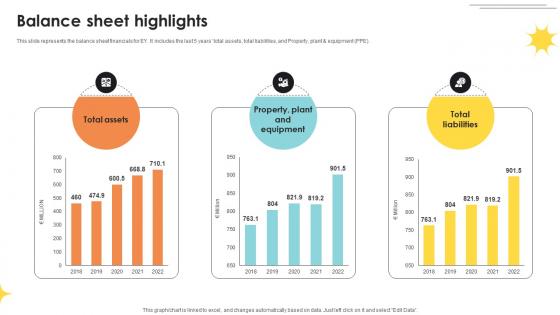
Balance Sheet Highlights Professional Services And Tax Advisory Company Profile CP SS V
This slide represents the balance sheet financials for EY. It includes the last 5 years total assets, total liabilities, and Property, plant and equipment PPE. Find a pre-designed and impeccable Balance Sheet Highlights Professional Services And Tax Advisory Company Profile CP SS V. The templates can ace your presentation without additional effort. You can download these easy-to-edit presentation templates to make your presentation stand out from others. So, what are you waiting for Download the template from Slidegeeks today and give a unique touch to your presentation. This slide represents the balance sheet financials for EY. It includes the last 5 years total assets, total liabilities, and Property, plant and equipment PPE.
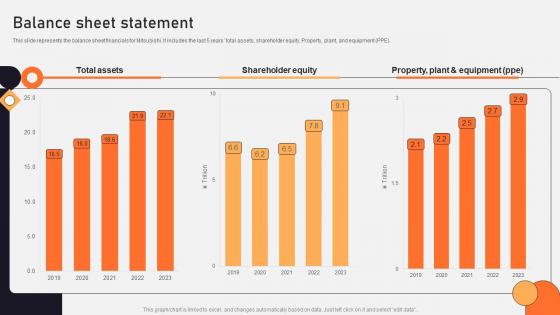
Balance Sheet Statement Vehicle Manufacturing Company Profile CP SS V
This slide represents the balance sheet financials for Mitsubishi. It includes the last 5 years total assets, shareholder equity, Property, plant, and equipment PPE. Find a pre-designed and impeccable Balance Sheet Statement Vehicle Manufacturing Company Profile CP SS V. The templates can ace your presentation without additional effort. You can download these easy-to-edit presentation templates to make your presentation stand out from others. So, what are you waiting for Download the template from Slidegeeks today and give a unique touch to your presentation. This slide represents the balance sheet financials for Mitsubishi. It includes the last 5 years total assets, shareholder equity, Property, plant, and equipment PPE.
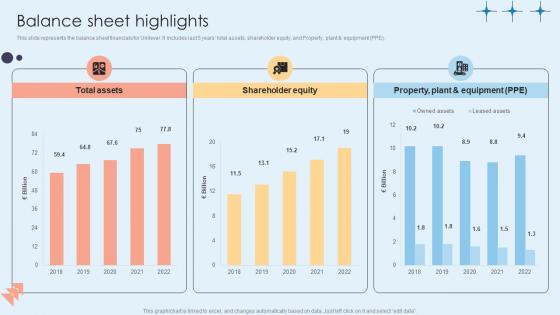
Balance Sheet Highlights Home Care Solutions Company Profile CP SS V
This slide represents the balance sheet financials for Unilever. It includes last 5 yearstotal assets, shareholder equity, and Property, plant and equipment PPE. Find a pre-designed and impeccable Balance Sheet Highlights Home Care Solutions Company Profile CP SS V. The templates can ace your presentation without additional effort. You can download these easy-to-edit presentation templates to make your presentation stand out from others. So, what are you waiting for Download the template from Slidegeeks today and give a unique touch to your presentation. This slide represents the balance sheet financials for Unilever. It includes last 5 yearstotal assets, shareholder equity, and Property, plant and equipment PPE.
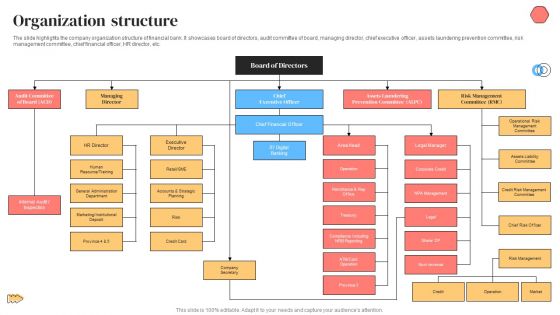
Banking Solutions Company Overview Organization Structure Diagrams PDF
The slide highlights the company organization structure of financial bank. It showcases board of directors, audit committee of board, managing director, chief executive officer, assets laundering prevention committee, risk management committee, chief financial officer, HR director, etc. This is a Banking Solutions Company Overview Organization Structure Diagrams PDF template with various stages. Focus and dispense information on three stages using this creative set, that comes with editable features. It contains large content boxes to add your information on topics like Chief Financial Officer, Chief Executive Officer, Risk. You can also showcase facts, figures, and other relevant content using this PPT layout. Grab it now.
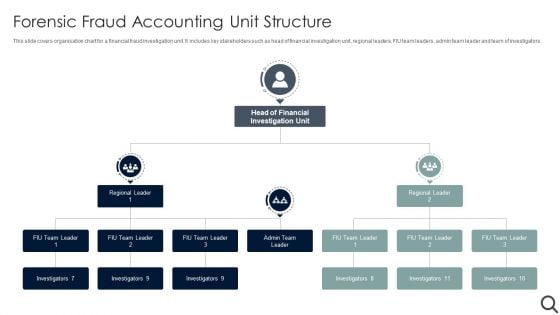
Forensic Fraud Accounting Unit Structure Ideas PDF
This slide covers organisation chart for a financial fraud investigation unit. It includes key stakeholders such as head of financial investigation unit, regional leaders, FIU team leaders, admin team leader and team of investigators. Persuade your audience using this Forensic Fraud Accounting Unit Structure Ideas PDF. This PPT design covers three stages, thus making it a great tool to use. It also caters to a variety of topics including Team Leader, Head Of Financial, Investigation Unit. Download this PPT design now to present a convincing pitch that not only emphasizes the topic but also showcases your presentation skills.
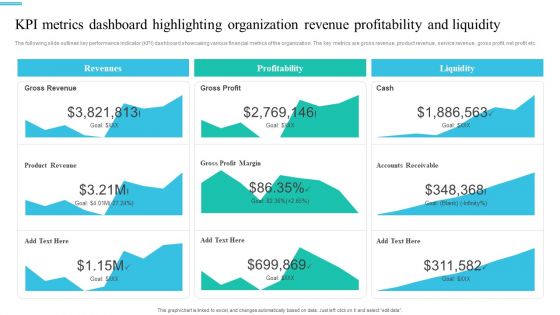
Monetary Planning And Evaluation Guide KPI Metrics Dashboard Highlighting Organization Revenue Profitability And Liquidity Ppt Diagram Images PDF
The following slide outlines key performance indicator KPI dashboard showcasing various financial metrics of the organization. The key metrics are gross revenue, product revenue, service revenue, gross profit, net profit etc. Coming up with a presentation necessitates that the majority of the effort goes into the content and the message you intend to convey. The visuals of a PowerPoint presentation can only be effective if it supplements and supports the story that is being told. Keeping this in mind our experts created Monetary Planning And Evaluation Guide KPI Metrics Dashboard Highlighting Organization Revenue Profitability And Liquidity Ppt Diagram Images PDF to reduce the time that goes into designing the presentation. This way, you can concentrate on the message while our designers take care of providing you with the right template for the situation.
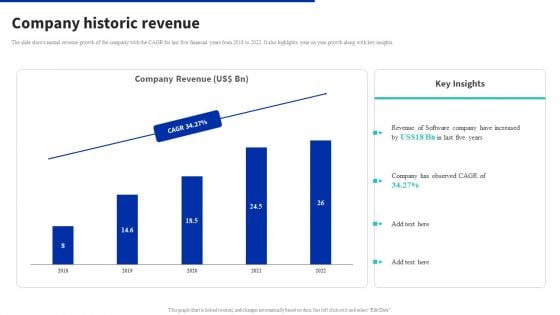
Digital Products Company Outline Company Historic Revenue Graphics PDF
The slide shows annual revenue growth of the company with the CAGR for last five financial years from 2018 to 2022. It also highlights year on year growth along with key insights. Presenting this PowerPoint presentation, titled Digital Products Company Outline Company Historic Revenue Graphics PDF, with topics curated by our researchers after extensive research. This editable presentation is available for immediate download and provides attractive features when used. Download now and captivate your audience. Presenting this Digital Products Company Outline Company Historic Revenue Graphics PDF. Our researchers have carefully researched and created these slides with all aspects taken into consideration. This is a completely customizable Digital Products Company Outline Company Historic Revenue Graphics PDF that is available for immediate downloading. Download now and make an impact on your audience. Highlight the attractive features available with our PPTs.
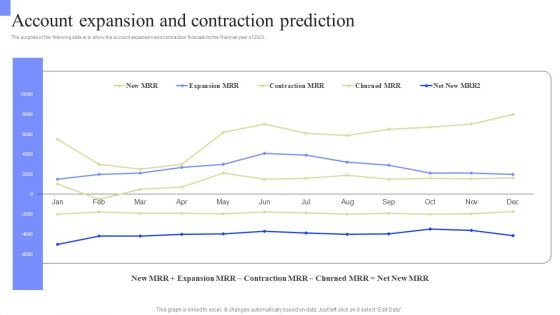
Periodic Revenue Model Account Expansion And Contraction Prediction Summary PDF
The purpose of the following slide is to show the account expansion and contraction forecast for the financial year of 2023. Presenting this PowerPoint presentation, titled Periodic Revenue Model Account Expansion And Contraction Prediction Summary PDF, with topics curated by our researchers after extensive research. This editable presentation is available for immediate download and provides attractive features when used. Download now and captivate your audience. Presenting this Periodic Revenue Model Account Expansion And Contraction Prediction Summary PDF. Our researchers have carefully researched and created these slides with all aspects taken into consideration. This is a completely customizable Periodic Revenue Model Account Expansion And Contraction Prediction Summary PDF that is available for immediate downloading. Download now and make an impact on your audience. Highlight the attractive features available with our PPTs.
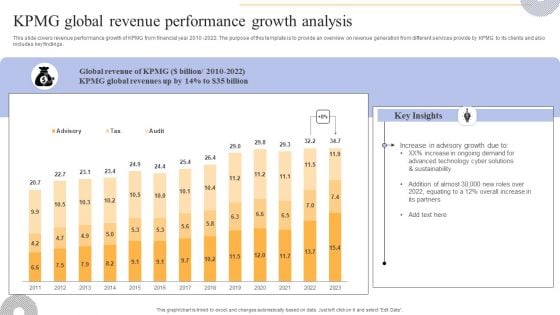
KPMG Global Revenue Performance Growth Analysis Clipart PDF
This slide covers revenue performance growth of KPMG from financial year 2010 -2022. The purpose of this template is to provide an overview on revenue generation from different services provide by KPMG to its clients and also includes key findings. Are you in need of a template that can accommodate all of your creative concepts This one is crafted professionally and can be altered to fit any style. Use it with Google Slides or PowerPoint. Include striking photographs, symbols, depictions, and other visuals. Fill, move around, or remove text boxes as desired. Test out color palettes and font mixtures. Edit and save your work, or work with colleagues. Download KPMG Global Revenue Performance Growth Analysis Clipart PDF and observe how to make your presentation outstanding. Give an impeccable presentation to your group and make your presentation unforgettable.
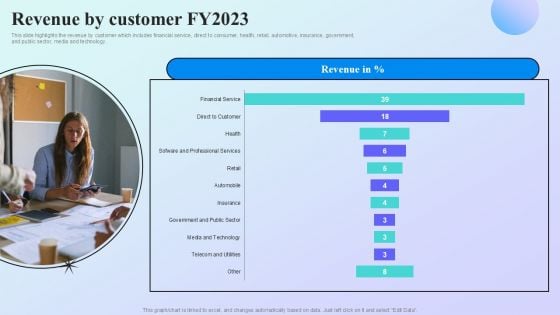
Information Analytics Company Outline Revenue By Customer Fy2023 Topics PDF
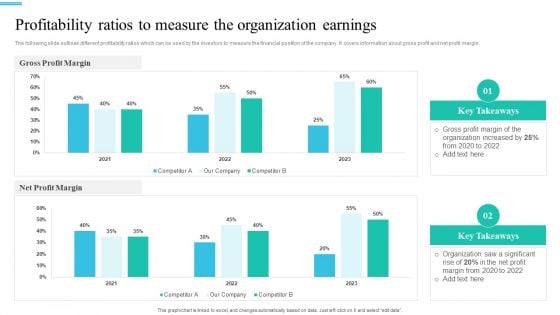
Monetary Planning And Evaluation Guide Profitability Ratios To Measure The Organization Earnings Ppt Ideas Skills PDF
The following slide outlines different profitability ratios which can be used by the investors to measure the financial position of the company. It covers information about gross profit and net profit margin. Retrieve professionally designed Monetary Planning And Evaluation Guide Profitability Ratios To Measure The Organization Earnings Ppt Ideas Skills PDF to effectively convey your message and captivate your listeners. Save time by selecting pre-made slideshows that are appropriate for various topics, from business to educational purposes. These themes come in many different styles, from creative to corporate, and all of them are easily adjustable and can be edited quickly. Access them as PowerPoint templates or as Google Slides themes. You do not have to go on a hunt for the perfect presentation because Slidegeeks got you covered from everywhere.


 Continue with Email

 Home
Home


