Financial Graphs
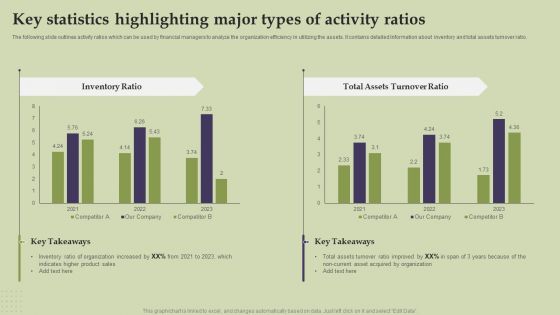
Methods And Approaches To Assess Key Statistics Highlighting Major Types Of Activity Ratios Download PDF
The following slide outlines activity ratios which can be used by financial managers to analyze the organization efficiency in utilizing the assets. It contains detailed Information about inventory and total assets turnover ratio. Retrieve professionally designed Methods And Approaches To Assess Key Statistics Highlighting Major Types Of Activity Ratios Download PDF to effectively convey your message and captivate your listeners. Save time by selecting pre-made slideshows that are appropriate for various topics, from business to educational purposes. These themes come in many different styles, from creative to corporate, and all of them are easily adjustable and can be edited quickly. Access them as PowerPoint templates or as Google Slides themes. You do not have to go on a hunt for the perfect presentation because Slidegeeks got you covered from everywhere.
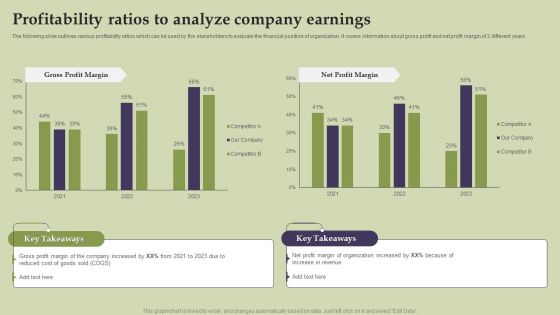
Methods And Approaches To Assess Profitability Ratios To Analyze Company Earnings Information PDF
The following slide outlines various profitability ratios which can be used by the stakeholders to evaluate the financial position of organization. It covers information about gross profit and net profit margin of 3 different years. This Methods And Approaches To Assess Profitability Ratios To Analyze Company Earnings Information PDF from Slidegeeks makes it easy to present information on your topic with precision. It provides customization options, so you can make changes to the colors, design, graphics, or any other component to create a unique layout. It is also available for immediate download, so you can begin using it right away. Slidegeeks has done good research to ensure that you have everything you need to make your presentation stand out. Make a name out there for a brilliant performance.
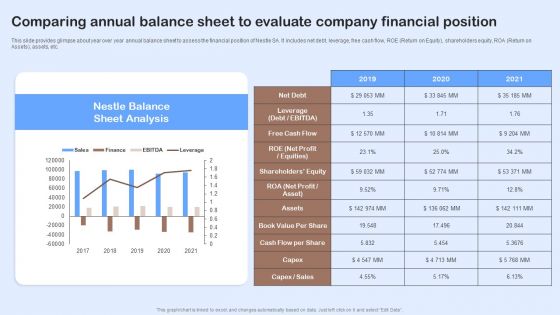
Nestle Performance Management Report Comparing Annual Balance Sheet To Evaluate Download PDF
This slide provides glimpse about year over year annual balance sheet to assess the financial position of Nestle SA. It includes net debt, leverage, free cash flow, ROE Return on Equity, shareholders equity, ROA Return on Assets, assets, etc. Do you have to make sure that everyone on your team knows about any specific topic I yes, then you should give Nestle Performance Management Report Comparing Annual Balance Sheet To Evaluate Download PDF a try. Our experts have put a lot of knowledge and effort into creating this impeccable Nestle Performance Management Report Comparing Annual Balance Sheet To Evaluate Download PDF. You can use this template for your upcoming presentations, as the slides are perfect to represent even the tiniest detail. You can download these templates from the Slidegeeks website and these are easy to edit. So grab these today.
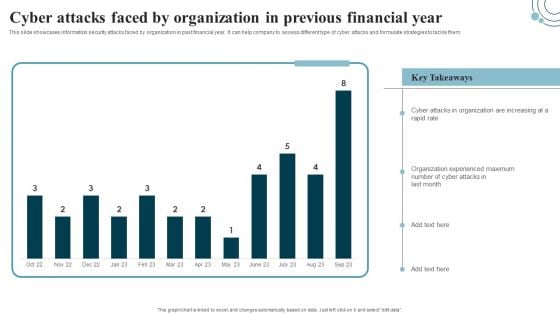
Developing IT Security Strategy Cyber Attacks Faced By Organization In Previous Summary PDF
This slide showcases information security attacks faced by organization in past financial year. It can help company to assess different type of cyber attacks and formulate strategies to tackle them. Retrieve professionally designed Developing IT Security Strategy Cyber Attacks Faced By Organization In Previous Summary PDF to effectively convey your message and captivate your listeners. Save time by selecting pre-made slideshows that are appropriate for various topics, from business to educational purposes. These themes come in many different styles, from creative to corporate, and all of them are easily adjustable and can be edited quickly. Access them as PowerPoint templates or as Google Slides themes. You do not have to go on a hunt for the perfect presentation because Slidegeeks got you covered from everywhere.
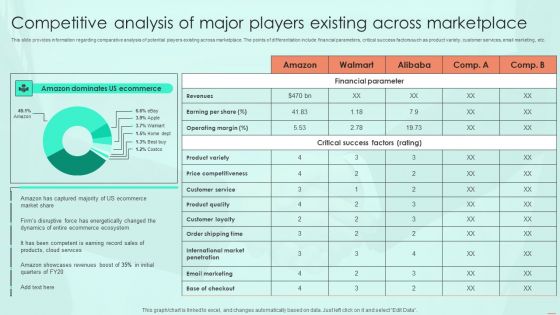
Competitive Analysis Of Major Players Existing Across Marketplace Sample PDF
This slide provides information regarding comparative analysis of potential players existing across marketplace. The points of differentiation include financial parameters, critical success factors such as product variety, customer services, email marketing, etc. Slidegeeks is one of the best resources for PowerPoint templates. You can download easily and regulate Competitive Analysis Of Major Players Existing Across Marketplace Sample PDF for your personal presentations from our wonderful collection. A few clicks is all it takes to discover and get the most relevant and appropriate templates. Use our Templates to add a unique zing and appeal to your presentation and meetings. All the slides are easy to edit and you can use them even for advertisement purposes.
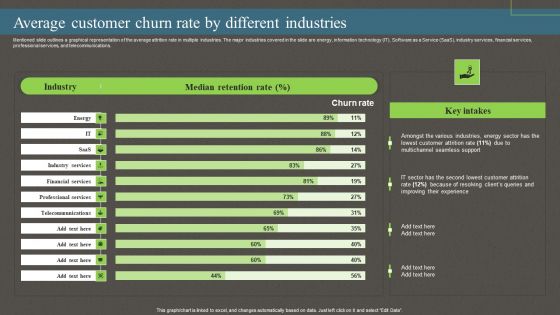
Average Customer Churn Rate By Different Industries Ppt PowerPoint Presentation File Example PDF
Mentioned slide outlines a graphical representation of the average attrition rate in multiple industries. The major industries covered in the slide are energy, information technology IT, Software as a Service SaaS, industry services, financial services, professional services, and telecommunications. Whether you have daily or monthly meetings, a brilliant presentation is necessary. Average Customer Churn Rate By Different Industries Ppt PowerPoint Presentation File Example PDF can be your best option for delivering a presentation. Represent everything in detail using Average Customer Churn Rate By Different Industries Ppt PowerPoint Presentation File Example PDF and make yourself stand out in meetings. The template is versatile and follows a structure that will cater to your requirements. All the templates prepared by Slidegeeks are easy to download and edit. Our research experts have taken care of the corporate themes as well. So, give it a try and see the results.
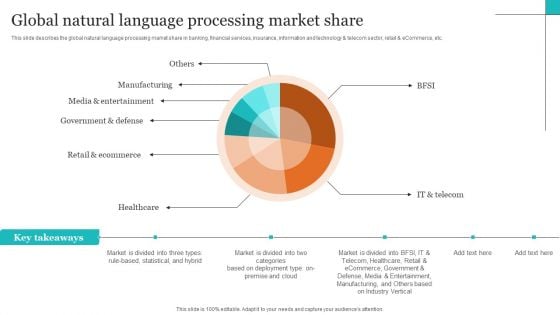
Leveraging NLP To Enhance Operational Efficiency Global Natural Language Processing Market Share Background PDF
This slide describes the global natural language processing market share in banking, financial services, insurance, information and technology and telecom sector, retail and eCommerce, etc. Welcome to our selection of the Leveraging NLP To Enhance Operational Efficiency Global Natural Language Processing Market Share Background PDF. These are designed to help you showcase your creativity and bring your sphere to life. Planning and Innovation are essential for any business that is just starting out. This collection contains the designs that you need for your everyday presentations. All of our PowerPoints are 100 percent editable, so you can customize them to suit your needs. This multi purpose template can be used in various situations. Grab these presentation templates today.
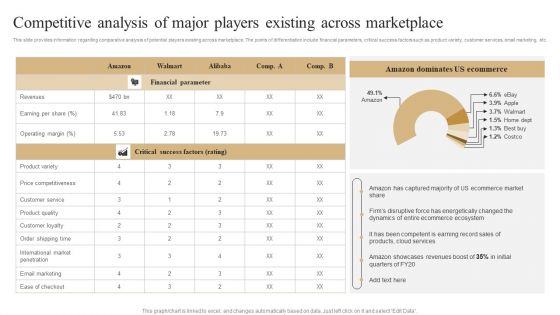
Competitive Analysis Of Major Players Existing Across Marketplace Diagrams PDF
This slide provides information regarding comparative analysis of potential players existing across marketplace. The points of differentiation include financial parameters, critical success factors such as product variety, customer services, email marketing, etc. Find highly impressive Competitive Analysis Of Major Players Existing Across Marketplace Diagrams PDF on Slidegeeks to deliver a meaningful presentation. You can save an ample amount of time using these presentation templates. No need to worry to prepare everything from scratch because Slidegeeks experts have already done a huge research and work for you. You need to download Competitive Analysis Of Major Players Existing Across Marketplace Diagrams PDF for your upcoming presentation. All the presentation templates are 100 percent editable and you can change the color and personalize the content accordingly. Download now
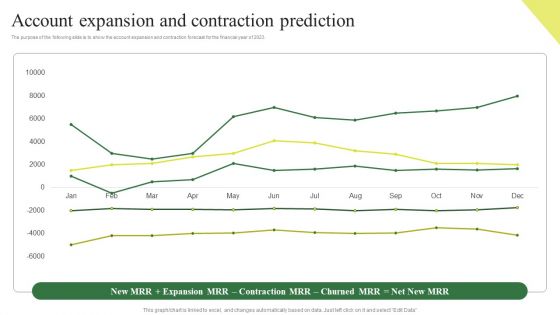
Consumption Based Pricing Model Account Expansion And Contraction Prediction Inspiration PDF
The purpose of the following slide is to show the account expansion and contraction forecast for the financial year of 2023. If you are looking for a format to display your unique thoughts, then the professionally designed Consumption Based Pricing Model Account Expansion And Contraction Prediction Inspiration PDF is the one for you. You can use it as a Google Slides template or a PowerPoint template. Incorporate impressive visuals, symbols, images, and other charts. Modify or reorganize the text boxes as you desire. Experiment with shade schemes and font pairings. Alter, share or cooperate with other people on your work. Download Consumption Based Pricing Model Account Expansion And Contraction Prediction Inspiration PDF and find out how to give a successful presentation. Present a perfect display to your team and make your presentation unforgettable.
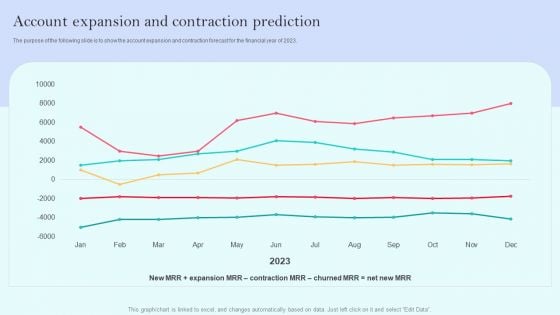
Recurring Income Generation Model Account Expansion And Contraction Prediction Demonstration PDF
The purpose of the following slide is to show the account expansion and contraction forecast for the financial year of 2023. If you are looking for a format to display your unique thoughts, then the professionally designed Recurring Income Generation Model Account Expansion And Contraction Prediction Demonstration PDF is the one for you. You can use it as a Google Slides template or a PowerPoint template. Incorporate impressive visuals, symbols, images, and other charts. Modify or reorganize the text boxes as you desire. Experiment with shade schemes and font pairings. Alter, share or cooperate with other people on your work. Download Recurring Income Generation Model Account Expansion And Contraction Prediction Demonstration PDF and find out how to give a successful presentation. Present a perfect display to your team and make your presentation unforgettable.
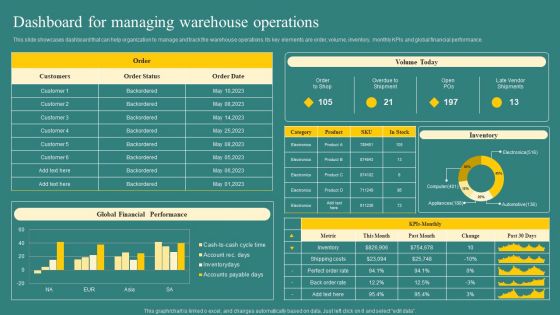
Dashboard For Managing Warehouse Operations Mockup PDF
This slide showcases dashboard that can help organization to manage and track the warehouse operations. Its key elements are order, volume, inventory, monthly KPIs and global financial performance. Here you can discover an assortment of the finest PowerPoint and Google Slides templates. With these templates, you can create presentations for a variety of purposes while simultaneously providing your audience with an eye catching visual experience. Download Dashboard For Managing Warehouse Operations Mockup PDF to deliver an impeccable presentation. These templates will make your job of preparing presentations much quicker, yet still, maintain a high level of quality. Slidegeeks has experienced researchers who prepare these templates and write high quality content for you. Later on, you can personalize the content by editing the Dashboard For Managing Warehouse Operations Mockup PDF.
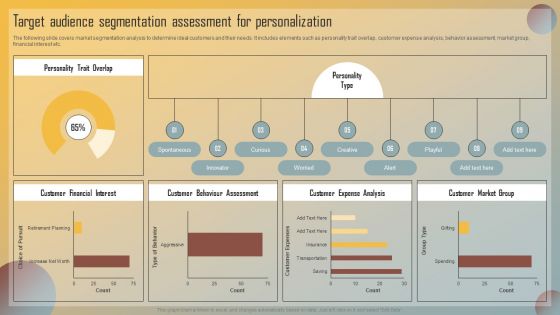
Guide For Marketing Analytics To Improve Decisions Target Audience Segmentation Assessment For Personalization Slides PDF
The following slide covers market segmentation analysis to determine ideal customers and their needs. It includes elements such as personality trait overlap, customer expense analysis, behavior assessment, market group, financial interest etc. The Guide For Marketing Analytics To Improve Decisions Target Audience Segmentation Assessment For Personalization Slides PDF is a compilation of the most recent design trends as a series of slides. It is suitable for any subject or industry presentation, containing attractive visuals and photo spots for businesses to clearly express their messages. This template contains a variety of slides for the user to input data, such as structures to contrast two elements, bullet points, and slides for written information. Slidegeeks is prepared to create an impression.
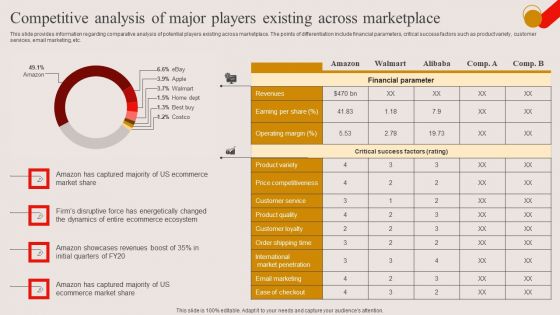
Competitive Analysis Of Major Players Existing Across Marketplace Ppt PowerPoint Presentation File Example File PDF
This slide provides information regarding comparative analysis of potential players existing across marketplace. The points of differentiation include financial parameters, critical success factors such as product variety, customer services, email marketing, etc. Do you have an important presentation coming up Are you looking for something that will make your presentation stand out from the rest Look no further than Competitive Analysis Of Major Players Existing Across Marketplace Ppt PowerPoint Presentation File Example File PDF. With our professional designs, you can trust that your presentation will pop and make delivering it a smooth process. And with Slidegeeks, you can trust that your presentation will be unique and memorable. So why wait Grab Competitive Analysis Of Major Players Existing Across Marketplace Ppt PowerPoint Presentation File Example File PDF today and make your presentation stand out from the rest.
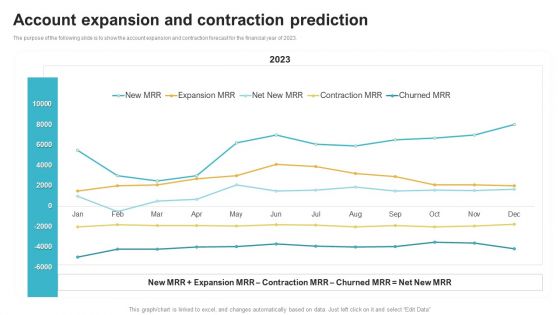
Saas Continuous Income Generation Model For Software Startup Account Expansion And Contraction Prediction Mockup PDF
The purpose of the following slide is to show the account expansion and contraction forecast for the financial year of 2023. If you are looking for a format to display your unique thoughts, then the professionally designed Saas Continuous Income Generation Model For Software Startup Account Expansion And Contraction Prediction Mockup PDF is the one for you. You can use it as a Google Slides template or a PowerPoint template. Incorporate impressive visuals, symbols, images, and other charts. Modify or reorganize the text boxes as you desire. Experiment with shade schemes and font pairings. Alter, share or cooperate with other people on your work. Download Saas Continuous Income Generation Model For Software Startup Account Expansion And Contraction Prediction Mockup PDF and find out how to give a successful presentation. Present a perfect display to your team and make your presentation unforgettable.
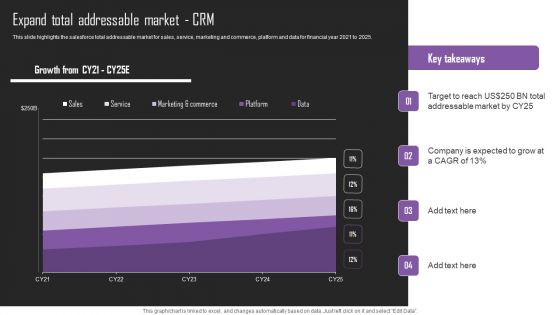
Web Hosting Software Company Outline Expand Total Addressable Market CRM Inspiration PDF
This slide highlights the salesforce total addressable market for sales, service, marketing and commerce, platform and data for financial year 2021 to 2025. Do you have to make sure that everyone on your team knows about any specific topic I yes, then you should give Web Hosting Software Company Outline Expand Total Addressable Market CRM Inspiration PDF a try. Our experts have put a lot of knowledge and effort into creating this impeccable Web Hosting Software Company Outline Expand Total Addressable Market CRM Inspiration PDF. You can use this template for your upcoming presentations, as the slides are perfect to represent even the tiniest detail. You can download these templates from the Slidegeeks website and these are easy to edit. So grab these today.
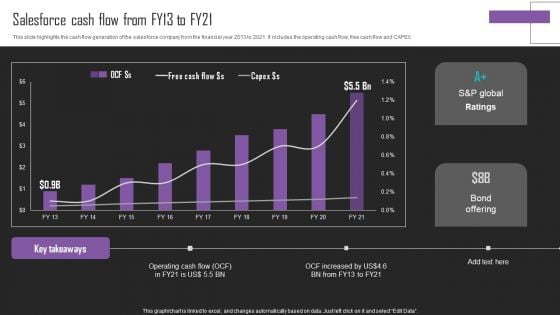
Web Hosting Software Company Outline Salesforce Cash Flow From FY13 To FY21 Pictures PDF
This slide highlights the cash flow generation of the salesforce company from the financial year 2013 to 2021. It includes the operating cash flow, free cash flow and CAPEX. Formulating a presentation can take up a lot of effort and time, so the content and message should always be the primary focus. The visuals of the PowerPoint can enhance the presenters message, so our Web Hosting Software Company Outline Salesforce Cash Flow From FY13 To FY21 Pictures PDF was created to help save time. Instead of worrying about the design, the presenter can concentrate on the message while our designers work on creating the ideal templates for whatever situation is needed. Slidegeeks has experts for everything from amazing designs to valuable content, we have put everything into Web Hosting Software Company Outline Salesforce Cash Flow From FY13 To FY21 Pictures PDF
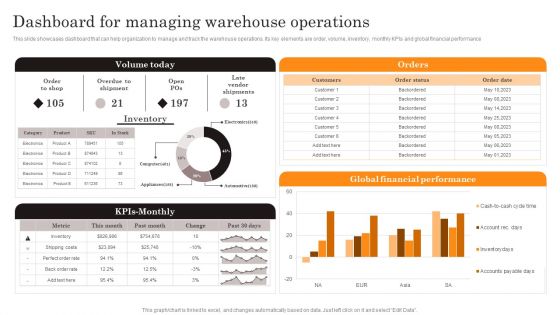
Procurement Strategies For Reducing Stock Wastage Dashboard For Managing Warehouse Infographics PDF
This slide showcases dashboard that can help organization to manage and track the warehouse operations. Its key elements are order, volume, inventory, monthly KPIs and global financial performance. Here you can discover an assortment of the finest PowerPoint and Google Slides templates. With these templates, you can create presentations for a variety of purposes while simultaneously providing your audience with an eye catching visual experience. Download Procurement Strategies For Reducing Stock Wastage Dashboard For Managing Warehouse Infographics PDF to deliver an impeccable presentation. These templates will make your job of preparing presentations much quicker, yet still, maintain a high level of quality. Slidegeeks has experienced researchers who prepare these templates and write high quality content for you. Later on, you can personalize the content by editing the Procurement Strategies For Reducing Stock Wastage Dashboard For Managing Warehouse Infographics PDF.
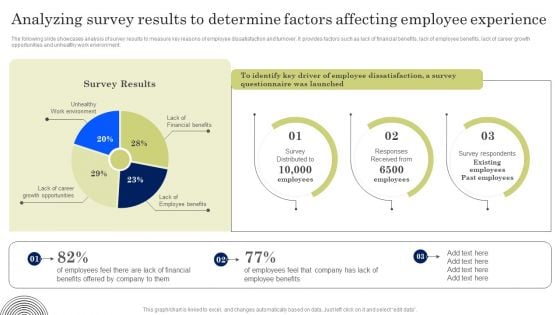
Analyzing Survey Results To Determine Factors Affecting Employee Experience Introduction PDF
The following slide showcases analysis of survey results to measure key reasons of employee dissatisfaction and turnover. It provides factors such as lack of financial benefits, lack of employee benefits, lack of career growth opportunities and unhealthy work environment. Slidegeeks is one of the best resources for PowerPoint templates. You can download easily and regulate Analyzing Survey Results To Determine Factors Affecting Employee Experience Introduction PDF for your personal presentations from our wonderful collection. A few clicks is all it takes to discover and get the most relevant and appropriate templates. Use our Templates to add a unique zing and appeal to your presentation and meetings. All the slides are easy to edit and you can use them even for advertisement purposes.
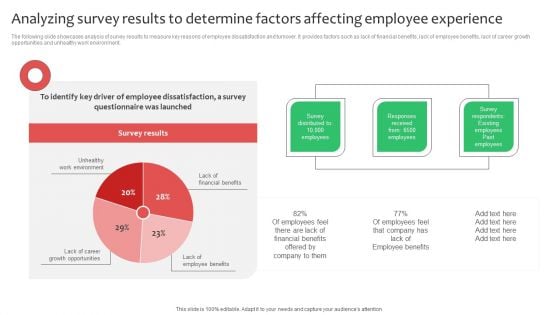
Analyzing Survey Results To Determine Factors Affecting Employee Experience Ideas PDF
The following slide showcases analysis of survey results to measure key reasons of employee dissatisfaction and turnover. It provides factors such as lack of financial benefits, lack of employee benefits, lack of career growth opportunities and unhealthy work environment. Present like a pro with Analyzing Survey Results To Determine Factors Affecting Employee Experience Ideas PDF Create beautiful presentations together with your team, using our easy to use presentation slides. Share your ideas in real time and make changes on the fly by downloading our templates. So whether you are in the office, on the go, or in a remote location, you can stay in sync with your team and present your ideas with confidence. With Slidegeeks presentation got a whole lot easier. Grab these presentations today.
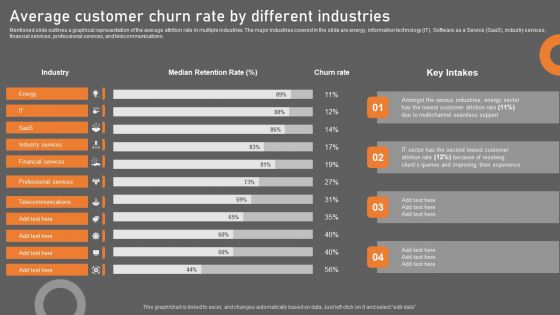
Average Customer Churn Rate By Different Industries Diagrams PDF
Mentioned slide outlines a graphical representation of the average attrition rate in multiple industries. The major industries covered in the slide are energy, information technology IT, Software as a Service SaaS, industry services, financial services, professional services, and telecommunications. Presenting this PowerPoint presentation, titled Average Customer Churn Rate By Different Industries Diagrams PDF, with topics curated by our researchers after extensive research. This editable presentation is available for immediate download and provides attractive features when used. Download now and captivate your audience. Presenting this Average Customer Churn Rate By Different Industries Diagrams PDF. Our researchers have carefully researched and created these slides with all aspects taken into consideration. This is a completely customizable Average Customer Churn Rate By Different Industries Diagrams PDF that is available for immediate downloading. Download now and make an impact on your audience. Highlight the attractive features available with our PPTs.
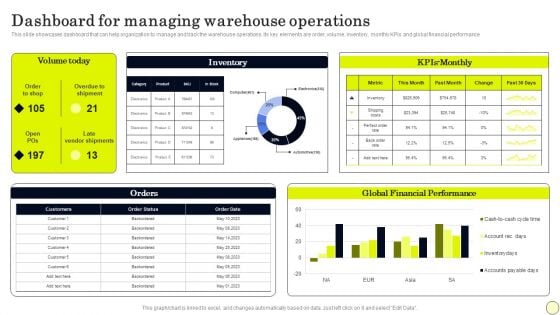
Dashboard For Managing Warehouse Operations Diagrams PDF
This slide showcases dashboard that can help organization to manage and track the warehouse operations. Its key elements are order, volume, inventory, monthly KPIs and global financial performance. Presenting this PowerPoint presentation, titled Dashboard For Managing Warehouse Operations Diagrams PDF, with topics curated by our researchers after extensive research. This editable presentation is available for immediate download and provides attractive features when used. Download now and captivate your audience. Presenting this Dashboard For Managing Warehouse Operations Diagrams PDF. Our researchers have carefully researched and created these slides with all aspects taken into consideration. This is a completely customizable Dashboard For Managing Warehouse Operations Diagrams PDF that is available for immediate downloading. Download now and make an impact on your audience. Highlight the attractive features available with our PPTs.
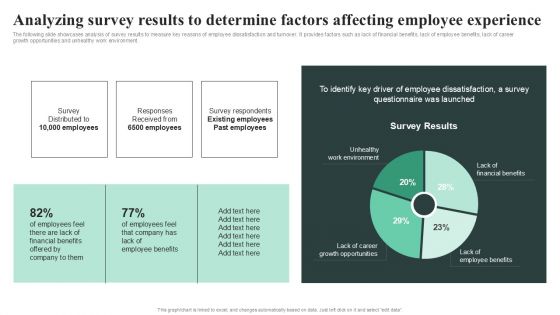
Analyzing Survey Results To Determine Factors Affecting Employee Experience Template PDF
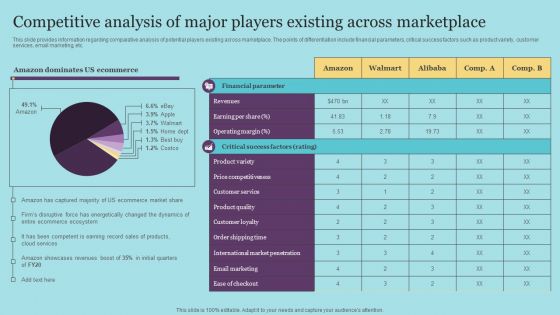
Competitive Analysis Of Major Players Existing Across Marketplace Guidelines PDF
This slide provides information regarding comparative analysis of potential players existing across marketplace. The points of differentiation include financial parameters, critical success factors such as product variety, customer services, email marketing, etc. Create an editable Competitive Analysis Of Major Players Existing Across Marketplace Guidelines PDF that communicates your idea and engages your audience. Whether you are presenting a business or an educational presentation, pre-designed presentation templates help save time. Competitive Analysis Of Major Players Existing Across Marketplace Guidelines PDF is highly customizable and very easy to edit, covering many different styles from creative to business presentations. Slidegeeks has creative team members who have crafted amazing templates. So, go and get them without any delay.
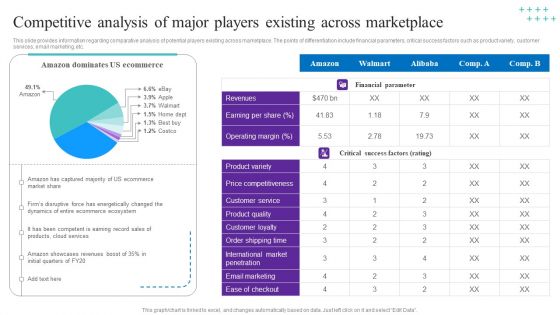
Competitive Analysis Of Major Players Existing Across Marketplace Mockup PDF
This slide provides information regarding comparative analysis of potential players existing across marketplace. The points of differentiation include financial parameters, critical success factors such as product variety, customer services, email marketing, etc. Create an editable Competitive Analysis Of Major Players Existing Across Marketplace Mockup PDF that communicates your idea and engages your audience. Whether you are presenting a business or an educational presentation, pre-designed presentation templates help save time. Competitive Analysis Of Major Players Existing Across Marketplace Mockup PDF is highly customizable and very easy to edit, covering many different styles from creative to business presentations. Slidegeeks has creative team members who have crafted amazing templates. So, go and get them without any delay.
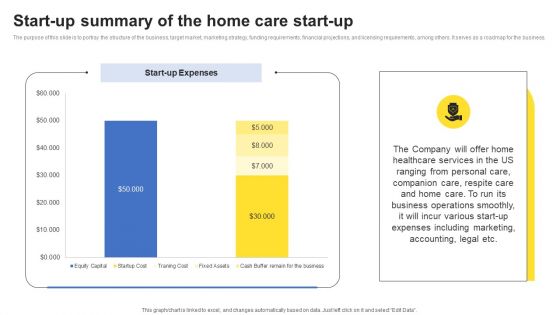
Company Analysis Of The Home Care Start Up Start Up Summary Of The Home Care Start Up Graphics PDF
The purpose of this slide is to portray the structure of the business, target market, marketing strategy, funding requirements, financial projections, and licensing requirements, among others. It serves as a roadmap for the business. Formulating a presentation can take up a lot of effort and time, so the content and message should always be the primary focus. The visuals of the PowerPoint can enhance the presenters message, so our Company Analysis Of The Home Care Start Up Start Up Summary Of The Home Care Start Up Graphics PDF was created to help save time. Instead of worrying about the design, the presenter can concentrate on the message while our designers work on creating the ideal templates for whatever situation is needed. Slidegeeks has experts for everything from amazing designs to valuable content, we have put everything into Company Analysis Of The Home Care Start Up Start Up Summary Of The Home Care Start Up Graphics PDF.
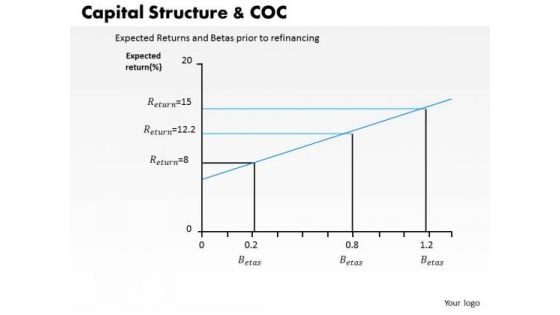
Business Framework Capital Structure And Coc PowerPoint Presentation
This PPT slide contains the concept of capital structure and cost of capital. To display both these concept we have used graphic of chart for analyzing capital structure versus COC. Use this PPT slide in your financial presentations.
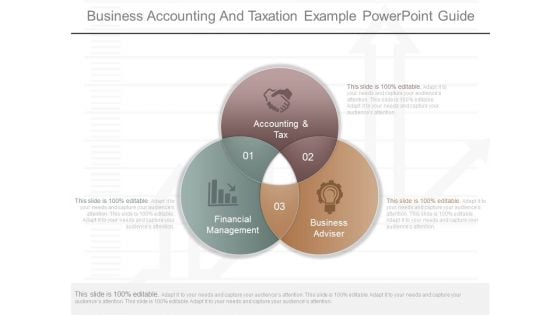
Business Accounting And Taxation Example Powerpoint Guide
This is a business accounting and taxation example powerpoint guide. This is a three stage process. The stages in this process are accounting and tax, financial management, business adviser.
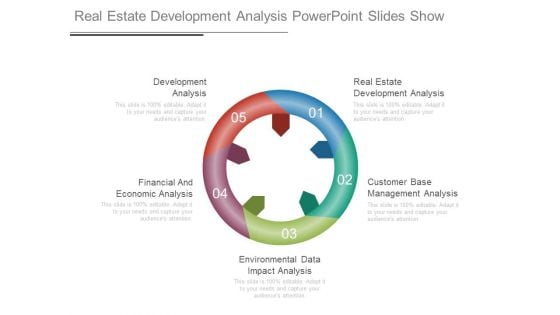
Real Estate Development Analysis Powerpoint Slides Show
This is a real estate development analysis powerpoint slides show. This is a five stage process. The stages in this process are development analysis, financial and economic analysis, environmental data impact analysis, customer base management analysis, real estate development analysis.
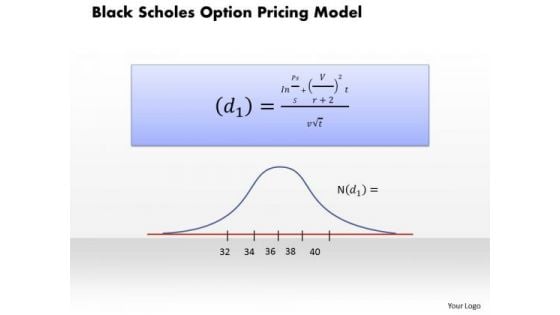
Business Framework Black Scholes Ption Pricing Model PowerPoint Presentation
This power point diagram has been crafted with graphic of black scholes ption pricing model. Use this model for various pricing valuation. Explain its graphical representation with our exclusive model. Use this diagram slide for financial presentation.
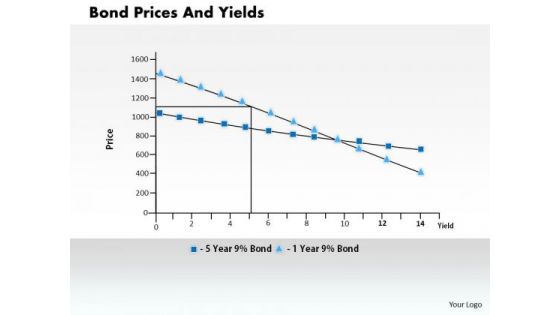
Business Framework Bond Prices And Yields PowerPoint Presentation
This power point diagram slide has been crafted with graphic of statistics of bond price and yields. Display the dependency in-between these two fields with this innovative diagram slide. This slide is very useful for financial presentations.
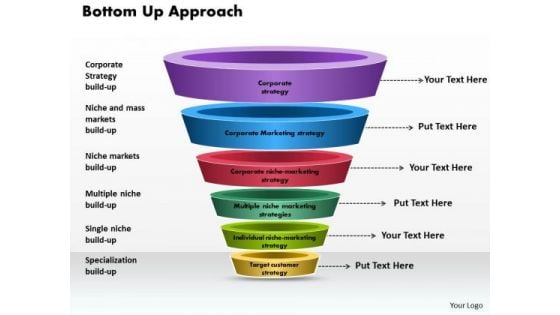
Business Framework Bottom Up Approach PowerPoint Presentation
This power point diagram slide has been crafted with bottom up approach. In this diagram, we have used multilevel funnel diagram with individual state. Use this diagram for your financial presentations and display bottom up approach in an graphical manner.
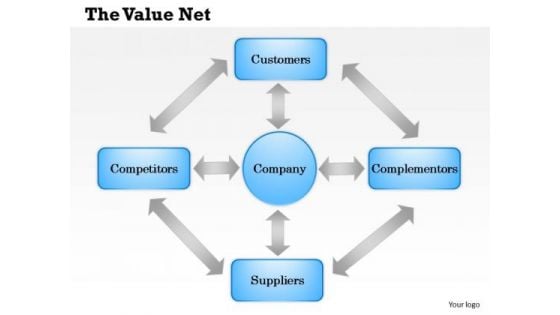
Business Framework The Value Net PowerPoint Presentation
This business power point diagram template has been designed with graphic of multiple staged. This diagram template can be used for value net calculation display in any financial and business presentations.
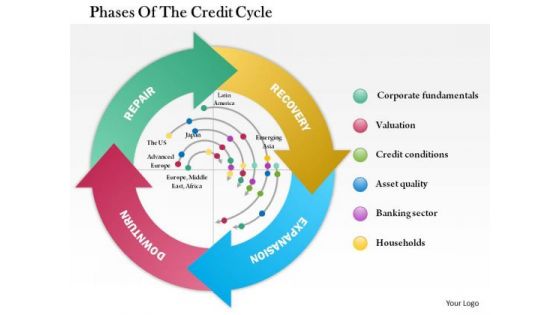
Business Framework Phases Of The Credit Cycle PowerPoint Presentation
Four arrows with interconnection in circular design has been used to design this power Point template slide. This diagram slide contains the concept of credit phases. This PPT slide can be used for financial presentations.
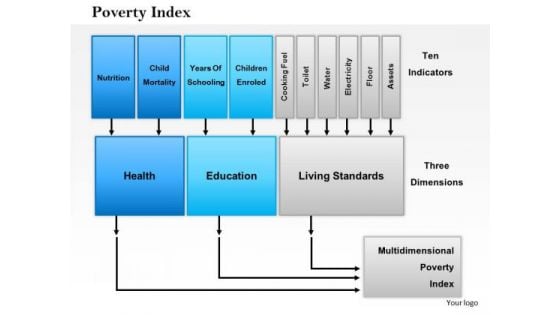
Business Framework Poverty Index PowerPoint Presentation
A linear growth chart with text boxes has been used to decorate this Power Point template slide. This diagram slide contains the concept of poverty index. Use this index in your financial presentations to show poverty based calculation.
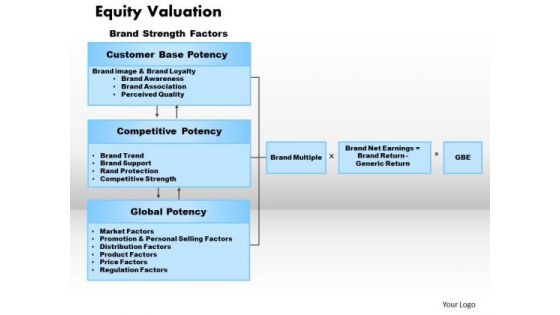
Business Framework Equity Valuation PowerPoint Presentation
This business framework Power Point template diagram has been crafted with graphic of three stage diagram. This PPT diagram contains the concept of equity valuation. Use this PPT diagram for your financial system related presentations.
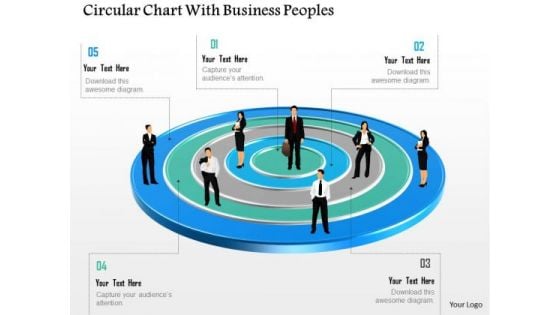
Business Diagram Circular Chart With Business Peoples Presentation Template
This business diagram has been designed with graphic of business people on circular chart. This diagram is designed to depict team meeting on financial matter. This diagram offers a way for your audience to visually conceptualize the process.
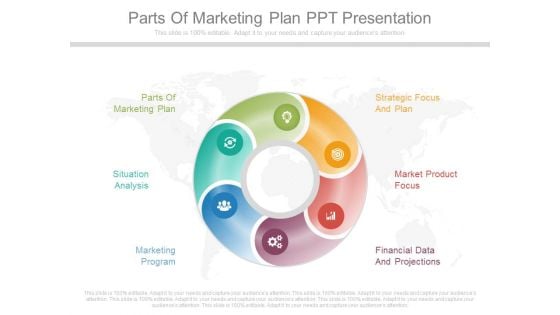
Parts Of Marketing Plan Ppt Presentation
This is a parts of marketing plan ppt presentation. This is a six stage process. The stages in this process are parts of marketing plan, strategic focus and plan, situation analysis, market product focus, marketing program, financial data and projections.
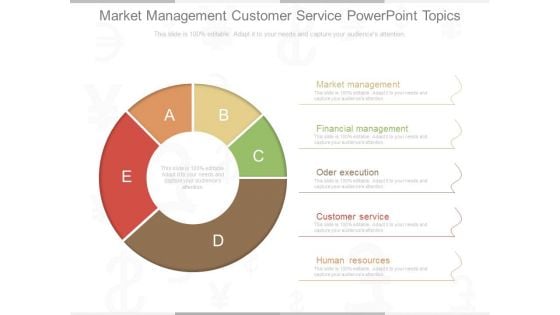
Market Management Customer Service Powerpoint Topics
This is a market management customer service powerpoint topics. This is a five stage process. The stages in this process are market management, financial management, oder execution, customer service, human resources.
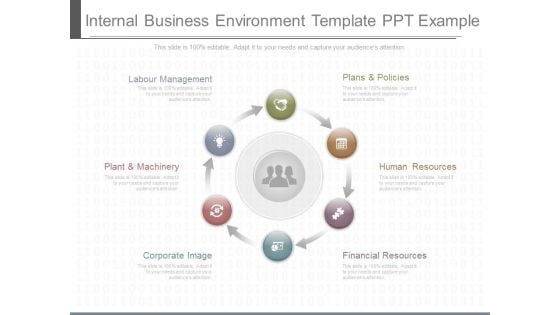
Internal Business Environment Template Ppt Example
This is an internal business environment template ppt example. This is a six stage process. The stages in this process are plans and policies, human resources, financial resources, corporate image, plant and machinery, lab our management.
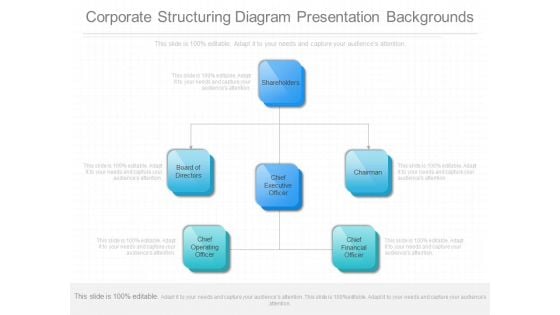
Corporate Structuring Diagram Presentation Backgrounds
This is a corporate structuring diagram presentation backgrounds. This is a three stage process. The stages in this process are shareholders, board of directors, chief executive officer, chairman, chief operating officer, chief financial officer.
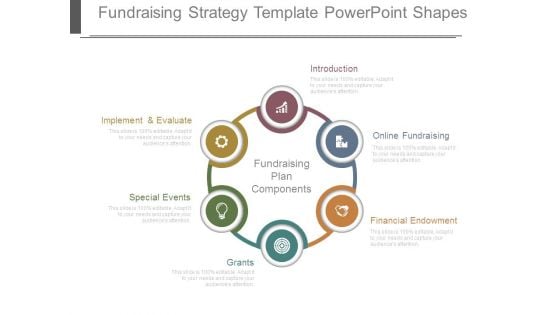
Fundraising Strategy Template Powerpoint Shapes
This is a fundraising strategy template powerpoint shapes. This is a six stage process. The stages in this process are implement and evaluate, special events, grants, introduction, online fundraising, financial endowment, fundraising plan components.
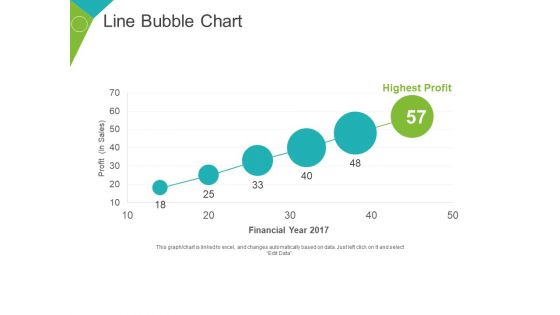
Line Bubble Chart Ppt PowerPoint Presentation Portfolio Slide Portrait
This is a line bubble chart ppt powerpoint presentation portfolio slide portrait. This is a six stage process. The stages in this process are highest profit, financial year, profit in sales, growth, business.
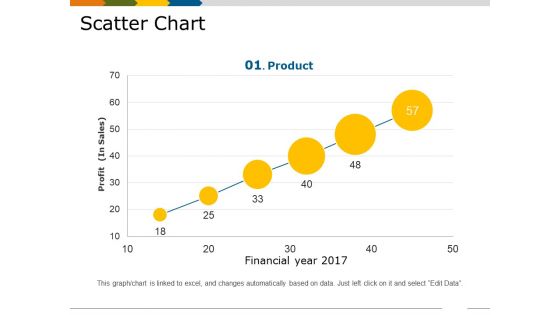
Scatter Chart Template 1 Ppt PowerPoint Presentation Show Slides
This is a scatter chart template 1 ppt powerpoint presentation show slides. This is a six stage process. The stages in this process are financial year, profit in sales, growth, business, marketing, product.
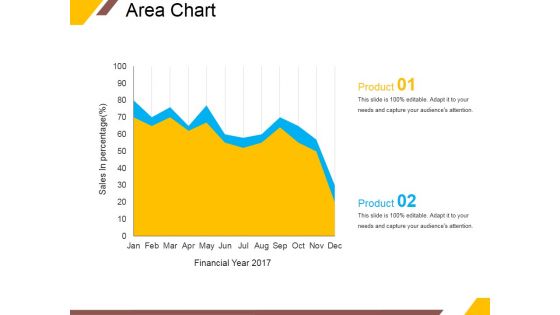
Area Chart Ppt PowerPoint Presentation Layouts Vector
This is a area chart ppt powerpoint presentation layouts vector. This is a two stage process. The stages in this process are area chart, product, sales in percentage, financial year.
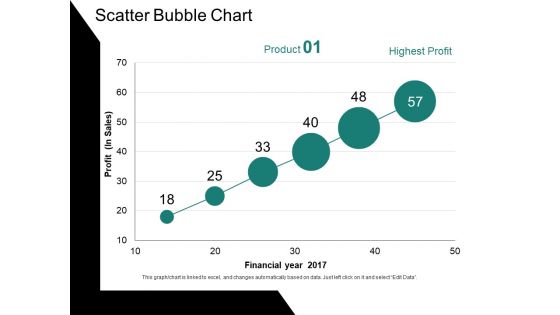
Scatter Bubble Chart Ppt PowerPoint Presentation Ideas Gallery
This is a scatter bubble chart ppt powerpoint presentation ideas gallery. This is a six stage process. The stages in this process are profit, financial year, chart, business, growth.
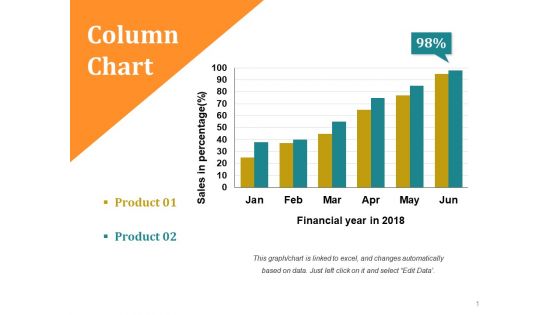
Column Chart Ppt PowerPoint Presentation Slides Smartart
This is a column chart ppt powerpoint presentation slides smartart. This is a two stage process. The stages in this process are sales in percentage, financial year in, business, growth, strategy.
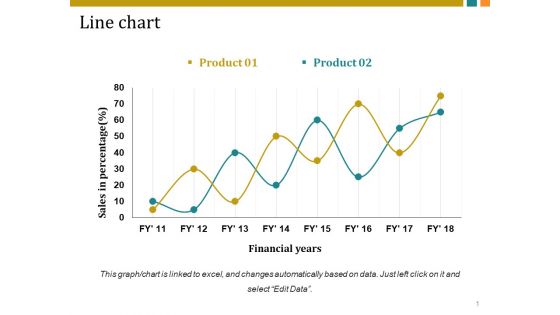
Line Chart Ppt PowerPoint Presentation Inspiration Vector
This is a line chart ppt powerpoint presentation inspiration vector. This is a two stage process. The stages in this process are sales in percentage, financial years, business, marketing, growth.

Line Chart Ppt PowerPoint Presentation Infographics Graphic Images
This is a line chart ppt powerpoint presentation infographics graphic images. This is a two stage process. The stages in this process are sales in percentage, financial years, growth, business, marketing.
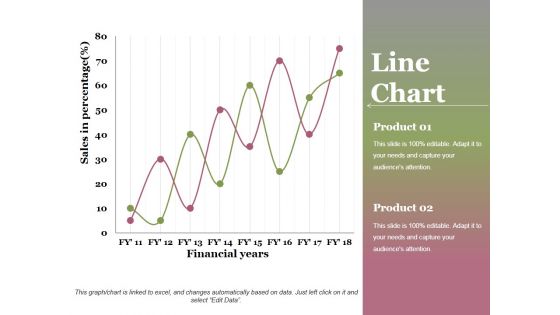
Line Chart Ppt PowerPoint Presentation Professional Graphics Design
This is a line chart ppt powerpoint presentation professional graphics design. This is a two stage process. The stages in this process are financial years, sales in percentage, product, growth, success.
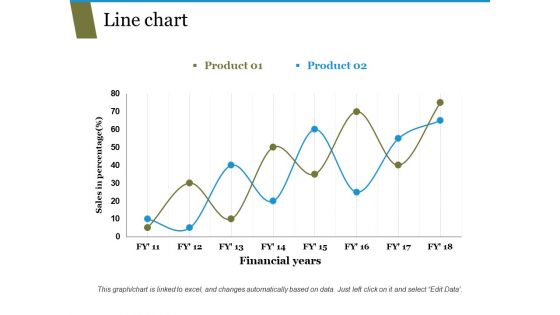
Line Chart Ppt PowerPoint Presentation Pictures Templates
This is a line chart ppt powerpoint presentation pictures templates. This is a two stage process. The stages in this process are sales in percentage, financial years, business, marketing, growth.
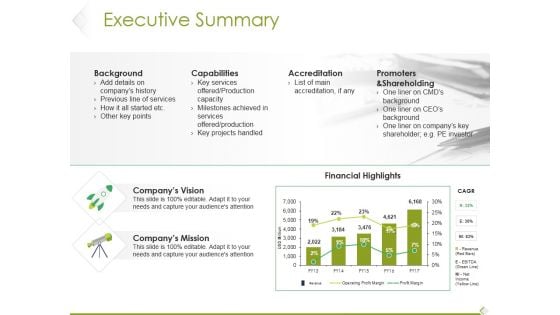
Executive Summary Ppt PowerPoint Presentation Model Show
This is a executive summary ppt powerpoint presentation model show. This is a five stage process. The stages in this process are background, capabilities, accreditation, promoters and shareholding, financial highlights.
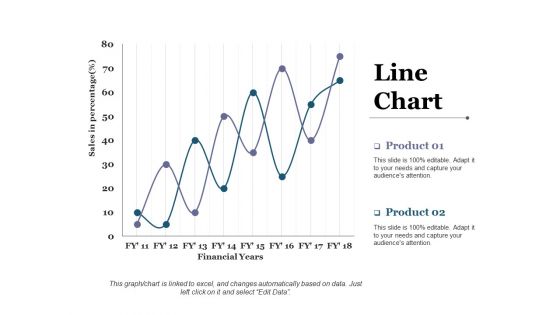
Line Chart Ppt PowerPoint Presentation Styles Themes
This is a line chart ppt powerpoint presentation styles themes. This is a two stage process. The stages in this process are business, marketing, financial years, sales in percentage.
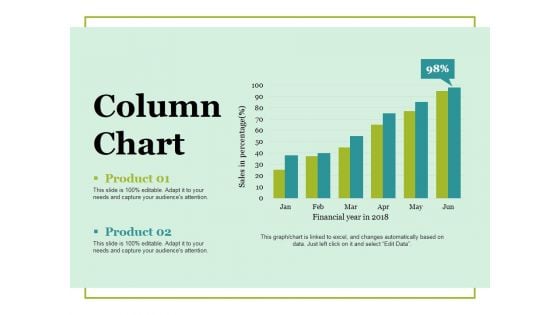
Column Chart Ppt PowerPoint Presentation Ideas Vector
This is a column chart ppt powerpoint presentation ideas vector. This is a two stage process. The stages in this process are column chart, product, financial years, sales in percentage, growth.
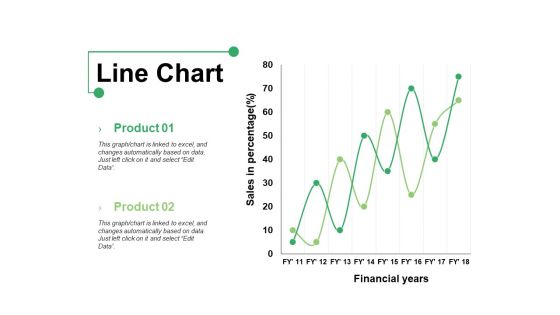
Line Chart Ppt PowerPoint Presentation Show Graphics Example
This is a line chart ppt powerpoint presentation show graphics example. This is a two stage process. The stages in this process are product, line chart, financial years, sales in percentage.
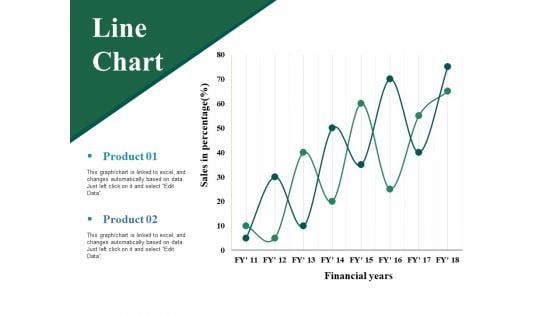
Line Chart Ppt PowerPoint Presentation Professional Grid
This is a line chart ppt powerpoint presentation professional grid. This is a two stage process. The stages in this process are sales in percentage, financial years, product, line chart.
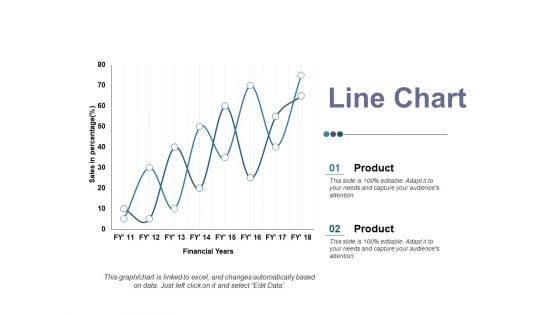
Line Chart Ppt PowerPoint Presentation Ideas Elements
This is a line chart ppt powerpoint presentation ideas elements. This is a two stage process. The stages in this process are product, sales in percentage, financial year, business, line chart.
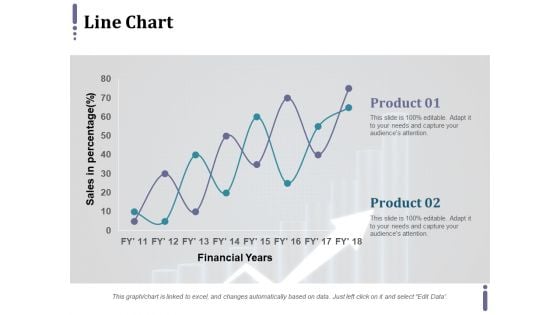
Line Chart Ppt PowerPoint Presentation Infographic Template Master Slide
This is a line chart ppt powerpoint presentation infographic template master slide. This is a two stage process. The stages in this process are product, financial years, sales in percentage.
Area Chart Ppt PowerPoint Presentation Icon Summary
This is a area chart ppt powerpoint presentation icon summary. This is a two stage process. The stages in this process are financial year, area chart, in percentage, product.
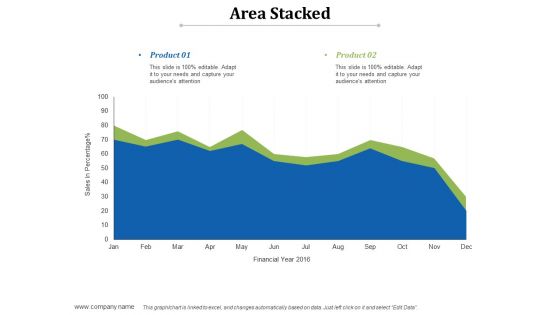
Area Stacked Ppt PowerPoint Presentation Infographics Shapes
This is a area stacked ppt powerpoint presentation infographics shapes. This is a two stage process. The stages in this process are product, area stacked, sales in percentage, financial year.
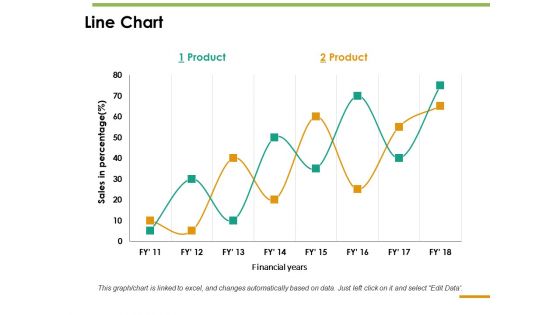
Line Chart Ppt PowerPoint Presentation Inspiration Guide
This is a line chart ppt powerpoint presentation inspiration guide. This is a two stage process. The stages in this process are line chart, sales in percentage, product, financial years.


 Continue with Email

 Home
Home


