Financial Icons
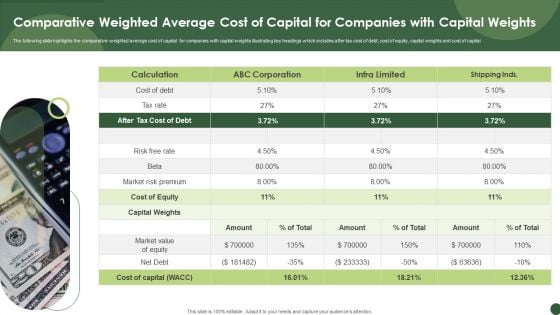
Comparative Weighted Average Cost Of Capital For Companies With Capital Weights Guidelines PDF
The following slide highlights the comparative weighted average cost of capital for companies with capital weights illustrating key headings which includes after tax cost of debt, cost of equity, capital weights and cost of capital.Presenting Comparative Weighted Average Cost Of Capital For Companies With Capital Weights Guidelines PDF to dispense important information. This template comprises one stage. It also presents valuable insights into the topics including Capital Weights, Infra Limited, Risk Premium. This is a completely customizable PowerPoint theme that can be put to use immediately. So, download it and address the topic impactfully.
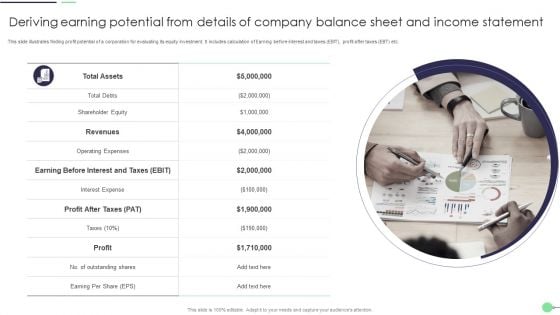
Deriving Earning Potential From Details Of Company Balance Sheet And Income Statement Guidelines PDF
This slide illustrates finding profit potential of a corporation for evaluating its equity investment. It includes calculation of Earning before interest and taxes EBIT, profit after taxes EBT etc. Presenting Deriving Earning Potential From Details Of Company Balance Sheet And Income Statement Guidelines PDF to dispense important information. This template comprises one stages. It also presents valuable insights into the topics including Revenues, Operating Expenses, Profit. This is a completely customizable PowerPoint theme that can be put to use immediately. So, download it and address the topic impactfully.
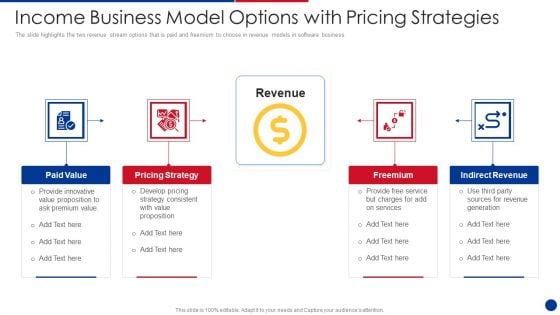
Income Business Model Options With Pricing Strategies Structure PDF
The slide highlights the two revenue stream options that is paid and freemium to choose in revenue models in software business.Presenting Income Business Model Options With Pricing Strategies Structure PDF to dispense important information. This template comprises four stages. It also presents valuable insights into the topics including Paid Value, Pricing Strategy, Indirect Revenue. This is a completely customizable PowerPoint theme that can be put to use immediately. So, download it and address the topic impactfully
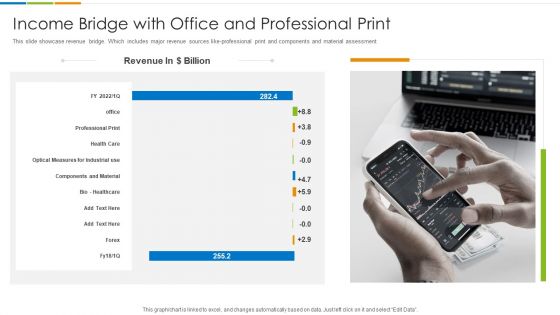
Income Bridge With Office And Professional Print Ppt PowerPoint Presentation File Design Inspiration PDF
This slide showcase revenue bridge. Which includes major revenue sources like-professional print and components and material assessment. Presenting Income Bridge With Office And Professional Print Ppt PowerPoint Presentation File Design Inspiration PDF to dispense important information. This template comprises one stages. It also presents valuable insights into the topics including Revenue Dollar Billion, Components Material, Professional Print. This is a completely customizable PowerPoint theme that can be put to use immediately. So, download it and address the topic impactfully.
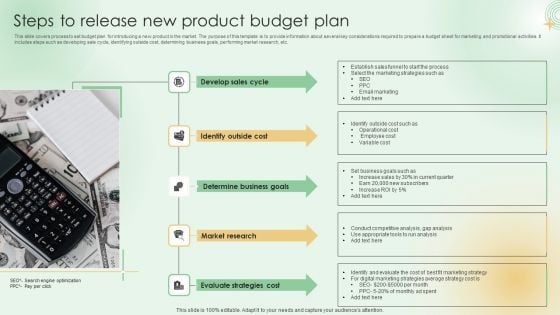
Steps To Release New Product Budget Plan Elements PDF
This slide covers process to set budget plan for introducing a new product in the market. The purpose of this template is to provide information about several key considerations required to prepare a budget sheet for marketing and promotional activities. It includes steps such as developing sale cycle, identifying outside cost, determining business goals, performing market research, etc. Presenting Steps To Release New Product Budget Plan Elements PDF to dispense important information. This template comprises five stages. It also presents valuable insights into the topics including Develop Sales Cycle, Identify Outside Cost, Determine Business Goals. This is a completely customizable PowerPoint theme that can be put to use immediately. So, download it and address the topic impactfully.
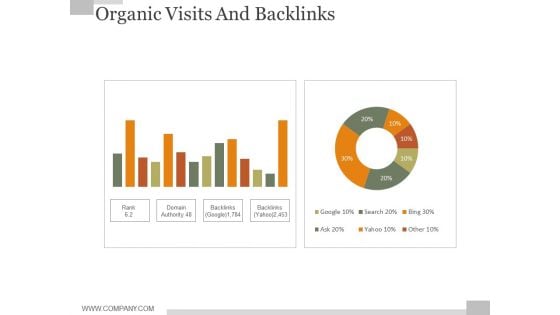
Organic Visits And Backlinks Ppt PowerPoint Presentation Graphics
This is a organic visits and backlinks ppt powerpoint presentation graphics. This is a two stage process. The stages in this process are business, finance, pie chart, marketing, strategy, success.
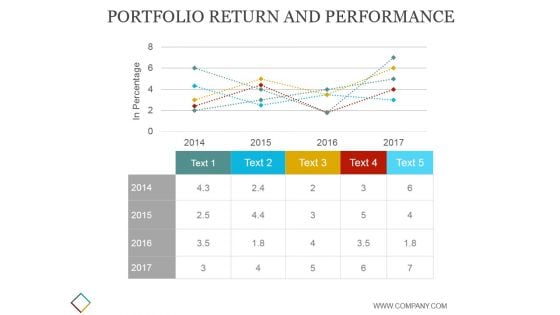
Portfolio Return And Performance Template Ppt PowerPoint Presentation Visuals
This is a portfolio return and performance template ppt powerpoint presentation visuals. This is a five stage process. The stages in this process are business, strategy, marketing, analysis, finance, chart and graph, growth.
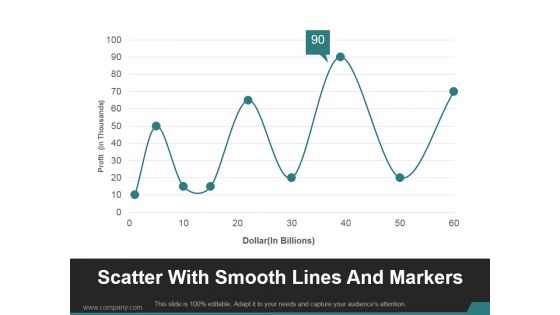
Scatter With Smooth Lines And Markers Ppt PowerPoint Presentation Show
This is a scatter with smooth lines and markers ppt powerpoint presentation show. This is a nine stage process. The stages in this process are business, marketing, line chart, profit, management.
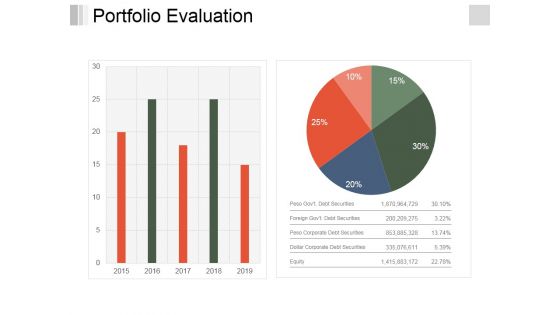
Portfolio Evaluation Ppt PowerPoint Presentation Infographics Objects
This is a portfolio evaluation ppt powerpoint presentation infographics objects. This is a two stage process. The stages in this process are business, finance, bar graph, pie chart, marketing, analysis, investment.
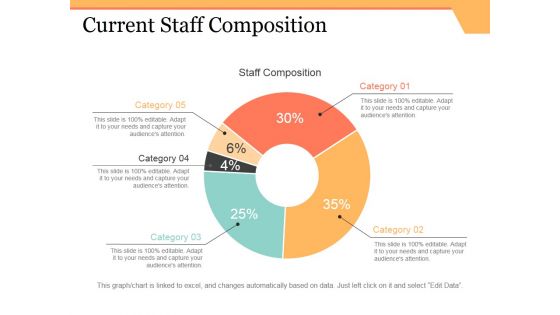
Current Staff Composition Ppt PowerPoint Presentation Layouts Mockup
This is a current staff composition ppt powerpoint presentation layouts mockup. This is a five stage process. The stages in this process are business, pie chart, marketing, strategy, analysis.
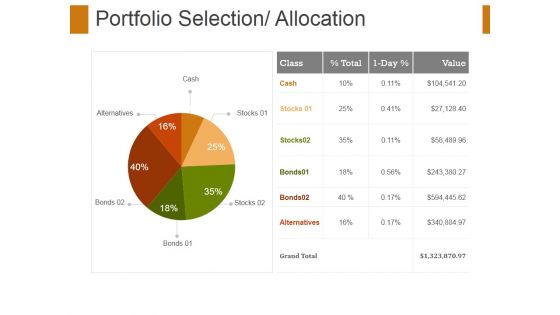
Portfolio Selection Allocation Template 2 Ppt PowerPoint Presentation Layouts Show
This is a portfolio selection allocation template 2 ppt powerpoint presentation layouts show. This is a six stage process. The stages in this process are business, pie chart, finance, marketing, strategy, analysis.
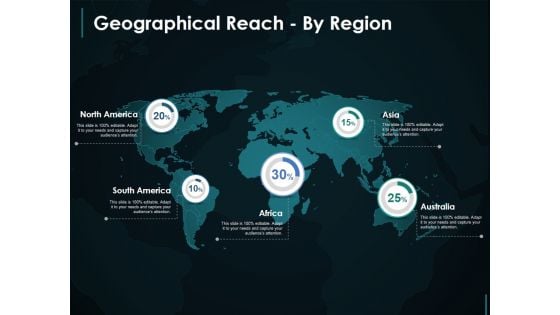
Geographical Reach By Region Template 1 Ppt PowerPoint Presentation Show Picture
This is a geographical reach by region template 1 ppt powerpoint presentation show picture. This is a five stage process. The stages in this process are ocation, geography, information, donut chart, success, finance.
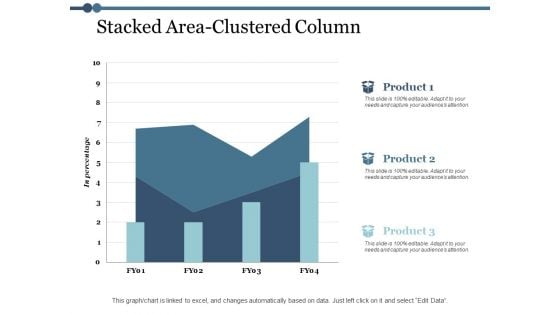
Stacked Area Clustered Column Ppt PowerPoint Presentation Model Topics
This is a stacked area clustered column ppt powerpoint presentation model topics. This is a three stage process. The stages in this process are area chart, finance, marketing, management, investment.
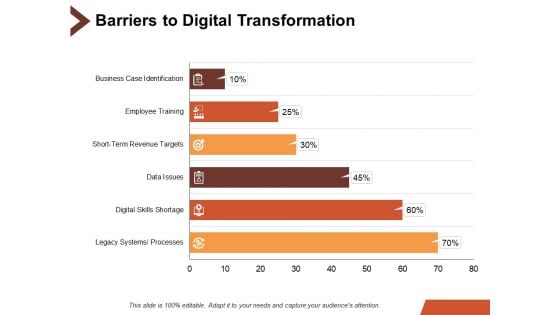
Barriers To Digital Transformation Ppt PowerPoint Presentation Professional Influencers
This is a barriers to digital transformation ppt powerpoint presentation professional influencers. This is a six stage process. The stages in this process are bar chart, finance, marketing, business, analysis.
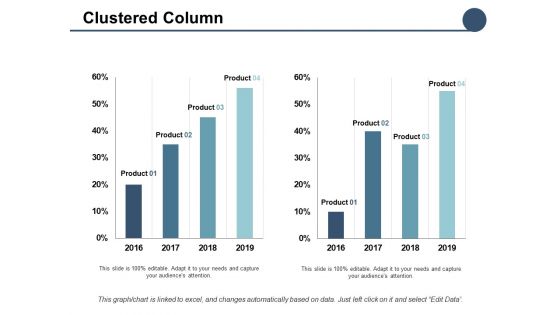
Clustered Column Finance Ppt PowerPoint Presentation Pictures Inspiration
This is a clustered column finance ppt powerpoint presentation pictures inspiration. This is a two stage process. The stages in this process are bar chart, finance, marketing, business, analysis.
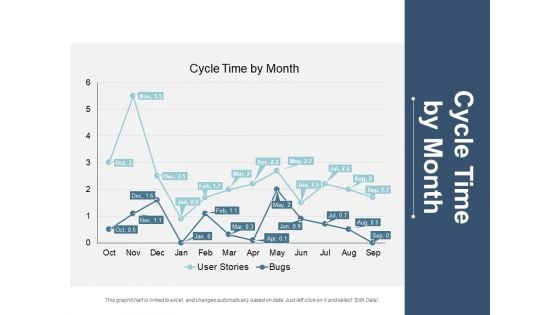
Cycle Time By Month Ppt PowerPoint Presentation Visual Aids Ideas
This is a cycle time by month ppt powerpoint presentation visual aids ideas. This is a two stage process. The stages in this process are line chart, finance, marketing, management, investment.
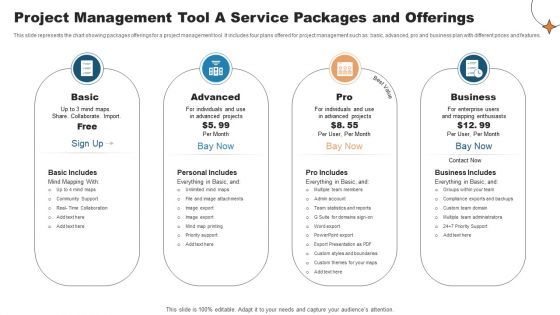
Project Management Tool A Service Packages And Offerings Download PDF
This slide represents the chart showing packages offerings for a project management tool. It includes four plans offered for project management such as basic, advanced, pro and business plan with different prices and features. Presenting Project Management Tool A Service Packages And Offerings Download PDF to dispense important information. This template comprises four stages. It also presents valuable insights into the topics including Multiple Team Members, Business Includes, Enterprise. This is a completely customizable PowerPoint theme that can be put to use immediately. So, download it and address the topic impactfully.
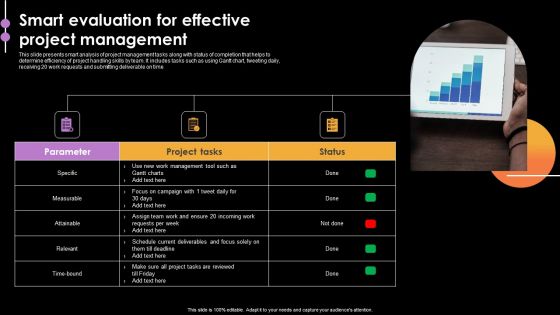
Smart Evaluation For Effective Project Management Professional PDF
This slide presents smart analysis of project management tasks along with status of completion that helps to determine efficiency of project handling skills by team. It includes tasks such as using Gantt chart, tweeting daily, receiving 20 work requests and submitting deliverable on time. Presenting Smart Evaluation For Effective Project Management Professional PDF to dispense important information. This template comprises one stages. It also presents valuable insights into the topics including Specific, Measurable, Achievable. This is a completely customizable PowerPoint theme that can be put to use immediately. So, download it and address the topic impactfully.
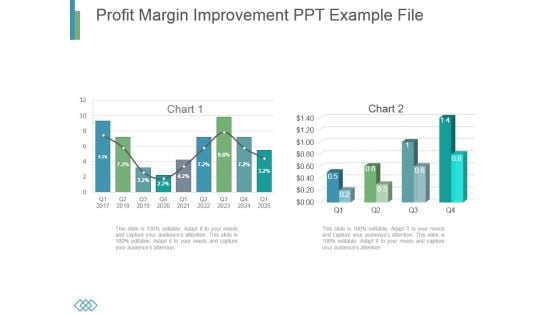
Profit Margin Improvement Ppt Example File
This is a profit margin improvement ppt example file. This is a two stage process. The stages in this process are business, marketing, growth, timeline, analysis.
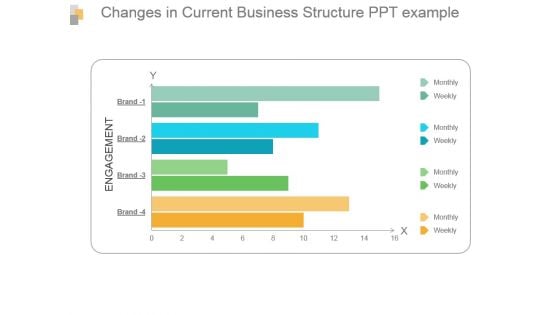
Changes In Current Business Structure Ppt Example
This is a changes in current business structure ppt example. This is a four stage process. The stages in this process are engagement, monthly, weekly, brand.
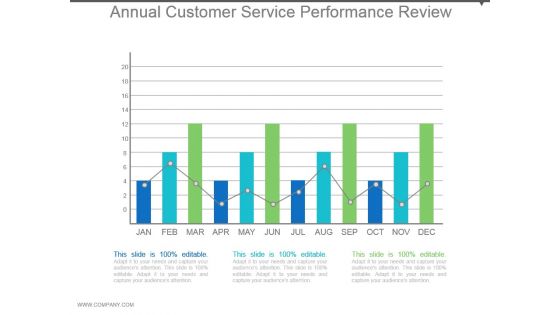
Annual Customer Service Performance Review Example Of Ppt
This is a annual customer service performance review example of ppt. This is a twelve stage process. The stages in this process are bar graph, growth, data, customer, success.
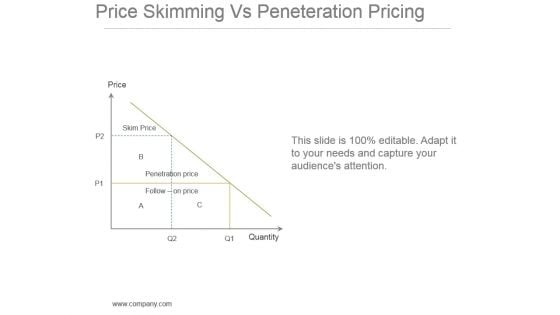
Price Skimming Vs Peneteration Pricing Powerpoint Slides
This is a price skimming vs peneteration pricing powerpoint slides. This is a two stage process. The stages in this process are price, skim price, penetration price, quantity.
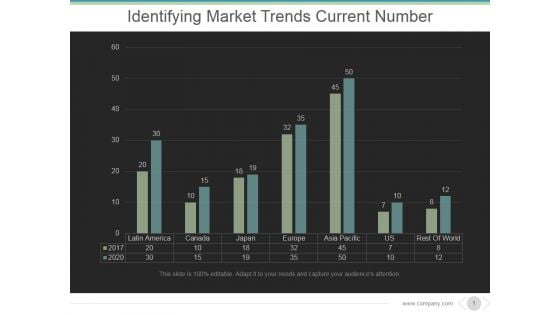
Identifying Market Trends Current Number Ppt PowerPoint Presentation Slides
This is a identifying market trends current number ppt powerpoint presentation slides. This is a seven stage process. The stages in this process are latin america, canada, japan, europe, asia pacific, us.
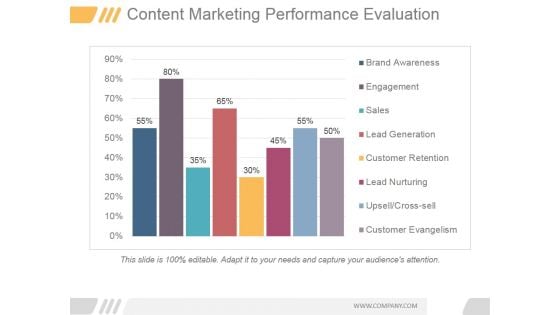
Content Marketing Performance Evaluation Ppt PowerPoint Presentation Influencers
This is a content marketing performance evaluation ppt powerpoint presentation influencers. This is a eight stage process. The stages in this process are brand awareness, engagement, sales, lead generation, customer retention, lead nurturing.
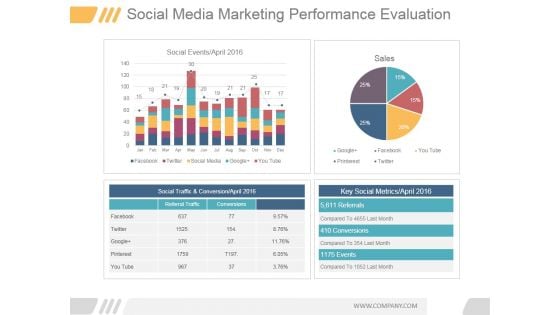
Social Media Marketing Performance Evaluation Ppt PowerPoint Presentation Guidelines
This is a social media marketing performance evaluation ppt powerpoint presentation guidelines. This is a four stage process. The stages in this process are social event april, facebook, twitter, social media, google, you tube.
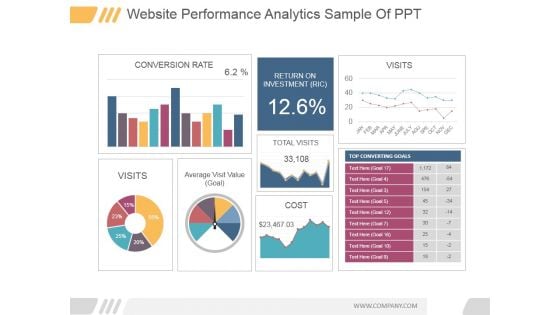
Website Performance Analytics Ppt PowerPoint Presentation Show
This is a website performance analytics ppt powerpoint presentation show. This is a three stage process. The stages in this process are conversion rate, visits, average visit value goal, return on investment ric, total visits, cost.
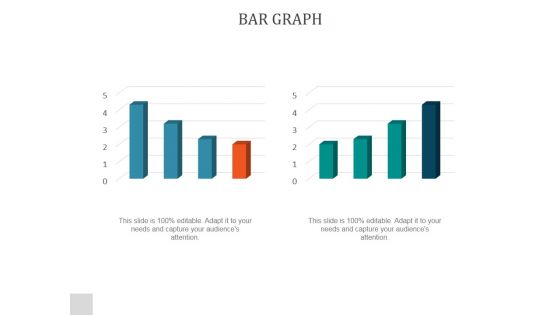
Bar Graph Ppt PowerPoint Presentation Example 2015
This is a bar graph ppt powerpoint presentation example 2015. This is a two stage process. The stages in this process are bar graph, finance, marketing, analysis, business.
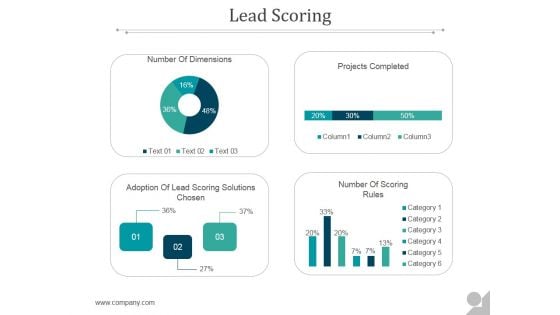
Lead Scoring Ppt PowerPoint Presentation Layouts
This is a lead scoring ppt powerpoint presentation layouts. This is a four stage process. The stages in this process are lead, business, bar graph, marketing, management.
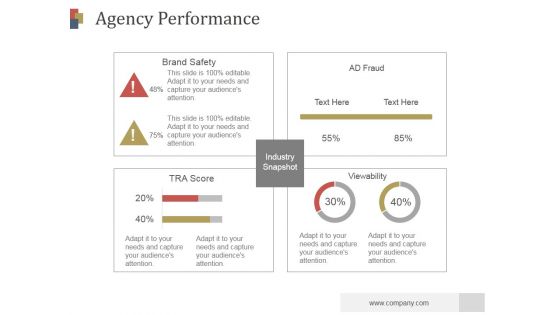
Agency Performance Ppt PowerPoint Presentation Model
This is a agency performance ppt powerpoint presentation model. This is a four stage process. The stages in this process are brand safety, ad fraud, tra score, view ability.
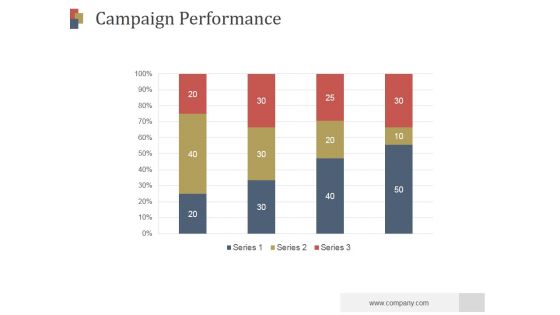
Campaign Performance Ppt PowerPoint Presentation Deck
This is a campaign performance ppt powerpoint presentation deck. This is a four stage process. The stages in this process are business, bar graph, strategy, growth, success.
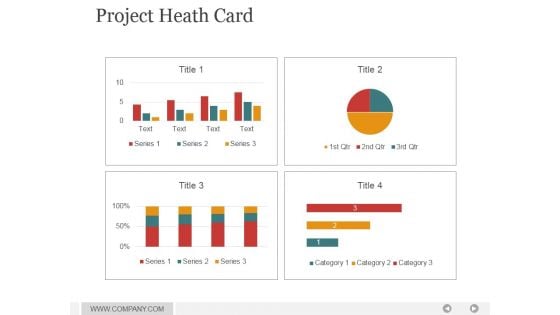
Project Heath Card Ppt PowerPoint Presentation Deck
This is a project heath card ppt powerpoint presentation deck. This is a four stage process. The stages in this process are business, finance, analysis, marketing, analysis.
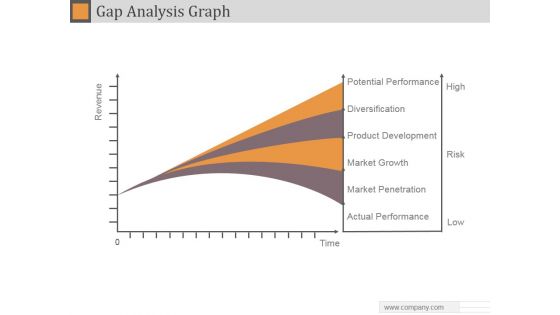
Gap Analysis Graph Ppt PowerPoint Presentation Example 2015
This is a gap analysis graph ppt powerpoint presentation example 2015. This is a four stage process. The stages in this process are potential performance, diversification, product development, market growth, market penetration, actual performance.

Demand Forecasting Ppt PowerPoint Presentation Guidelines
This is a demand forecasting ppt powerpoint presentation guidelines. This is a one stage process. The stages in this process are dynamic demand, trend, stable demand, demand quantity.

Demand Forecasting Template 1 Ppt PowerPoint Presentation Show
This is a demand forecasting template 1 ppt powerpoint presentation show. This is a nine stage process. The stages in this process are trends, base forecast, seasonality factors, qualitative input.
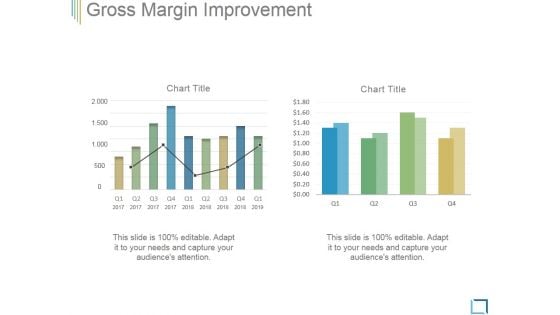
Gross Margin Improvement Ppt PowerPoint Presentation Guidelines
This is a gross margin improvement ppt powerpoint presentation guidelines. This is a two stage process. The stages in this process are business, bar graph, investment, marketing, strategy, success.
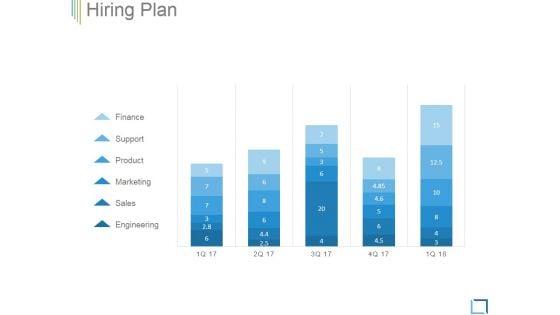
Hiring Plan Ppt PowerPoint Presentation Graphics
This is a hiring plan ppt powerpoint presentation graphics. This is a five stage process. The stages in this process are finance, support, product, marketing, sales, engineering .
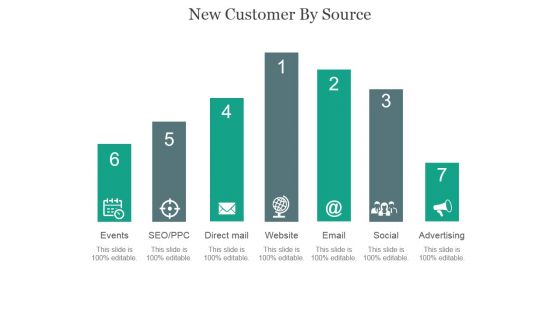
New Customer By Source Ppt PowerPoint Presentation Example 2015
This is a new customer by source ppt powerpoint presentation example 2015. This is a seven stage process. The stages in this process are events, seo ppc, direct mail, website, email, social, advertising.
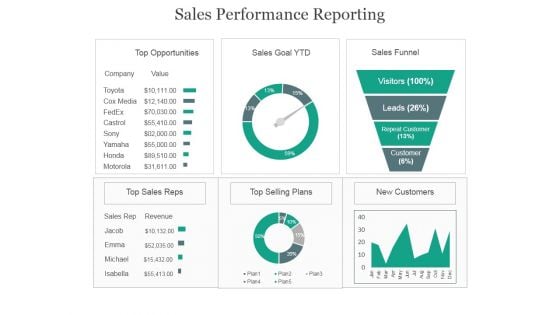
Sales Performance Reporting Ppt PowerPoint Presentation Model
This is a sales performance reporting ppt powerpoint presentation model. This is a six stage process. The stages in this process are top opportunities, sales goal ytd, sales funnel, top sales reps, top selling plans, new customers.
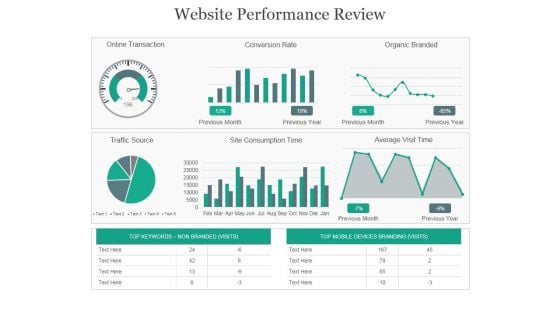
Website Performance Review Ppt PowerPoint Presentation Background Images
This is a website performance review ppt powerpoint presentation background images. This is a three stage process. The stages in this process are online transaction, conversion rate, organic branded, traffic source, site consumption time.
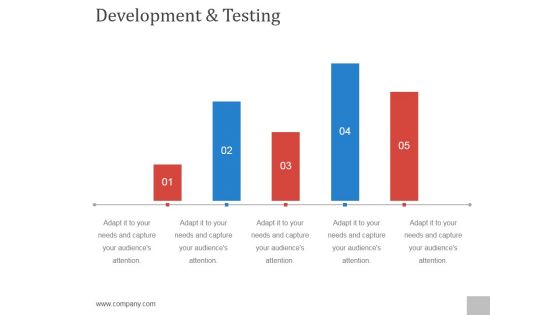
Development And Testing Ppt PowerPoint Presentation Background Designs
This is a development and testing ppt powerpoint presentation background designs. This is a five stage process. The stages in this process are step, business, growth, success, bar graph.
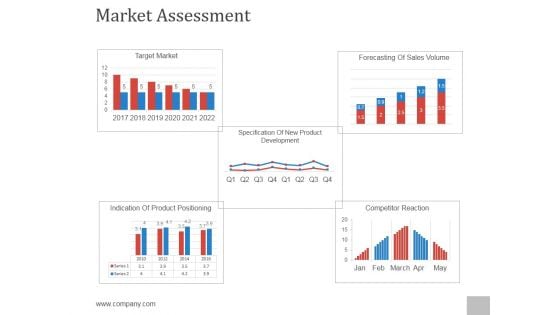
Market Assessment Ppt PowerPoint Presentation Files
This is a market assessment ppt powerpoint presentation files. This is a five stage process. The stages in this process are target market, forecasting of sales volume, indication of product positioning, competitor reaction, specification of new product development.
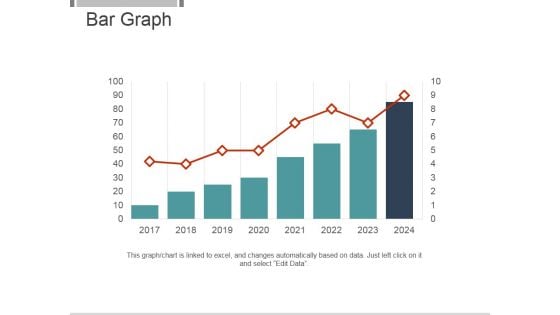
Bar Graph Ppt PowerPoint Presentation Designs Download
This is a bar graph ppt powerpoint presentation designs download. This is a eight stage process. The stages in this process are bar graph, business, strategy, management, marketing.
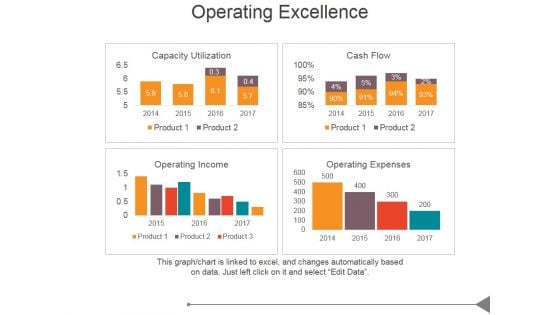
Operating Excellence Ppt PowerPoint Presentation Show
This is a operating excellence ppt powerpoint presentation show. This is a four stage process. The stages in this process are capacity utilization, cash flow, operating income, operating expenses.
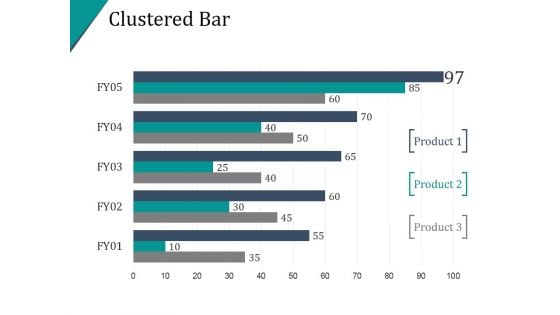
Clustered Bar Ppt PowerPoint Presentation Inspiration
This is a clustered bar ppt powerpoint presentation inspiration. This is a five stage process. The stages in this process are bar graph, business, marketing, finance, percentage.
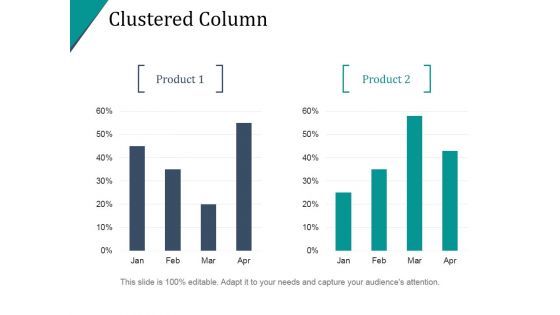
Clustered Column Ppt PowerPoint Presentation Infographic Template
This is a clustered column ppt powerpoint presentation infographic template. This is a two stage process. The stages in this process are finance, percentage, bar graph, business, marketing.

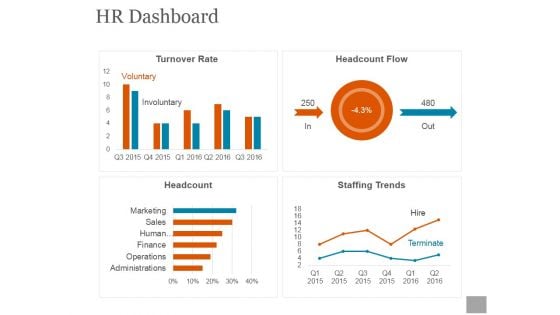
Hr Dashboard Template Ppt PowerPoint Presentation Deck
This is a hr dashboard template ppt powerpoint presentation deck. This is a four stage process. The stages in this process are turnover rate, headcount flow, headcount, staffing trends.
Hr Dashboard Ppt PowerPoint Presentation Shapes
This is a hr dashboard ppt powerpoint presentation shapes. This is a four stage process. The stages in this process are total employees, key metrics, employee churn, open positions by divisions.
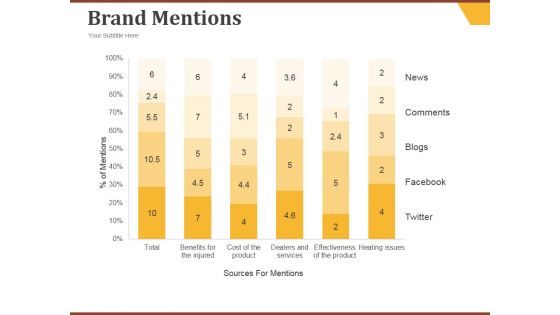
Brand Mentions Ppt PowerPoint Presentation Styles
This is a brand mentions ppt powerpoint presentation styles. This is a six stage process. The stages in this process are news, comments, blogs, facebook, twitter.
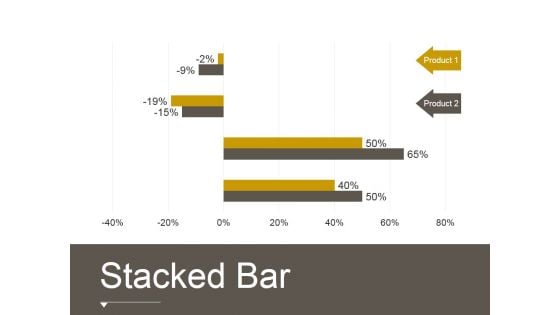
Stacked Bar Template 2 Ppt PowerPoint Presentation Deck
This is a stacked bar template 2 ppt powerpoint presentation deck. This is a two stage process. The stages in this process are business, strategy, analysis, marketing, finance.
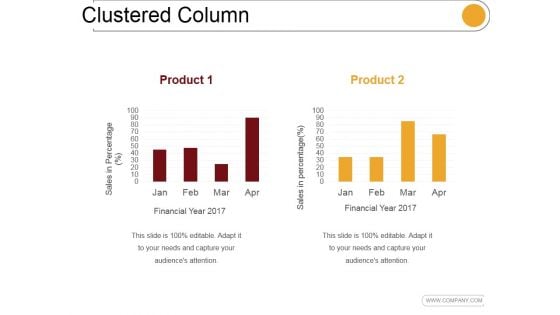
Clustered Column Ppt PowerPoint Presentation Guidelines
This is a clustered column ppt powerpoint presentation guidelines. This is a two stage process. The stages in this process are product, jan, feb, mar, apr.
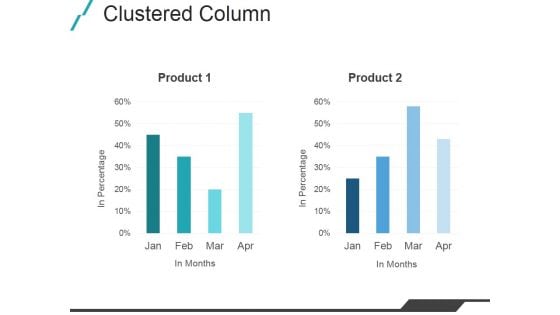
Clustered Column Ppt PowerPoint Presentation Picture
This is a clustered column ppt powerpoint presentation picture. This is a two stage process. The stages in this process are product, jan, feb, mar, apr.
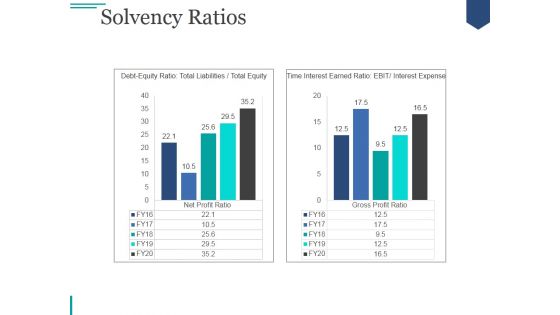
Solvency Ratios Ppt PowerPoint Presentation Example 2015
This is a solvency ratios ppt powerpoint presentation example 2015. This is a two stage process. The stages in this process are debt equity ratio, total liabilities, total equity.
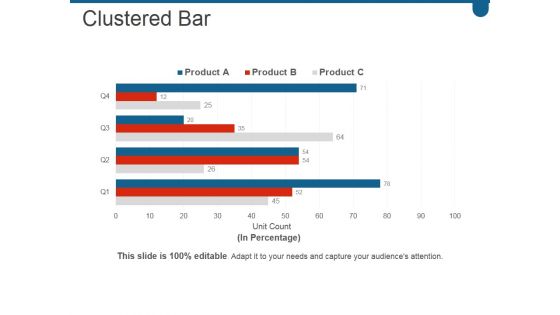
Clustered Bar Ppt PowerPoint Presentation Slide Download
This is a clustered bar ppt powerpoint presentation slide download. This is a four stage process. The stages in this process are bar, graph, business, marketing, strategy.
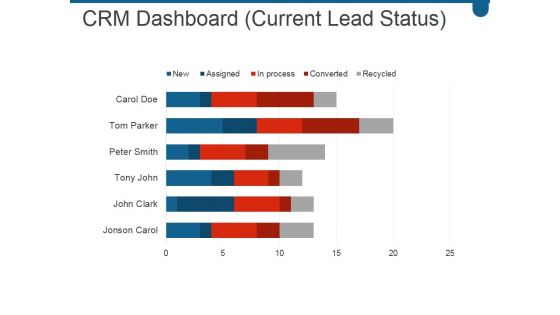
Crm Dashboard Current Lead Status Ppt PowerPoint Presentation Graphics
This is a crm dashboard current lead status ppt powerpoint presentation graphics. This is a six stage process. The stages in this process are carol doe, tom parker, peter smith, tony john, john clark.
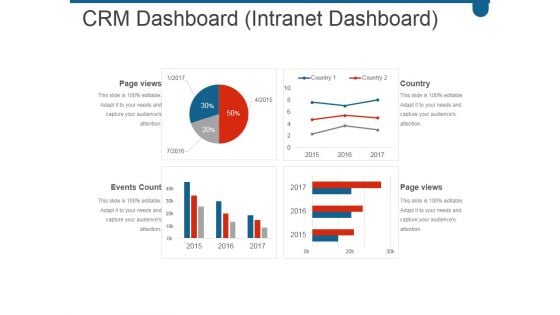
Crm Dashboard Intranet Dashboard Ppt PowerPoint Presentation Sample
This is a crm dashboard intranet dashboard ppt powerpoint presentation sample. This is a four stage process. The stages in this process are page views, events count, country, page views.
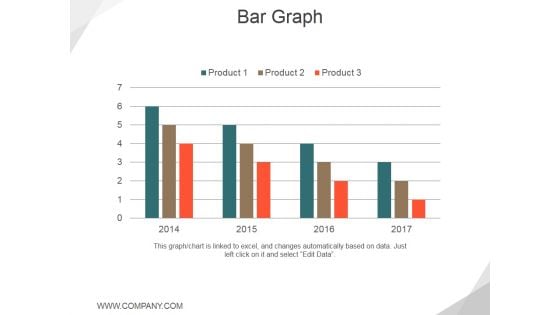
Bar Graph Ppt PowerPoint Presentation Layouts Graphic Images
This is a bar graph ppt powerpoint presentation layouts graphic images. This is a four stage process. The stages in this process are product, business, marketing, growth.

Real Estate Home Price Index Ppt PowerPoint Presentation Styles Influencers
This is a real estate home price index ppt powerpoint presentation styles influencers. This is a one stage process. The stages in this process are graph, growth, jan, feb, mar apr.
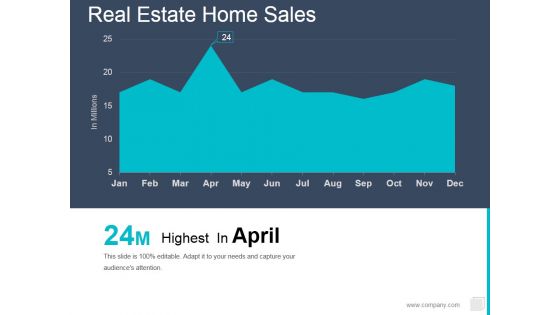
Real Estate Home Sales Ppt PowerPoint Presentation Professional Graphic Tips
This is a real estate home sales ppt powerpoint presentation professional graphic tips. This is a one stage process. The stages in this process are jan, feb, mar, apr, may, graph.
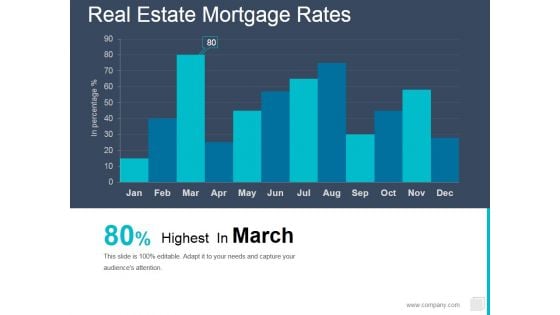
Real Estate Mortgage Rates Ppt PowerPoint Presentation Professional Introduction
This is a real estate mortgage rates ppt powerpoint presentation professional introduction. This is a twelve stage process. The stages in this process are jan, feb, mar, apr, may.
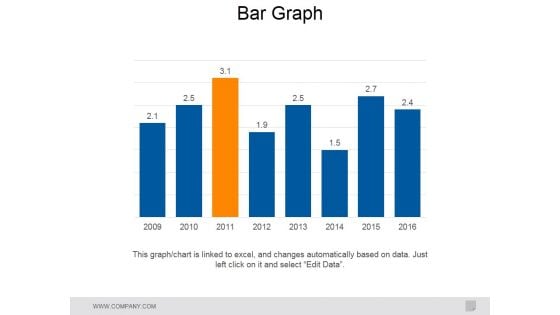
Bar Graph Ppt PowerPoint Presentation Slides Model
This is a bar graph ppt powerpoint presentation slides model. This is a eight stage process. The stages in this process are business, marketing, bar graph, management, timeline.


 Continue with Email

 Home
Home


