Financial Kpis
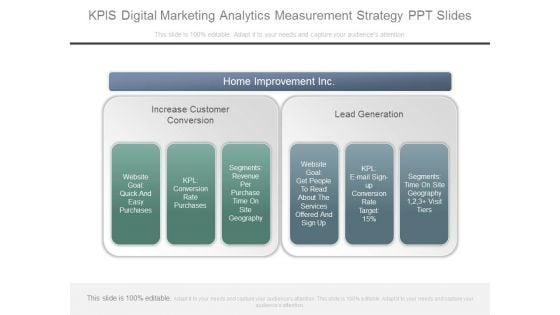
Kpis Digital Marketing Analytics Measurement Strategy Ppt Slides
This is a kpis digital marketing analytics measurement strategy ppt slides. This is a six stage process. The stages in this process are home improvement inc, increase customer conversion, lead generation, website goal quick and easy purchases, kpl conversion rate purchases, segments revenue per purchase time on site geography, website goal get people to read about the services offered and sign up, kpl e mail sign up conversion rate target 15 percentage, segments, time on site geography visit tiers. \n
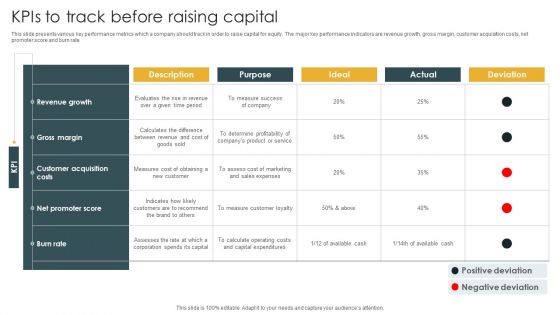
Kpis To Track Before Raising Capital Portrait PDF
This slide presents various key performance metrics which a company should track in order to raise capital for equity. The major key performance indicators are revenue growth, gross margin, customer acquisition costs, net promoter score and burn rate. Pitch your topic with ease and precision using this Kpis To Track Before Raising Capital Portrait PDF. This layout presents information on Net Promoter Score, Customer Acquisition Costs, Gross Margin. It is also available for immediate download and adjustment. So, changes can be made in the color, design, graphics or any other component to create a unique layout.
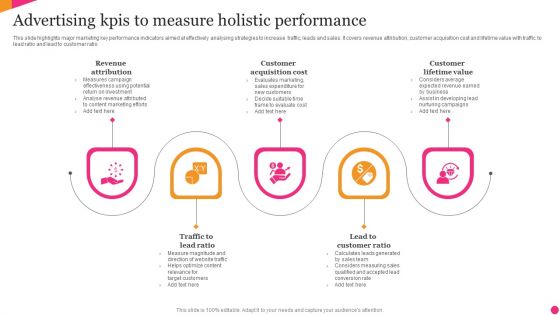
Advertising Kpis To Measure Holistic Performance Structure PDF
This slide highlights major marketing key performance indicators aimed at effectively analysing strategies to increase traffic, leads and sales. It covers revenue attribution, customer acquisition cost and lifetime value with traffic to lead ratio and lead to customer ratio. Persuade your audience using this Advertising Kpis To Measure Holistic Performance Structure PDF. This PPT design covers five stages, thus making it a great tool to use. It also caters to a variety of topics including Revenue Attribution, Customer Acquisition Cost, Customer Lifetime Value. Download this PPT design now to present a convincing pitch that not only emphasizes the topic but also showcases your presentation skills.
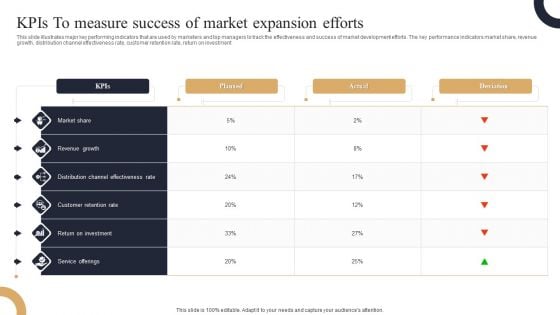
Kpis To Measure Success Of Market Expansion Efforts Portrait PDF
This slide illustrates major key performing indicators that are used by marketers and top managers to track the effectiveness and success of market development efforts. The key performance indicators market share, revenue growth, distribution channel effectiveness rate, customer retention rate, return on investment. Showcasing this set of slides titled Kpis To Measure Success Of Market Expansion Efforts Portrait PDF. The topics addressed in these templates are Revenue Growth, Market Share, Return On Investment. All the content presented in this PPT design is completely editable. Download it and make adjustments in color, background, font etc. as per your unique business setting.
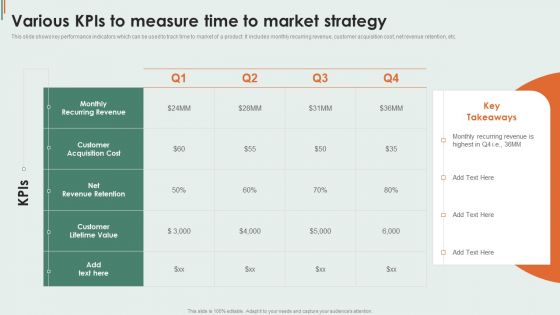
Various Kpis To Measure Time To Market Strategy Infographics PDF
This slide shows key performance indicators which can be used to track time to market of a product. It includes monthly recurring revenue, customer acquisition cost, net revenue retention, etc. Showcasing this set of slides titled Various Kpis To Measure Time To Market Strategy Infographics PDF. The topics addressed in these templates are Customer Acquisition, Customer Lifetime, Monthly Recurring. All the content presented in this PPT design is completely editable. Download it and make adjustments in color, background, font etc. as per your unique business setting.
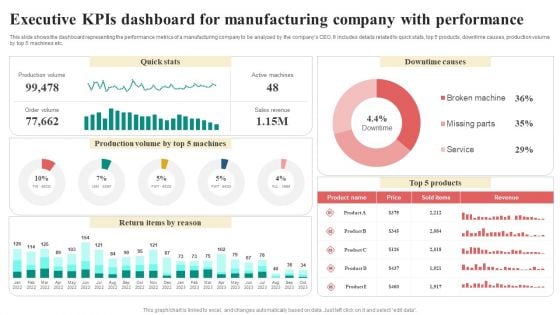
Executive Kpis Dashboard For Manufacturing Company With Performance Infographics PDF
This slide shows the dashboard representing the performance metrics of a manufacturing company to be analyzed by the companys CEO. It includes details related to quick stats, top 5 products, downtime causes, production volume by top 5 machines etc. Showcasing this set of slides titled Executive Kpis Dashboard For Manufacturing Company With Performance Infographics PDF. The topics addressed in these templates are Return Items By Reason, Quick Stats, Downtime Causes, Revenue. All the content presented in this PPT design is completely editable. Download it and make adjustments in color, background, font etc. as per your unique business setting.
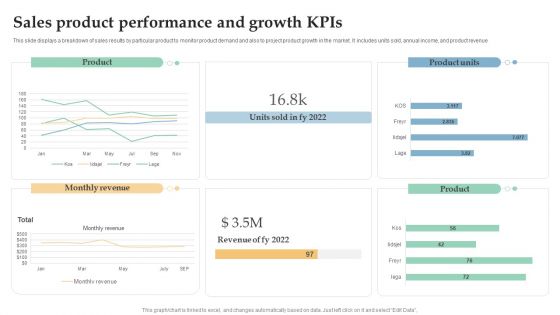
Sales Product Performance And Growth Kpis Ppt Layouts Mockup PDF
This slide displays a breakdown of sales results by particular product to monitor product demand and also to project product growth in the market. It includes units sold, annual income, and product revenue. Pitch your topic with ease and precision using this Sales Product Performance And Growth Kpis Ppt Layouts Mockup PDF. This layout presents information on Monthly Revenue, Product, Product Units. It is also available for immediate download and adjustment. So, changes can be made in the color, design, graphics or any other component to create a unique layout.
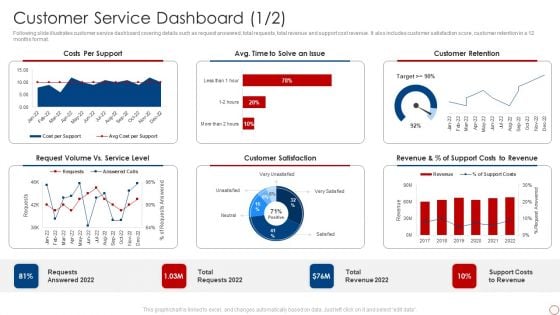
Kpis For Evaluating Business Sustainability Customer Service Dashboard Designs PDF
Following slide illustrates customer service dashboard covering details such as request answered, total requests, total revenue and support cost revenue. It also includes customer satisfaction score, customer retention in a 12 months format. Deliver and pitch your topic in the best possible manner with this Kpis For Evaluating Business Sustainability Customer Service Dashboard Designs PDF. Use them to share invaluable insights on Costs Per Support, Customer Retention, Customer Satisfaction and impress your audience. This template can be altered and modified as per your expectations. So, grab it now.
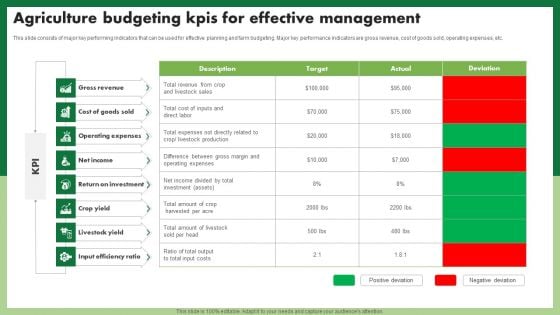
Agriculture Budgeting Kpis For Effective Management Professional PDF
This slide consists of major key performing indicators that can be used for effective planning and farm budgeting. Major key performance indicators are gross revenue, cost of goods sold, operating expenses, etc. Pitch your topic with ease and precision using this Agriculture Budgeting Kpis For Effective Management Professional PDF. This layout presents information on Gross Revenue, Operating Expenses, Net Income. It is also available for immediate download and adjustment. So, changes can be made in the color, design, graphics or any other component to create a unique layout.
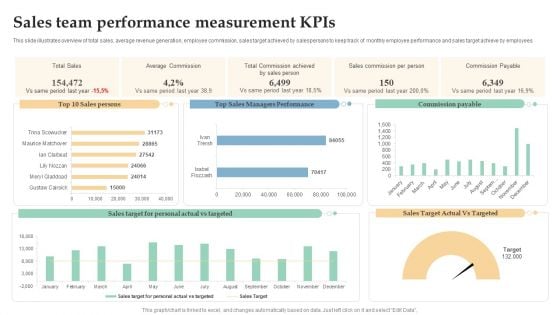
Sales Team Performance Measurement Kpis Ppt Professional Templates PDF
This slide illustrates overview of total sales, average revenue generation, employee commission, sales target achieved by salespersons to keep track of monthly employee performance and sales target achieve by employees. Showcasing this set of slides titled Sales Team Performance Measurement Kpis Ppt Professional Templates PDF. The topics addressed in these templates are Total Sales, Average Commission, Sales Commission, Per Person. All the content presented in this PPT design is completely editable. Download it and make adjustments in color, background, font etc. as per your unique business setting.
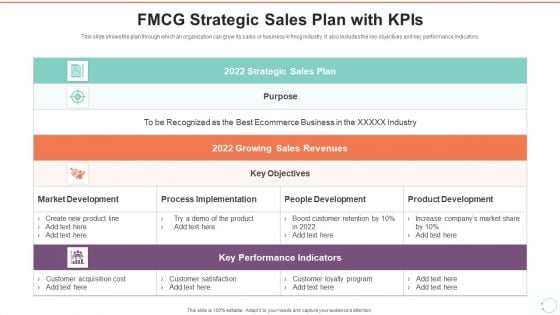
FMCG Strategic Sales Plan With Kpis Template PDF
This slide shows the plan through which an organization can grow its sales or business in fmcg industry. It also includes the key objectives and key performance indicators. Showcasing this set of slides titled FMCG Strategic Sales Plan With Kpis Template PDF The topics addressed in these templates are Strategic Sales Plan, Growing Sales Revenues, Key Performance Indicators All the content presented in this PPT design is completely editable. Download it and make adjustments in color, background, font etc. as per your unique business setting.
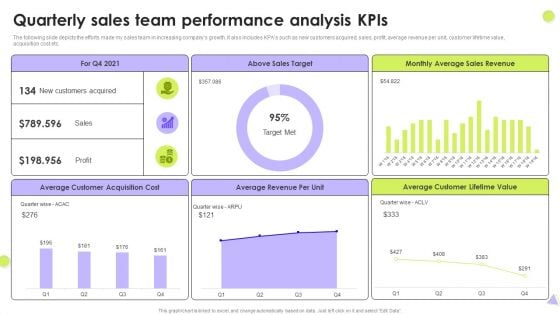
Quarterly Sales Team Performance Analysis Kpis Slides PDF
The following slide depicts the efforts made my sales team in increasing companys growth. It also includes KPAs such as new customers acquired, sales, profit, average revenue per unit, customer lifetime value, acquisition cost etc. Showcasing this set of slides titled Quarterly Sales Team Performance Analysis Kpis Slides PDF. The topics addressed in these templates are Above Sales Target, Average Sales Revenue, Average Customer. All the content presented in this PPT design is completely editable. Download it and make adjustments in color, background, font etc. as per your unique business setting.
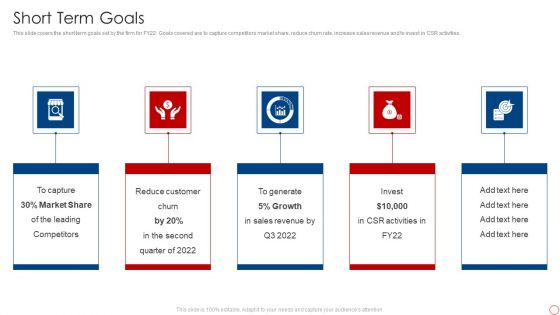
Kpis For Evaluating Business Sustainability Short Term Goals Infographics PDF
This slide covers the short term goals set by the firm for FY22. Goals covered are to capture competitors market share, reduce churn rate, increase sales revenue and to invest in CSR activities. This is a Kpis For Evaluating Business Sustainability Short Term Goals Infographics PDF template with various stages. Focus and dispense information on five stages using this creative set, that comes with editable features. It contains large content boxes to add your information on topics like Market Share, Reduce Customer Churn, Sales Revenue. You can also showcase facts, figures, and other relevant content using this PPT layout. Grab it now.
Product Sales Kpis With Website Traffic Ppt Icon Smartart
This slide showcase different strategies through which product is marketize to increase the product reach to the consumer and increase the market share. It includes total product revenue, sales comparison of online and in store sales, marketing campaigning and website traffic. Showcasing this set of slides titled Product Sales Kpis With Website Traffic Ppt Icon Smartart. The topics addressed in these templates are Website Traffic, Product Sales Increment, Total Product Revenue. All the content presented in this PPT design is completely editable. Download it and make adjustments in color, background, font etc. as per your unique business setting.
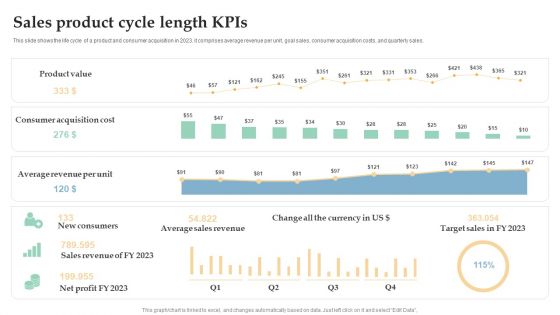
Sales Product Cycle Length Kpis Ppt Pictures Aids PDF
This slide shows the life cycle of a product and consumer acquisition in 2023. it comprises average revenue per unit, goal sales, consumer acquisition costs, and quarterly sales. Showcasing this set of slides titled Sales Product Cycle Length Kpis Ppt Pictures Aids PDF. The topics addressed in these templates are Product Value, Consumer Acquisition Cost, Average Revenue, Per Unit. All the content presented in this PPT design is completely editable. Download it and make adjustments in color, background, font etc. as per your unique business setting.
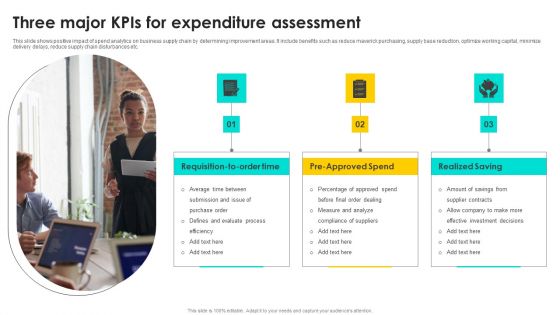
Three Major Kpis For Expenditure Assessment Microsoft PDF
This slide shows positive impact of spend analytics on business supply chain by determining improvement areas. It include benefits such as reduce maverick purchasing, supply base reduction, optimize working capital, minimize delivery delays, reduce supply chain disturbances etc. Presenting Three Major Kpis For Expenditure Assessment Microsoft PDF to dispense important information. This template comprises Three stages. It also presents valuable insights into the topics including Requisition To Order Time, Pre Approved Spend, Realized Saving. This is a completely customizable PowerPoint theme that can be put to use immediately. So, download it and address the topic impactfully.
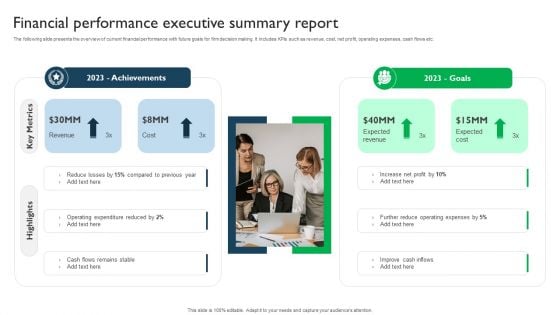
Financial Performance Executive Summary Report Template PDF
The following slide presents the overview of current financial performance with future goals for firm decision making. It includes KPIs such as revenue, cost, net profit, operating expenses, cash flows etc. Presenting Financial Performance Executive Summary Report Template PDF to dispense important information. This template comprises one stages. It also presents valuable insights into the topics including Operating Expenditure, Revenue, Key Metrics. This is a completely customizable PowerPoint theme that can be put to use immediately. So, download it and address the topic impactfully.
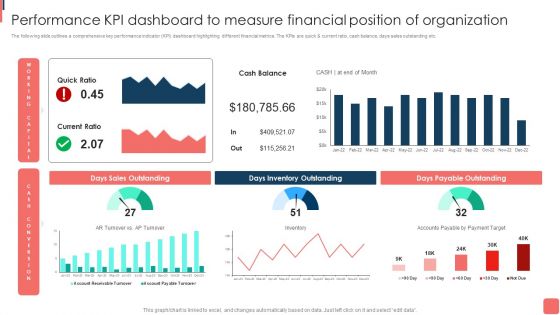
Effective Financial Planning Assessment Techniques Performance Kpi Dashboard To Measure Financial Graphics PDF
The following slide outlines a comprehensive key performance indicator KPI dashboard highlighting different financial metrics. The KPIs are quick and current ratio, cash balance, days sales outstanding etc. The best PPT templates are a great way to save time, energy, and resources. Slidegeeks have 100 precent editable powerpoint slides making them incredibly versatile. With these quality presentation templates, you can create a captivating and memorable presentation by combining visually appealing slides and effectively communicating your message. Download Effective Financial Planning Assessment Techniques Performance Kpi Dashboard To Measure Financial Graphics PDF from Slidegeeks and deliver a wonderful presentation.
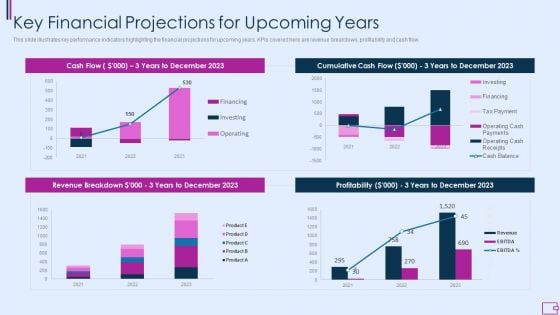
Capital Fundraising And Financial Forecast Pitch Deck Key Financial Projections For Upcoming Years Portrait PDF
This slide illustrates key performance indicators highlighting the financial projections for upcoming years. KPIs covered here are revenue breakdown, profitability and cash flow. Deliver an awe inspiring pitch with this creative capital fundraising and financial forecast pitch deck key financial projections for upcoming years portrait pdf bundle. Topics like key financial projections for upcoming years can be discussed with this completely editable template. It is available for immediate download depending on the needs and requirements of the user.
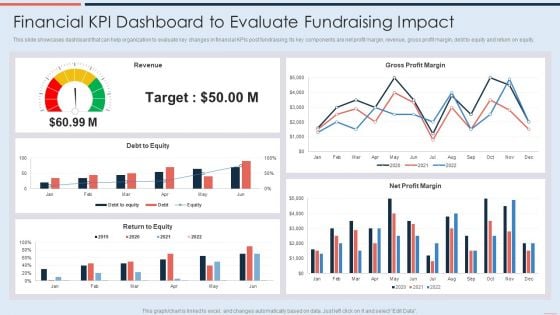
Financial Kpi Dashboard To Evaluate Fundraising Impact Demonstration PDF
This slide showcases dashboard that can help organization to evaluate key changes in financial KPIs post fundraising. Its key components are net profit margin, revenue, gross profit margin, debt to equity and return on equity. Deliver and pitch your topic in the best possible manner with this Financial Kpi Dashboard To Evaluate Fundraising Impact Demonstration PDF. Use them to share invaluable insights on Debt To Equity, Revenue, Gross Profit Margin and impress your audience. This template can be altered and modified as per your expectations. So, grab it now.
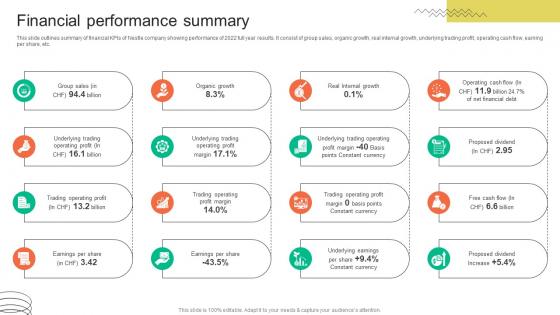
Financial Performance Summary FMCG Provider Company Profile CP SS V
This slide outlines summary of financial KPIs of Nestle company showing performance of 2022 full year results. It consist of group sales, organic growth, real internal growth, underlying trading profit, operating cash flow, earning per share, etc. Find highly impressive Financial Performance Summary FMCG Provider Company Profile CP SS V on Slidegeeks to deliver a meaningful presentation. You can save an ample amount of time using these presentation templates. No need to worry to prepare everything from scratch because Slidegeeks experts have already done a huge research and work for you. You need to download Financial Performance Summary FMCG Provider Company Profile CP SS V for your upcoming presentation. All the presentation templates are 100 percent editable and you can change the color and personalize the content accordingly. Download now This slide outlines summary of financial KPIs of Nestle company showing performance of 2022 full year results. It consist of group sales, organic growth, real internal growth, underlying trading profit, operating cash flow, earning per share, etc.
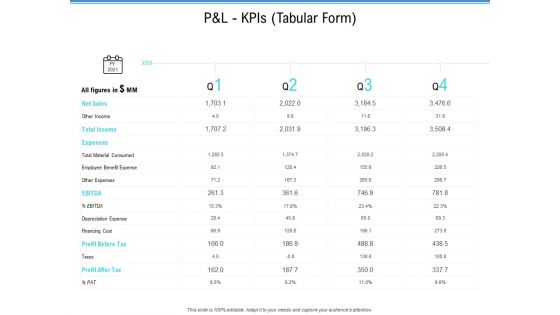
Enterprise Analysis P And L Kpis Tabular Form Ppt Slides Graphics Download PDF
Deliver and pitch your topic in the best possible manner with this enterprise analysis p and l kpis tabular form ppt slides graphics download pdf. Use them to share invaluable insights on operating profit, net profit, cogs, revenue and impress your audience. This template can be altered and modified as per your expectations. So, grab it now.
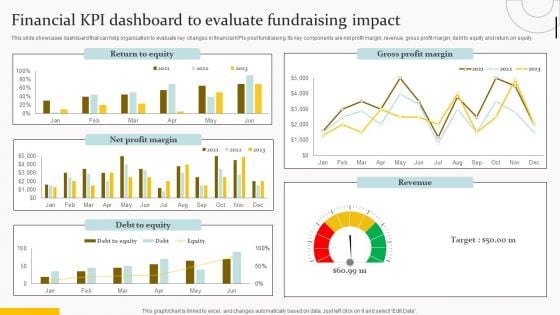
Financial Kpi Dashboard To Evaluate Fundraising Impact Topics PDF
This slide showcases dashboard that can help organization to evaluate key changes in financial KPIs post fundraising. Its key components are net profit margin, revenue, gross profit margin, debt to equity and return on equity. Do you have to make sure that everyone on your team knows about any specific topic I yes, then you should give Financial Kpi Dashboard To Evaluate Fundraising Impact Topics PDF a try. Our experts have put a lot of knowledge and effort into creating this impeccable Financial Kpi Dashboard To Evaluate Fundraising Impact Topics PDF. You can use this template for your upcoming presentations, as the slides are perfect to represent even the tiniest detail. You can download these templates from the Slidegeeks website and these are easy to edit. So grab these today.
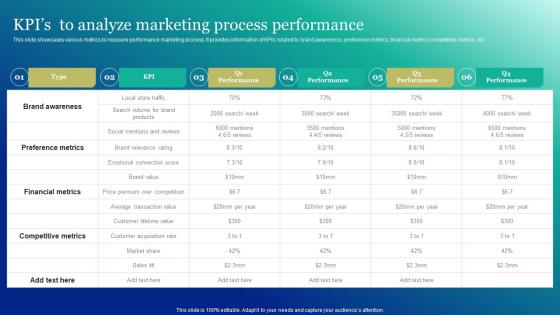
Kpis To Analyze Marketing Process Performance Marketing And Promotion Automation Graphics Pdf
This slide showcases various metrics to measure performance marketing process. It provides information of KPIs related to brand awareness, preference metrics, financial metrics competitive metrics, etc.This Kpis To Analyze Marketing Process Performance Marketing And Promotion Automation Graphics Pdf is perfect for any presentation, be it in front of clients or colleagues. It is a versatile and stylish solution for organizing your meetings. The Kpis To Analyze Marketing Process Performance Marketing And Promotion Automation Graphics Pdf features a modern design for your presentation meetings. The adjustable and customizable slides provide unlimited possibilities for acing up your presentation. Slidegeeks has done all the homework before launching the product for you. So, do not wait, grab the presentation templates today This slide showcases various metrics to measure performance marketing process. It provides information of KPIs related to brand awareness, preference metrics, financial metrics competitive metrics, etc.
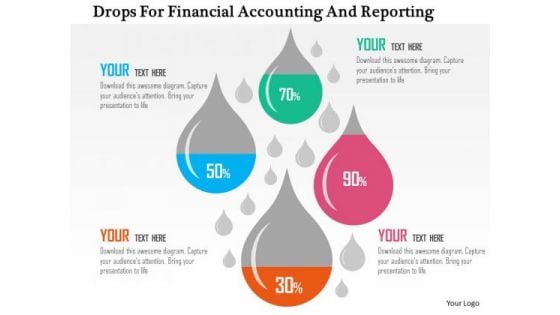
Business Diagram Drops For Financial Accounting And Reporting Presentation Template
This business diagram has been designed with drops displaying financial ratios. Download this diagram to depict financial and accounting ratios. Use this slide to build quality presentations for your viewers.
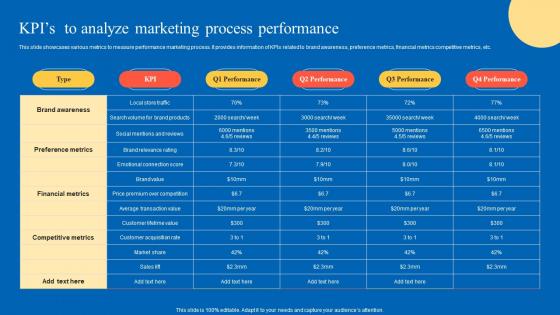
KPIs To Analyze Marketing Strategic Guide For Marketing Program Background Pdf
This slide showcases various metrics to measure performance marketing process. It provides information of KPIs related to brand awareness, preference metrics, financial metrics competitive metrics, etc. This KPIs To Analyze Marketing Strategic Guide For Marketing Program Background Pdf is perfect for any presentation, be it in front of clients or colleagues. It is a versatile and stylish solution for organizing your meetings. The KPIs To Analyze Marketing Strategic Guide For Marketing Program Background Pdf features a modern design for your presentation meetings. The adjustable and customizable slides provide unlimited possibilities for acing up your presentation. Slidegeeks has done all the homework before launching the product for you. So, do not wait, grab the presentation templates today This slide showcases various metrics to measure performance marketing process. It provides information of KPIs related to brand awareness, preference metrics, financial metrics competitive metrics, etc.
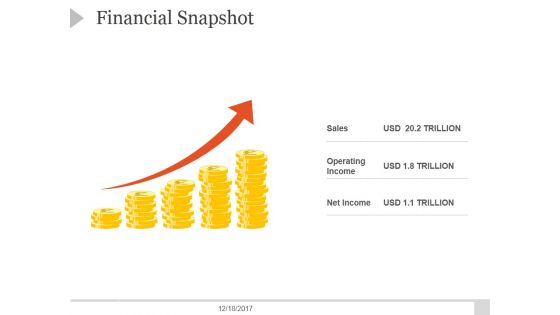
Financial Snapshot Ppt PowerPoint Presentation Samples
This is a financial snapshot ppt powerpoint presentation samples. This is a five stage process. The stages in this process are sales, operating income, net income.
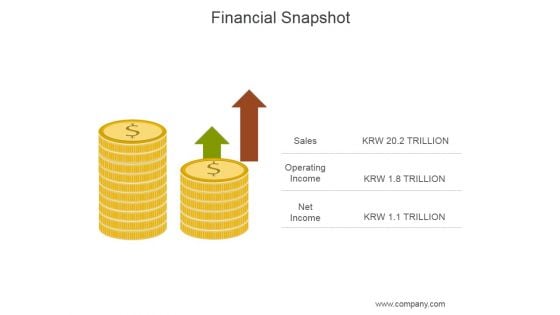
Financial Snapshot Ppt PowerPoint Presentation Layouts
This is a financial snapshot ppt powerpoint presentation layouts. This is a two stage process. The stages in this process are sales, operating income, net income.
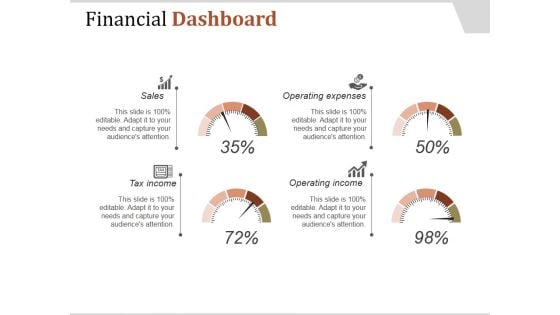
Financial Dashboard Ppt PowerPoint Presentation Influencers
This is a financial dashboard ppt powerpoint presentation influencers. This is a four stage process. The stages in this process are sales, tax income, operating income, operating expenses.
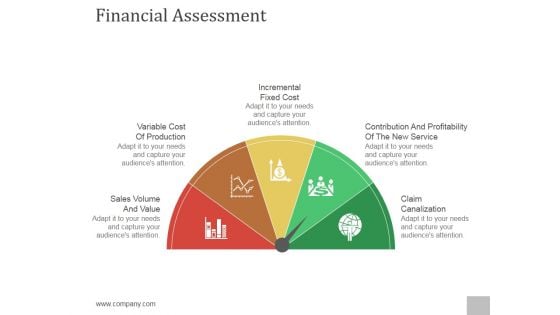
Financial Assessment Ppt PowerPoint Presentation Styles
This is a financial assessment ppt powerpoint presentation styles. This is a five stage process. The stages in this process are sales volume and value, variable cost of production, incremental fixed cost, contribution and profitability of the new service, claim canalization.
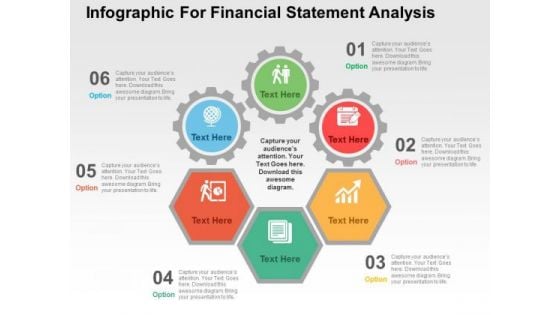
Infographic For Financial Statement Analysis PowerPoint Templates
This PowerPoint template contains infographic slide. This diagram has been designed with circular infographic to exhibit financial statement analysis. Use this diagram to set targets and to measure performance in your presentations.
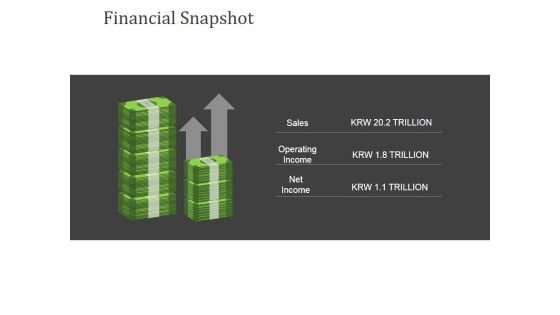
Financial Snapshot Ppt PowerPoint Presentation Model Themes
This is a financial snapshot ppt powerpoint presentation model themes. This is a two stage process. The stages in this process are sales, operating income, net income.

Business Financial Report Powerpoint Ppt Template Bundles
Use this Business Financial Report Powerpoint Ppt Template Bundles to ensure the business world gets to know you as a presentation expert with tremendous recall value. With its focus on providing the worlds best designs to highlight business ideas that have the potential to change the world, this PPT Template is sure to win you clients. The complete deck in Financial Metrics, Investment Analysis, Financial Projections, Profit And Loss Statement, Budget Analysis slides is a compendium of information, structured in a manner that provides the best framework for a presentation. Use this completely editable and customizable presentation to make an impact and improve your order book. Download now. Introducing our professionally designed PowerPoint presentation on Business Financial Report that offers comprehensive overview of company financial health and performance serving as an essential tool for strategic planning and informed decision making. This PPT covers insights about financial statements including balance sheet, cash flow statement, financial ratios, etc. that provides deeper understanding to assure financial stability. This presentation equip stakeholders with valuable insights to determine growth opportunities enhancing companys financial well-being.
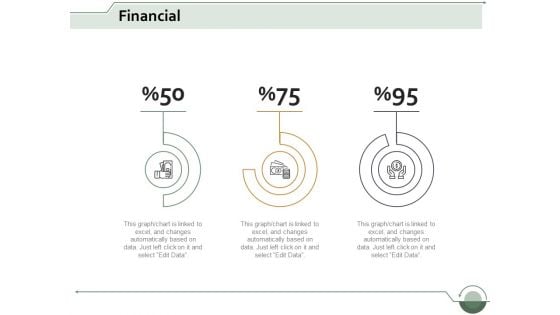
financial analysis ppt powerpoint presentation styles objects
This is a financial analysis ppt powerpoint presentation styles objects. This is a three stage process. The stages in this process are dashboard, business, marketing, management, planning.
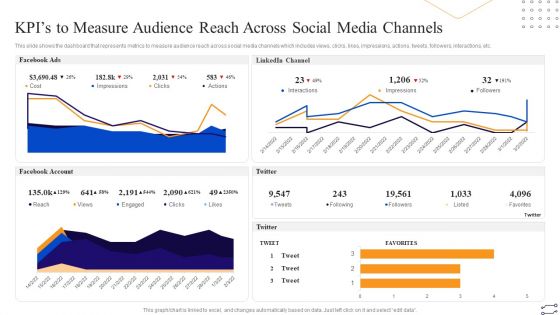
Online Marketing Tactics To Enhance Sales Kpis To Measure Audience Reach Across Social Media Professional PDF
This slide shows the dashboard that represents metrics to measure audience reach across social media channels which includes views, clicks, likes, impressions, actions, tweets, followers, interactions, etc. Deliver an awe inspiring pitch with this creative Online Marketing Tactics To Enhance Sales Kpis To Measure Audience Reach Across Social Media Professional PDF bundle. Topics like LinkedIn Channel, Facebook Account, Twitter, Facebook Ads can be discussed with this completely editable template. It is available for immediate download depending on the needs and requirements of the user.
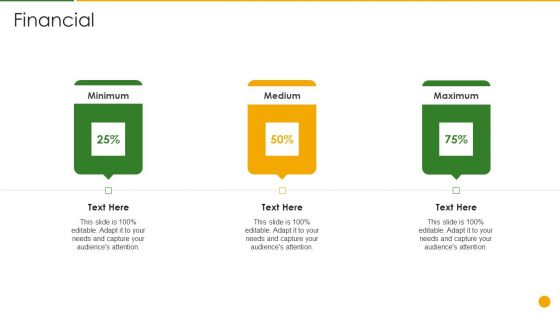
Product Social Sustainability Scorecard Financial Graphics PDF
Presenting product social sustainability scorecard financial graphics pdf to provide visual cues and insights. Share and navigate important information on four stages that need your due attention. This template can be used to pitch topics like minimum, medium, maximum. In addtion, this PPT design contains high resolution images, graphics, etc, that are easily editable and available for immediate download.
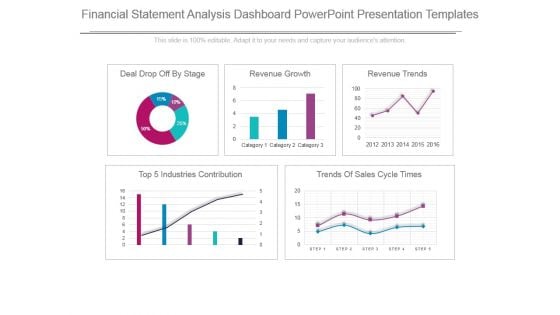
Financial Statement Analysis Dashboard Powerpoint Presentation Templates
This is a financial statement analysis dashboard powerpoint presentation templates. This is a five stage process. The stages in this process are deal drop off by stage, revenue growth, revenue trends, top 5 industries contribution, trends of sales cycle times, category.
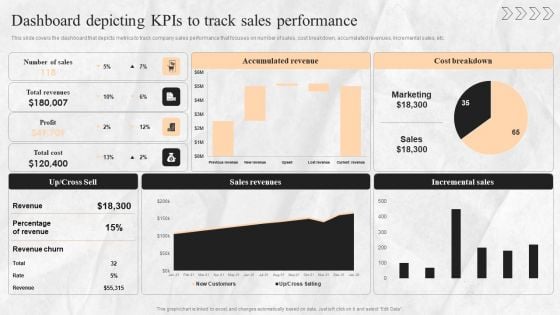
Digital Transition Plan For Managing Business Dashboard Depicting Kpis To Track Sales Performance Guidelines PDF
This slide covers the dashboard that depicts metrics to track company sales performance that focuses on number of sales, cost breakdown, accumulated revenues, incremental sales, etc. Are you in need of a template that can accommodate all of your creative concepts This one is crafted professionally and can be altered to fit any style. Use it with Google Slides or PowerPoint. Include striking photographs, symbols, depictions, and other visuals. Fill, move around, or remove text boxes as desired. Test out color palettes and font mixtures. Edit and save your work, or work with colleagues. Download Digital Transition Plan For Managing Business Dashboard Depicting Kpis To Track Sales Performance Guidelines PDF and observe how to make your presentation outstanding. Give an impeccable presentation to your group and make your presentation unforgettable.
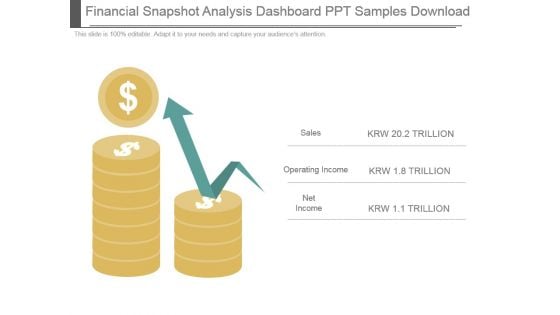
Financial Snapshot Analysis Dashboard Ppt Samples Download
This is a financial snapshot analysis dashboard ppt samples download. This is a two stage process. The stages in this process are sales, operating income, net income.
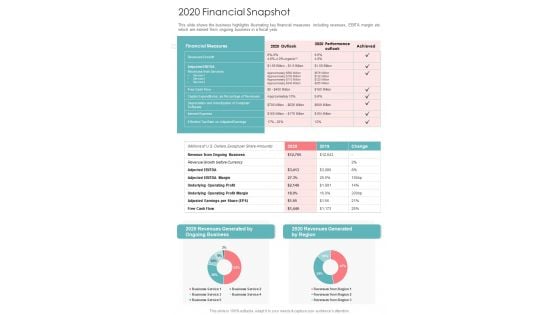
2020 Financial Snapshot One Pager Documents
This slide shows the business highlights illustrating key financial measures including revenues, EBITA margin etc. which are earned from ongoing business in a fiscal year. Presenting you a fantastic 2020 Financial Snapshot One Pager Documents. This piece is crafted on hours of research and professional design efforts to ensure you have the best resource. It is completely editable and its design allow you to rehash its elements to suit your needs. Get this 2020 Financial Snapshot One Pager Documents A4 One-pager now.
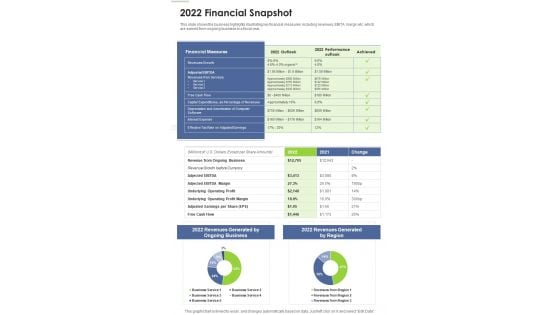
2022 Financial Snapshot One Pager Documents
This slide shows the business highlights illustrating key financial measures including revenues, EBITA margin etc. which are earned from ongoing business in a fiscal year.Presenting you a fantastic 2022 Financial Snapshot One Pager Documents. This piece is crafted on hours of research and professional design efforts to ensure you have the best resource. It is completely editable and its design allow you to rehash its elements to suit your needs. Get this 2022 Financial Snapshot One Pager Documents A4 One-pager now.
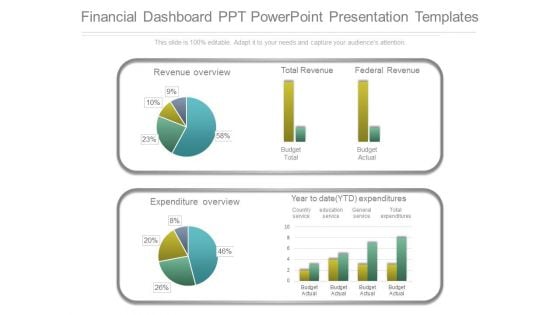
Financial Dashboard Ppt Powerpoint Presentation Templates
This is a financial dashboard ppt powerpoint presentation templates. This is a two stage process. The stages in this process are revenue overview, total revenue, federal revenue, budget total, budget actual, expenditure overview, year to date ytd expenditures, country service, education service, general service, total expenditures.
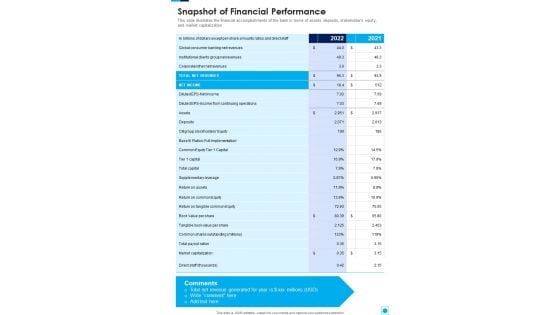
Snapshot Of Financial Performance One Pager Documents
This slide illustrates the financial accomplishments of the bank in terms of assets, deposits, stakeholders equity, and market capitalization. Presenting you a fantastic Snapshot Of Financial Performance One Pager Documents. This piece is crafted on hours of research and professional design efforts to ensure you have the best resource. It is completely editable and its design allow you to rehash its elements to suit your needs. Get this Snapshot Of Financial Performance One Pager Documents A4 One-pager now.
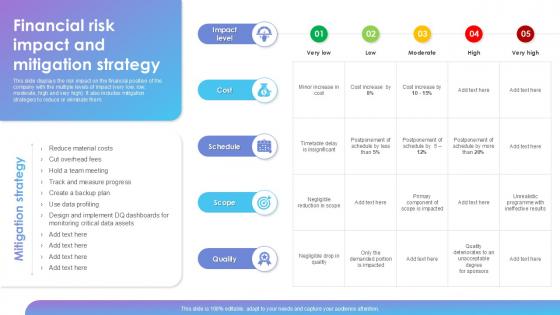
Financial Risk Impact And Mitigation Strategy
Want to ace your presentation in front of a live audience Our Financial Risk Impact And Mitigation Strategy can help you do that by engaging all the users towards you. Slidegeeks experts have put their efforts and expertise into creating these impeccable powerpoint presentations so that you can communicate your ideas clearly. Moreover, all the templates are customizable, and easy-to-edit and downloadable. Use these for both personal and commercial use. This presentation depicts the risk impact on the companys financial position, with five levels of impact very low, low, moderate, high, and extremely high. It also contains mitigation measures for reducing or eliminating them.
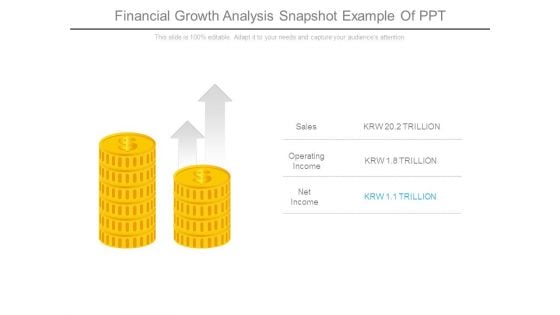
Financial Growth Analysis Snapshot Example Of Ppt
This is a financial growth analysis snapshot example of ppt. This is a two stage process. The stages in this process are sales, operating income, net income.
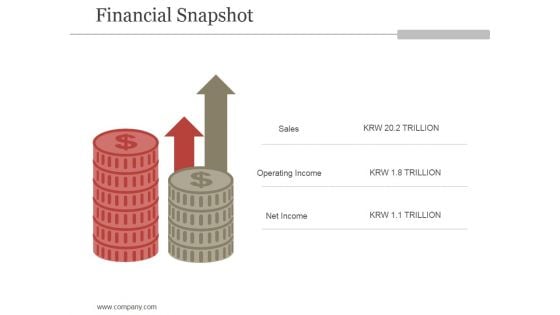
Financial Snapshot Ppt PowerPoint Presentation Backgrounds
This is a financial snapshot ppt powerpoint presentation backgrounds. This is a six stage process. The stages in this process are icons, strategy, percentage, finance, business.
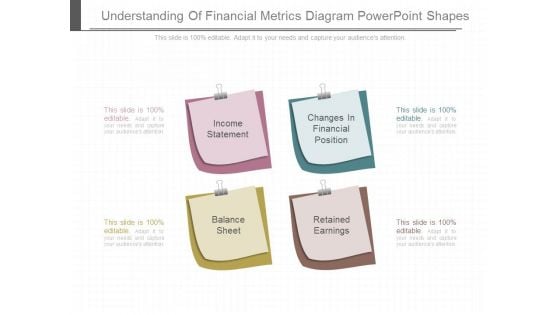
Understanding Of Financial Metrics Diagram Powerpoint Shapes
This is a understanding of financial metrics diagram powerpoint shapes. This is a four stage process. The stages in this process are income statement, changes in financial position, balance sheet, retained earnings.

Financial Measures Powerpoint Slides Background Designs
This is a financial measures powerpoint slides background designs. This is a five stage process. The stages in this process are traditional strategic management, internal processes, customer relationship, learning and growth, financial measures.
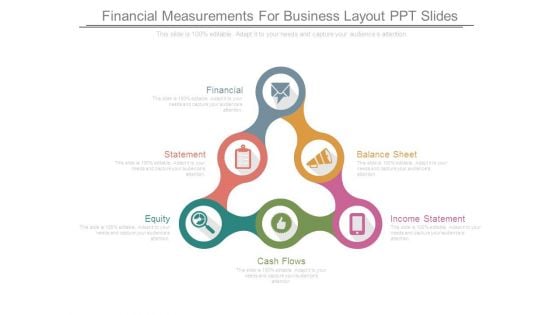
Financial Measurements For Business Layout Ppt Slides
This is a financial measurements for business layout ppt slides. This is a six stage process. The stages in this process are financial, statement, equity, cash flows, balance sheet, income statement.
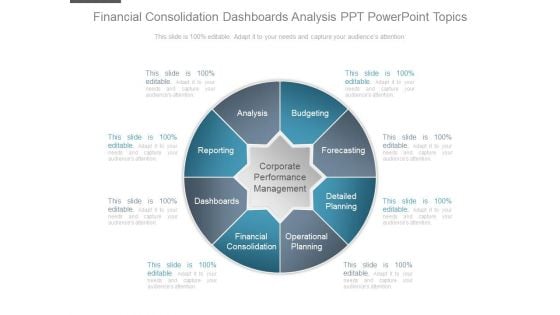
Financial Consolidation Dashboards Analysis Ppt Powerpoint Topics
This is a financial consolidation dashboards analysis ppt powerpoint topics. This is a eight stage process. The stages in this process are corporate performance management, budgeting, forecasting, detailed planning, operational planning, financial consolidation, dashboards, reporting, analysis.
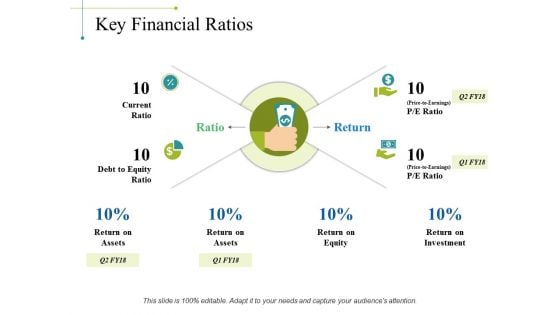
Key Financial Ratios Ppt PowerPoint Presentation Guidelines
This is a key financial ratios ppt powerpoint presentation guidelines. This is a four stage process. The stages in this process are current ratio, debt to equity ratio, ratio, return, return on assets.

Three Dashboard For Financial Reporting Ppt Summary
This is a three dashboard for financial reporting ppt summary. This is a three stage process. The stages in this process are business, marketing, speed, dashboard, meter.
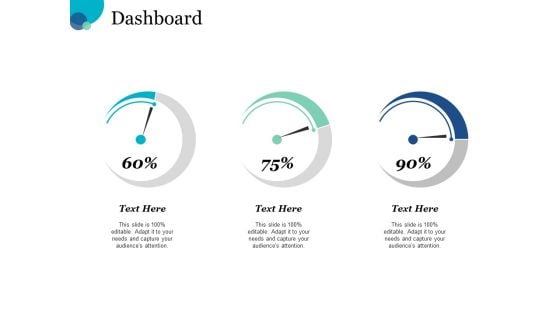
Dashboard Financial Ppt PowerPoint Presentation File Gridlines
This is a dashboard financial ppt powerpoint presentation file gridlines. This is a three stage process. The stages in this process are business, management, planning, strategy, marketing.
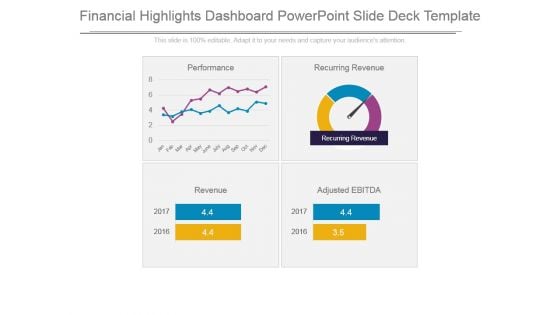
Financial Highlights Dashboard Powerpoint Slide Deck Template
This is a financial highlights dashboard powerpoint slide deck template. This is a four stage process. The stages in this process are recurring revenue, performance, revenue, adjusted ebitda.
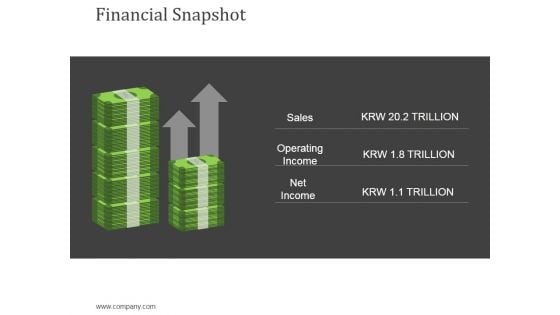
Financial Snapshot Ppt Powerpoint Presentation Layouts Slides
This is a financial snapshot ppt powerpoint presentation layouts slides. This is a two stage process. The stages in this process are sales, operating income, net income, currency, finance.
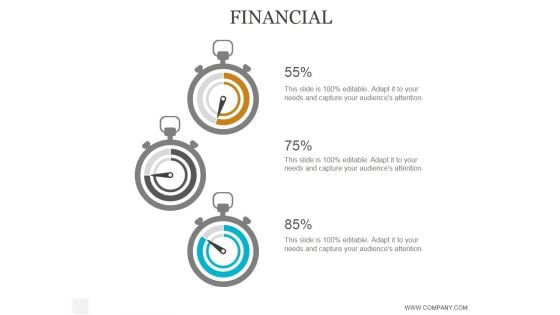
Financial Ppt PowerPoint Presentation Background Designs
This is a financial ppt powerpoint presentation background designs. This is a five stage process. The stages in this process are business, strategy, marketing, analysis, success, finance, dashboard.
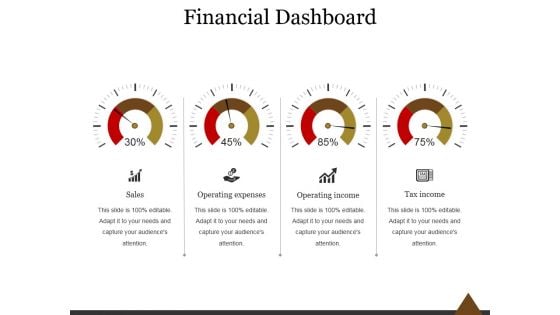
Financial Dashboard Ppt PowerPoint Presentation Information
This is a financial dashboard ppt powerpoint presentation information. This is a four stage process. The stages in this process are sales, operating expenses, operating income, tax income.
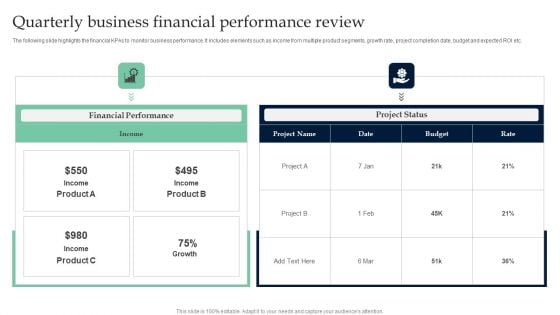
Quarterly Business Financial Performance Review Sample PDF
The following slide highlights the financial KPAs to monitor business performance. It includes elements such as income from multiple product segments, growth rate, project completion date, budget and expected ROI etc. Showcasing this set of slides titled Quarterly Business Financial Performance Review Sample PDF. The topics addressed in these templates are Quarterly Business, Financial Performance Review. All the content presented in this PPT design is completely editable. Download it and make adjustments in color, background, font etc. as per your unique business setting.

Financial And Business Growth Objectives Ppt Slides
This is a financial and business growth objectives ppt slides. This is a five stage process. The stages in this process are specific, measurable, achievable, realistic, time, smart.
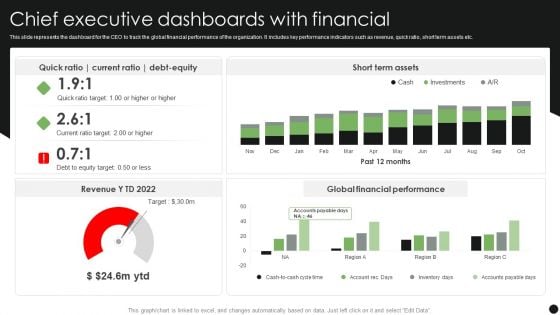
Chief Executive Dashboards With Financial Topics PDF
This slide represents the dashboard for the CEO to track the global financial performance of the organization. It includes key performance indicators such as revenue, quick ratio, short term assets etc. Showcasing this set of slides titled Chief Executive Dashboards With Financial Topics PDF. The topics addressed in these templates are Short Term Assets, Global Financial Performance, Debt Equity. All the content presented in this PPT design is completely editable. Download it and make adjustments in color, background, font etc. as per your unique business setting.


 Continue with Email

 Home
Home


