Financial Kpis
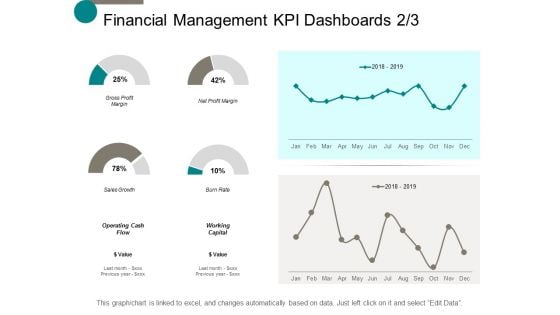
Financial Management Kpi Dashboards Marketing Ppt Powerpoint Presentation Infographics Outline
This is a financial management kpi dashboards marketing ppt powerpoint presentation infographics outline. This is a six stage process. The stages in this process are finance, marketing, management, investment, analysis.
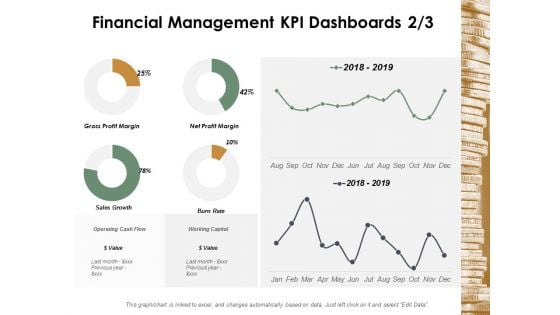
Financial Management Kpi Dashboards Management Ppt Powerpoint Presentation Slides Tips
This is a financial management kpi dashboards management ppt powerpoint presentation slides tips. This is a six stage process. The stages in this process are finance, marketing, management, investment, analysis.
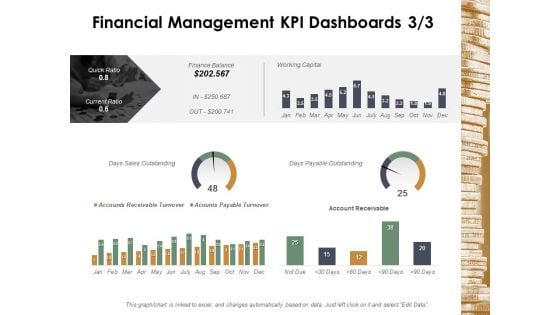
Financial Management Kpi Dashboards Marketing Ppt Powerpoint Presentation Professional Portrait
This is a financial management kpi dashboards marketing ppt powerpoint presentation professional portrait. This is a six stage process. The stages in this process are finance, marketing, management, investment, analysis.
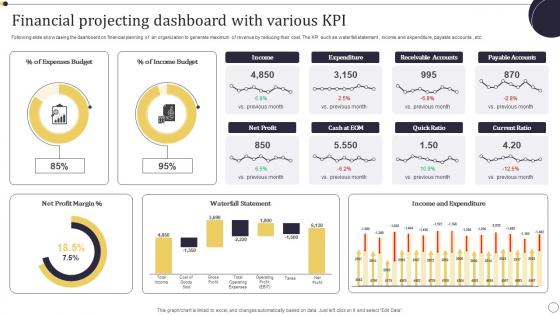
Financial Projecting Dashboard With Various KPI Themes Pdf
Following slide showcasing the dashboard on financial planning of an organization to generate maximum of revenue by reducing their cost. The KPI such as waterfall statement , income and expenditure, payable accounts , etc . Pitch your topic with ease and precision using this Financial Projecting Dashboard With Various KPI Themes Pdf. This layout presents information on Income Budget, Expenses Budget, Net Profit Margin. It is also available for immediate download and adjustment. So, changes can be made in the color, design, graphics or any other component to create a unique layout. Following slide showcasing the dashboard on financial planning of an organization to generate maximum of revenue by reducing their cost. The KPI such as waterfall statement , income and expenditure, payable accounts , etc .
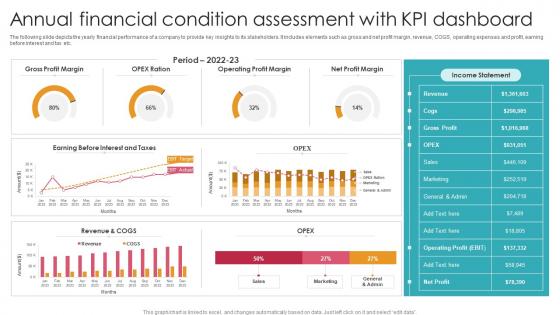
Annual Financial Condition Assessment With KPI Dashboard Ideas Pdf
The following slide depicts the yearly financial performance of a company to provide key insights to its stakeholders. It includes elements such as gross and net profit margin, revenue, COGS, operating expenses and profit, earning before interest and tax etc. Showcasing this set of slides titled Annual Financial Condition Assessment With KPI Dashboard Ideas Pdf. The topics addressed in these templates are Gross Profit Margin, Operating Profit Margin, Net Profit Margin. All the content presented in this PPT design is completely editable. Download it and make adjustments in color, background, font etc. as per your unique business setting. The following slide depicts the yearly financial performance of a company to provide key insights to its stakeholders. It includes elements such as gross and net profit margin, revenue, COGS, operating expenses and profit, earning before interest and tax etc.
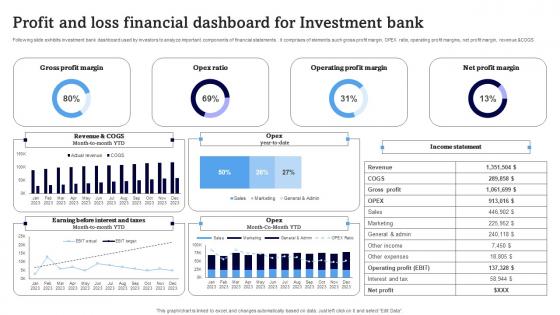
Profit And Loss Financial Dashboard For Investment Bank Download Pdf
Following slide exhibits investment bank dashboard used by investors to analyze important components of financial statements . it comprises of elements such gross profit margin, OPEX ratio, operating profit margins, net profit margin, revenue andCOGS Pitch your topic with ease and precision using this Profit And Loss Financial Dashboard For Investment Bank Download Pdf. This layout presents information on Gross Profit Margin, Opex Ratio, Operating Profit Margin. It is also available for immediate download and adjustment. So, changes can be made in the color, design, graphics or any other component to create a unique layout. Following slide exhibits investment bank dashboard used by investors to analyze important components of financial statements . it comprises of elements such gross profit margin, OPEX ratio, operating profit margins, net profit margin, revenue andCOGS
Data Interpretation Icon For Financial Sector Mockup Pdf
Showcasing this set of slides titled Data Interpretation Icon For Financial Sector Mockup Pdf The topics addressed in these templates are Data Interpretation Icon, Measure Business Growth All the content presented in this PPT design is completely editable. Download it and make adjustments in color, background, font etc. as per your unique business setting. Our Data Interpretation Icon For Financial Sector Mockup Pdf are topically designed to provide an attractive backdrop to any subject. Use them to look like a presentation pro.
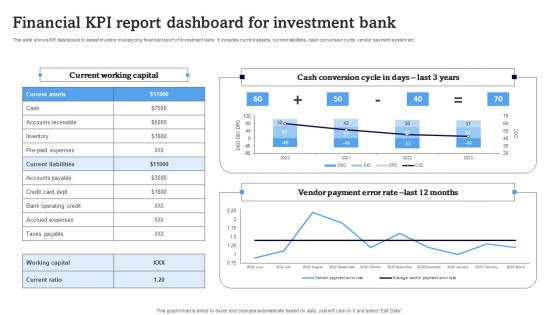
Financial KPI Report Dashboard For Investment Bank Structure Pdf
This slide shows KPI dashboard to assist investor in analyzing financial report of investment bank. It includes current assets, current liabilities, cash conversion cycle, vendor payment system etc. Showcasing this set of slides titled Financial KPI Report Dashboard For Investment Bank Structure Pdf. The topics addressed in these templates are Current Working Capital, Cash Conversion Cycle Days, Vendor Payment Error Rate. All the content presented in this PPT design is completely editable. Download it and make adjustments in color, background, font etc. as per your unique business setting. This slide shows KPI dashboard to assist investor in analyzing financial report of investment bank. It includes current assets, current liabilities, cash conversion cycle, vendor payment system etc.
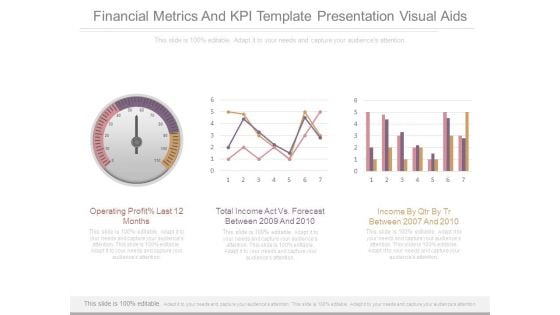
Financial Metrics And Kpi Template Presentation Visual Aids
This is a financial metrics and kpi template presentation visual aids. This is a three stage process. The stages in this process are operating profit last 12 months, total income act vs forecast between 2009 and 2010, income by qtr by tr between 2007 and 2010.
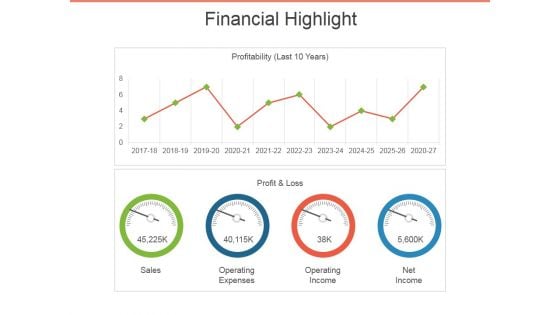
Financial Highlight Template 2 Ppt PowerPoint Presentation Outline Visuals
This is a financial highlight template 2 ppt powerpoint presentation outline visuals. This is a two stage process. The stages in this process are sales, profit and loss, operating expenses, operating income, net income.
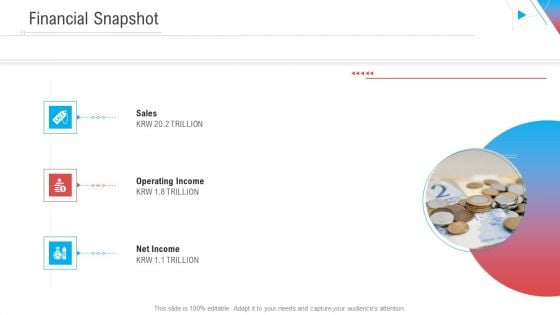
Company Outline Financial Snapshot Ppt Styles Grid PDF
This is a company outline financial snapshot ppt styles grid pdf template with various stages. Focus and dispense information on three stages using this creative set, that comes with editable features. It contains large content boxes to add your information on topics like sales, operating income, net income. You can also showcase facts, figures, and other relevant content using this PPT layout. Grab it now.
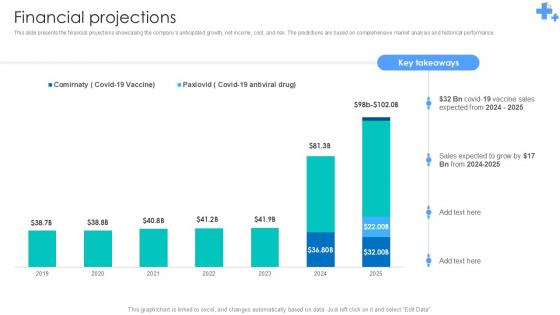
Financial Projections Undergoing Pharmaceutical Revolution Ppt Presentation BMC SS V
This slide presents the financial projections showcasing the companys anticipated growth, net income, cost, and risk. The predictions are based on comprehensive market analysis and historical performance. This Financial Projections Undergoing Pharmaceutical Revolution Ppt Presentation BMC SS V is perfect for any presentation, be it in front of clients or colleagues. It is a versatile and stylish solution for organizing your meetings. The Financial Projections Undergoing Pharmaceutical Revolution Ppt Presentation BMC SS V features a modern design for your presentation meetings. The adjustable and customizable slides provide unlimited possibilities for acing up your presentation. Slidegeeks has done all the homework before launching the product for you. So, do not wait, grab the presentation templates today This slide presents the financial projections showcasing the companys anticipated growth, net income, cost, and risk. The predictions are based on comprehensive market analysis and historical performance.
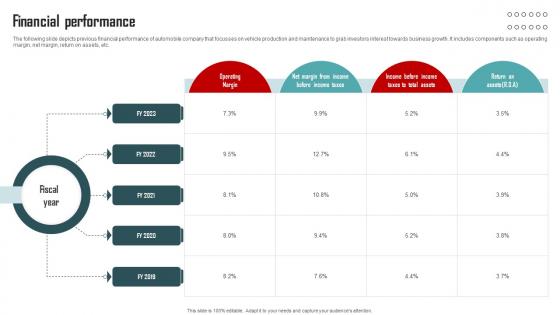
Financial Performance Vehicle Company Capital Funding Pitch Deck
The following slide depicts previous financial performance of automobile company that focusses on vehicle production and maintenance to grab investors interest towards business growth. It includes components such as operating margin, net margin, return on assets, etc. From laying roadmaps to briefing everything in detail, our templates are perfect for you. You can set the stage with your presentation slides. All you have to do is download these easy-to-edit and customizable templates. Financial Performance Vehicle Company Capital Funding Pitch Deck will help you deliver an outstanding performance that everyone would remember and praise you for. Do download this presentation today. The following slide depicts previous financial performance of automobile company that focusses on vehicle production and maintenance to grab investors interest towards business growth. It includes components such as operating margin, net margin, return on assets, etc.
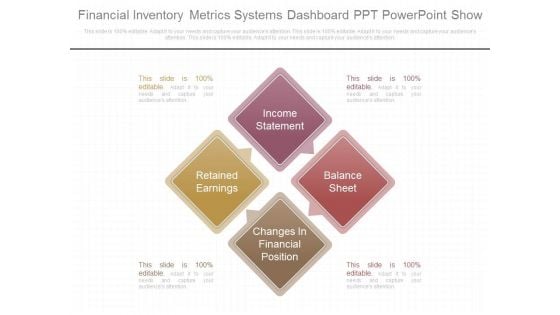
Financial Inventory Metrics Systems Dashboard Ppt Powerpoint Show
This is a financial inventory metrics systems dashboard ppt powerpoint show. This is a four stage process. The stages in this process are income statement, retained earnings, balance sheet, changes in financial position.
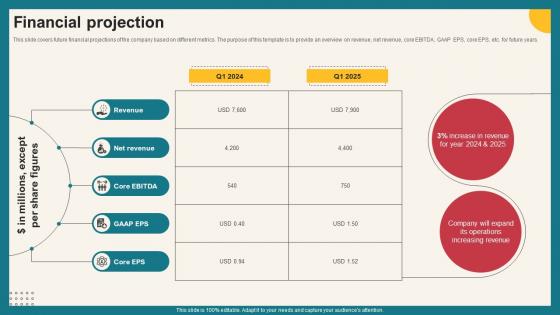
Financial Projection Investment Opportunities Platform Funding Elevator Pitch Deck
This slide covers future financial projections of the company based on different metrics. The purpose of this template is to provide an overview on revenue, net revenue, core EBITDA, GAAP EPS, core EPS, etc. for future years. From laying roadmaps to briefing everything in detail, our templates are perfect for you. You can set the stage with your presentation slides. All you have to do is download these easy-to-edit and customizable templates. Financial Projection Investment Opportunities Platform Funding Elevator Pitch Deck will help you deliver an outstanding performance that everyone would remember and praise you for. Do download this presentation today. This slide covers future financial projections of the company based on different metrics. The purpose of this template is to provide an overview on revenue, net revenue, core EBITDA, GAAP EPS, core EPS, etc. for future years.
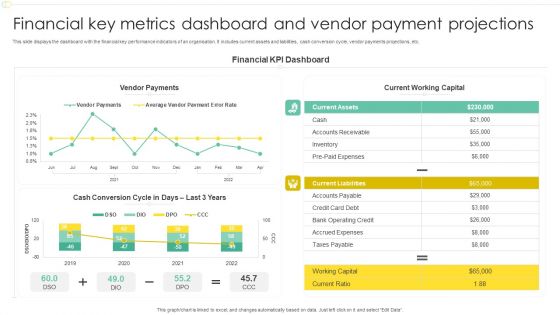
Financial Key Metrics Dashboard And Vendor Payment Projections Professional PDF
This slide displays the dashboard with the financial key performance indicators of an organisation. It includes current assets and liabilities, cash conversion cycle, vendor payments projections, etc. Pitch your topic with ease and precision using this Financial Key Metrics Dashboard And Vendor Payment Projections Professional PDF. This layout presents information on Financial KPI Dashboard, Current Working Capital, Vendor Payments. It is also available for immediate download and adjustment. So, changes can be made in the color, design, graphics or any other component to create a unique layout.
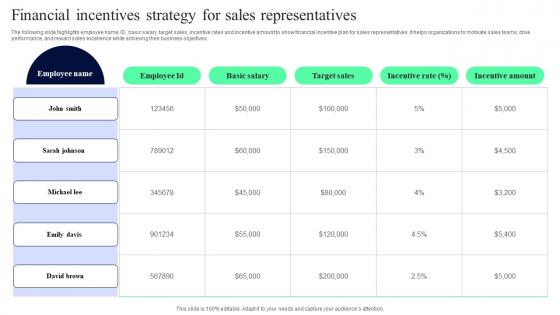
Financial Incentives Strategy For Sales Representatives Introduction Pdf
The following slide highlights product sales per unit by each employee to show Employee incentive plan based on product sales and targets. It helps organizations to incentivize employee performance, drive sales growth, and achieve business objectives.Showcasing this set of slides titled Financial Incentives Strategy For Sales Representatives Introduction Pdf The topics addressed in these templates are Financial Incentives, Strategy Sales Representatives All the content presented in this PPT design is completely editable. Download it and make adjustments in color, background, font etc. as per your unique business setting. The following slide highlights employee name, ID, basic salary, target sales, incentive rates and incentive amount to show financial incentive plan for sales representatives. It helps organizations to motivate sales teams, drive performance, and reward sales excellence while achieving their business objectives.
Financial Measures Ppt PowerPoint Presentation Show Visual Aids
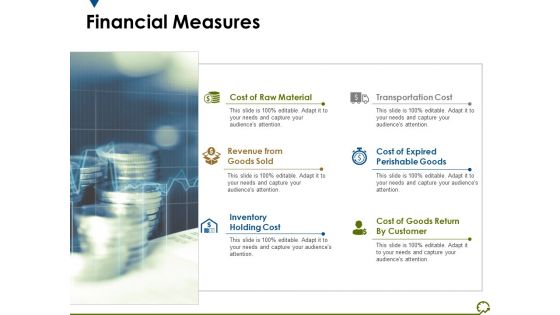
This is a financial measures ppt powerpoint presentation show visual aids. This is a six stage process. The stages in this process are cost of raw material, revenue from goods sold, transportation cost, cost of expired perishable goods, inventory holding cost.
Scorecard Measure Digital Shift Progress Financial Ppt Outline Influencers PDF
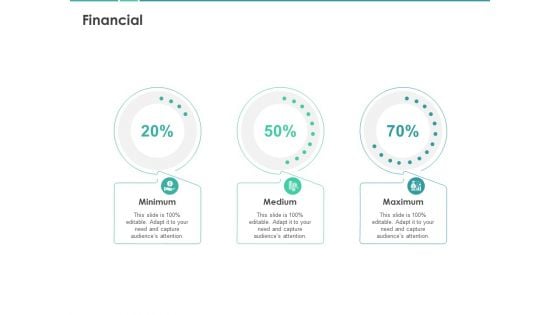
Presenting this set of slides with name scorecard measure digital shift progress financial ppt outline influencers pdf. This is a three stage process. The stages in this process are minimum, medium, maximum. This is a completely editable PowerPoint presentation and is available for immediate download. Download now and impress your audience.
Marketing Performance Measurement Financial Ppt Styles Graphics PDF
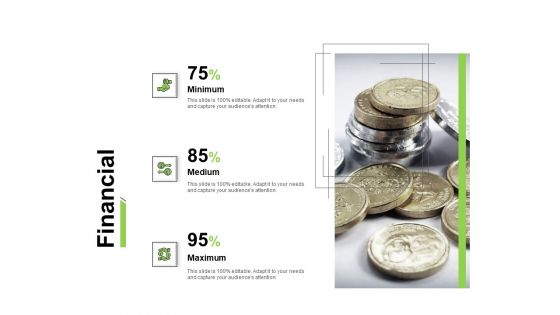
Presenting this set of slides with name marketing performance measurement financial ppt styles graphics pdf. This is a three stage process. The stages in this process are minimum, medium, maximum. This is a completely editable PowerPoint presentation and is available for immediate download. Download now and impress your audience.
Supply Network Management Growth Financial Measures Demonstration PDF
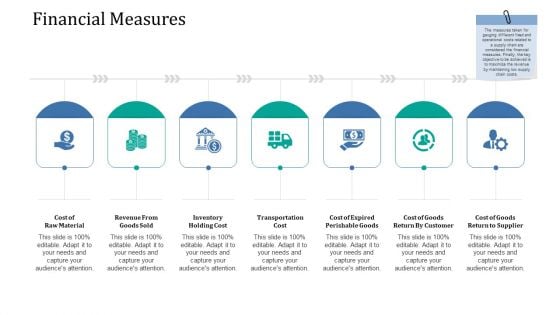
This is a supply network management growth financial measures demonstration pdf template with various stages. Focus and dispense information on three stages using this creative set, that comes with editable features. It contains large content boxes to add your information on topics like minimum, medium, maximum. You can also showcase facts, figures, and other relevant content using this PPT layout. Grab it now.
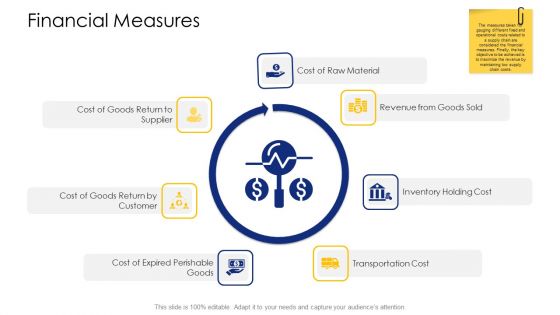
Logistic Network Administration Solutions Financial Measures Information PDF
This is a logistic network administration solutions financial measures information pdf template with various stages. Focus and dispense information on three stages using this creative set, that comes with editable features. It contains large content boxes to add your information on topics like minimum, medium, maximum. You can also showcase facts, figures, and other relevant content using this PPT layout. Grab it now.
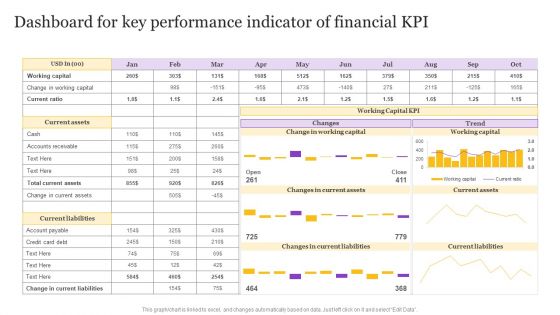
Dashboard For Key Performance Indicator Of Financial KPI Background PDF
Pitch your topic with ease and precision using this Dashboard For Key Performance Indicator Of Financial KPI Background PDF. This layout presents information on Dashboard For Key, Performance Indicator, Financial KPI. It is also available for immediate download and adjustment. So, changes can be made in the color, design, graphics or any other component to create a unique layout.
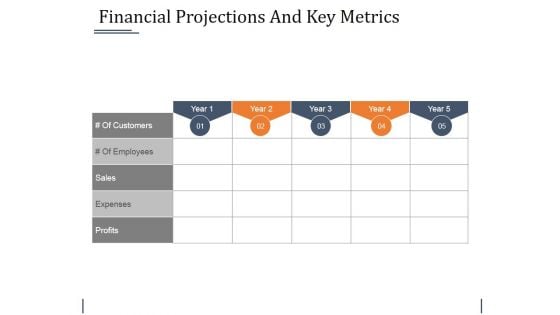
Financial Projections And Key Metrics Ppt PowerPoint Presentation Layouts Objects
This is a financial projections and key metrics ppt powerpoint presentation layouts objects. This is a five stage process. The stages in this process are sales, expenses, profits.
Financial Key Performance Indicators Table Powerpoint Slide Deck
This is a financial key performance indicators table powerpoint slide deck. This is a six stage process. The stages in this process are business, strategy, marketing, success, table.
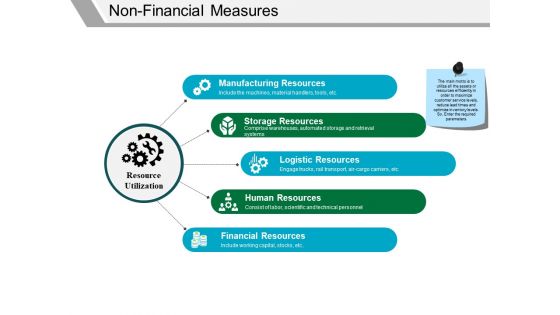
Non Financial Measures Template 3 Ppt PowerPoint Presentation Gallery Sample
This is a non financial measures template 3 ppt powerpoint presentation gallery sample. This is a five stage process. The stages in this process are manufacturing resources, storage resources, logistic resources, human resources, financial resources.
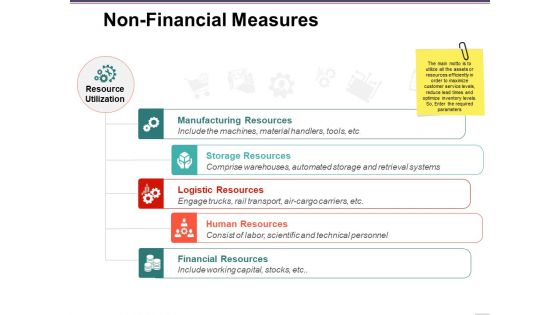
Non Financial Measures Template 3 Ppt PowerPoint Presentation Pictures Grid
This is a non financial measures template 3 ppt powerpoint presentation pictures grid. This is a five stage process. The stages in this process are manufacturing resources, storage resources, logistic resources, human resources, financial resources.
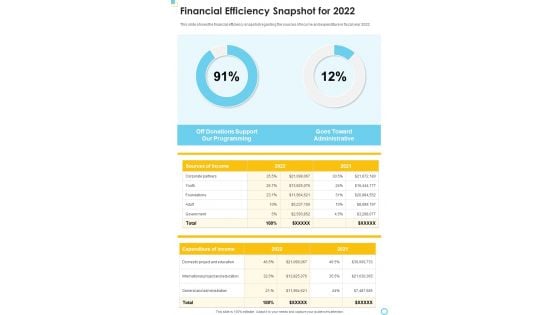
Financial Efficiency Snapshot For 2022 One Pager Documents
This slide shows the financial efficiency snapshot regarding the sources of income and expenditure in fiscal year 2022. Presenting you an exemplary Financial Efficiency Snapshot For 2022 One Pager Documents. Our one-pager comprises all the must-have essentials of an inclusive document. You can edit it with ease, as its layout is completely editable. With such freedom, you can tweak its design and other elements to your requirements. Download this Financial Efficiency Snapshot For 2022 One Pager Documents brilliant piece now.
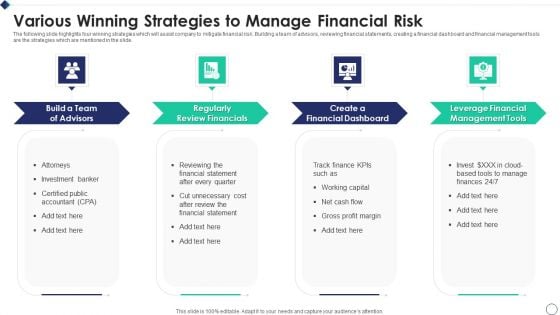
Various Winning Strategies To Manage Financial Risk Clipart PDF
The following slide highlights four winning strategies which will assist company to mitigate financial risk. Building a team of advisors, reviewing financial statements, creating a financial dashboard and financial management tools are the strategies which are mentioned in the slide. Presenting Various Winning Strategies To Manage Financial Risk Clipart PDF to dispense important information. This template comprises four stages. It also presents valuable insights into the topics including Review Financials, Financial Dashboard, Management Tools This is a completely customizable PowerPoint theme that can be put to use immediately. So, download it and address the topic impactfully.
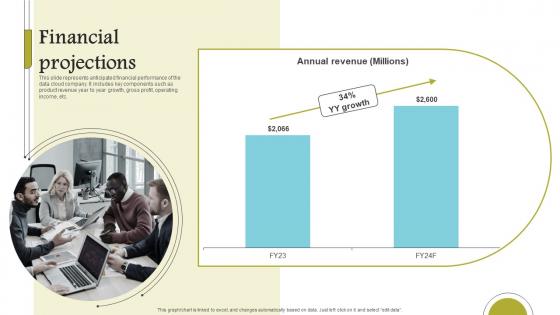
Financial Projections Cloud Data Computing Company Fund Raising Formats PDF
This slide represents anticipated financial performance of the data cloud company. It includes key components such as product revenue year to year growth, gross profit, operating income, etc. Slidegeeks is here to make your presentations a breeze with Financial Projections Cloud Data Computing Company Fund Raising Formats PDF With our easy-to-use and customizable templates, you can focus on delivering your ideas rather than worrying about formatting. With a variety of designs to choose from, you are sure to find one that suits your needs. And with animations and unique photos, illustrations, and fonts, you can make your presentation pop. So whether you are giving a sales pitch or presenting to the board, make sure to check out Slidegeeks first This slide represents anticipated financial performance of the data cloud company. It includes key components such as product revenue year to year growth, gross profit, operating income, etc.
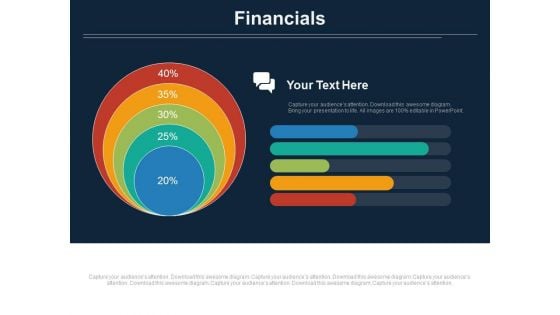
Concentric Chart With Five Financial Steps Powerpoint Slides
This PowerPoint slide contains diagram of concentric chart with five financial steps This professional slide helps to exhibit financial planning for business. Use this PowerPoint template to make impressive presentations.
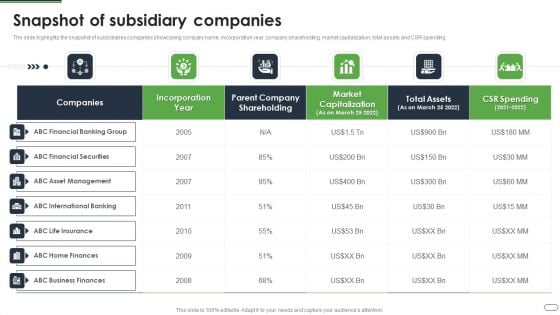
Financial Solutions Company Profile Snapshot Of Subsidiary Companies Graphics PDF
The slide highlights the snapshot of subsidiaries companies showcasing company name, incorporation year, company shareholding, market capitalization, total assets and CSR spending Deliver and pitch your topic in the best possible manner with this Financial Solutions Company Profile Snapshot Of Subsidiary Companies Graphics PDF Use them to share invaluable insights on Financial Banking, Financial Securities, Asset Management and impress your audience. This template can be altered and modified as per your expectations. So, grab it now.
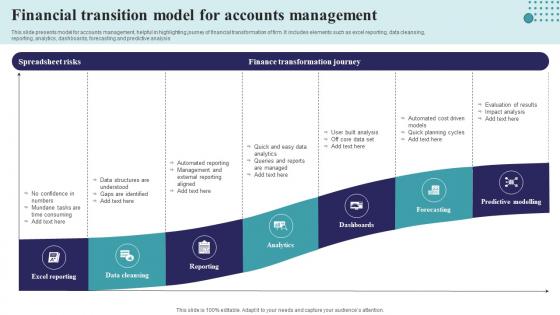
Financial Transition Model For Accounts Management Structure Pdf
This slide presents model for accounts management, helpful in highlighting journey of financial transformation of firm. It includes elements such as excel reporting, data cleansing, reporting, analytics, dashboards, forecasting and predictive analysis Pitch your topic with ease and precision using this Financial Transition Model For Accounts Management Structure Pdf This layout presents information on Excel Reporting, Data Cleansing, Reporting, Analytics It is also available for immediate download and adjustment. So, changes can be made in the color, design, graphics or any other component to create a unique layout. This slide presents model for accounts management, helpful in highlighting journey of financial transformation of firm. It includes elements such as excel reporting, data cleansing, reporting, analytics, dashboards, forecasting and predictive analysis
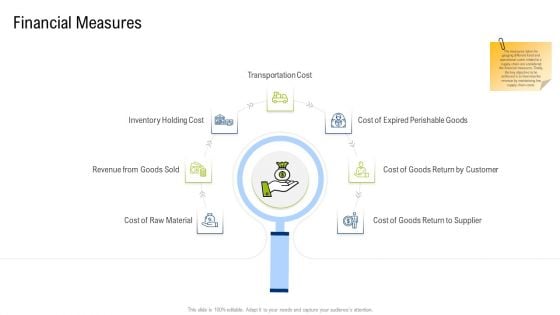
Multiple Phases For Supply Chain Management Financial Measures Guidelines PDF
This is a multiple phases for supply chain management financial measures guidelines pdf template with various stages. Focus and dispense information on seven stages using this creative set, that comes with editable features. It contains large content boxes to add your information on topics like inventory holding cost, revenue from goods sold, cost of raw material, transportation cost, cost of goods return to supplier. You can also showcase facts, figures, and other relevant content using this PPT layout. Grab it now.
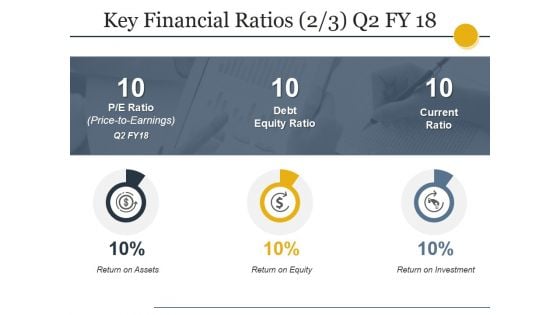
Key Financial Ratios Template Ppt PowerPoint Presentation Show Graphics Design
This is a key financial ratios template ppt powerpoint presentation show graphics design. This is a four stage process. The stages in this process are liquidity, profitability, activity, solvency.
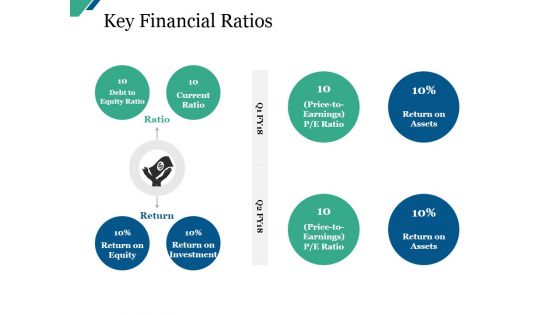
Key Financial Ratios Ppt PowerPoint Presentation Infographic Template Master Slide
This is a key financial ratios ppt powerpoint presentation infographic template master slide. This is a eight stage process. The stages in this process are debt to equity ratio, current ratio, return on equity, return on investment.
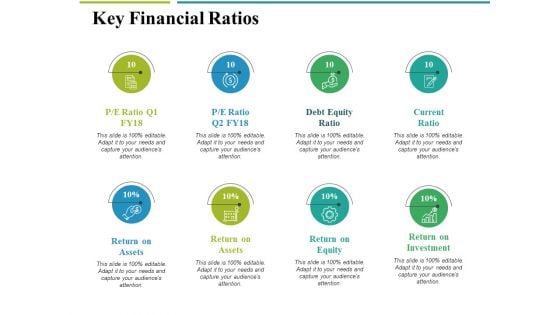
Key Financial Ratios Ppt PowerPoint Presentation Portfolio Summary
This is a key financial ratios ppt powerpoint presentation portfolio summary. This is a eight stage process. The stages in this process are return on assets, return on equity, return on investment, debt equity ratio, current ratio.
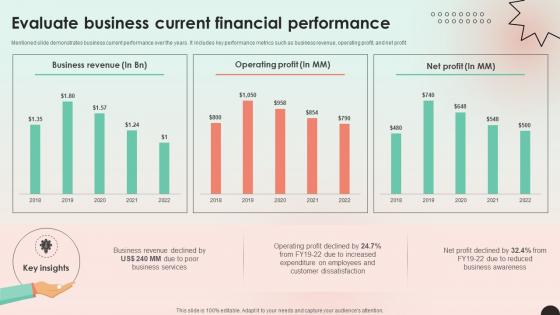
Web Consulting Business Evaluate Business Current Financial Performance
Mentioned slide demonstrates business current performance over the years. It includes key performance metrics such as business revenue, operating profit, and net profit. Are you searching for a Web Consulting Business Evaluate Business Current Financial Performance that is uncluttered, straightforward, and original Its easy to edit, and you can change the colors to suit your personal or business branding. For a presentation that expresses how much effort you have put in, this template is ideal With all of its features, including tables, diagrams, statistics, and lists, its perfect for a business plan presentation. Make your ideas more appealing with these professional slides. Download Web Consulting Business Evaluate Business Current Financial Performance from Slidegeeks today. Mentioned slide demonstrates business current performance over the years. It includes key performance metrics such as business revenue, operating profit, and net profit.
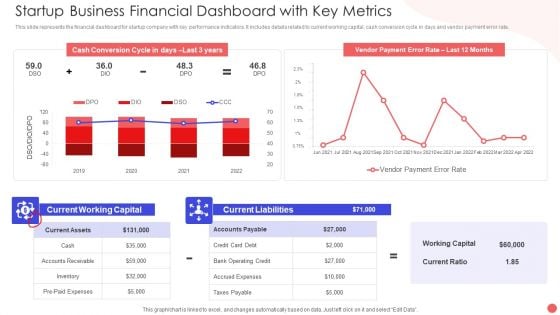
Startup Business Financial Dashboard With Key Metrics Sample PDF
This slide represents the financial dashboard for startup company with key performance indicators. It includes details related to current working capital, cash conversion cycle in days and vendor payment error rate. Pitch your topic with ease and precision using this Startup Business Financial Dashboard With Key Metrics Sample PDF. This layout presents information on Cash Conversion Cycle, Current Working Capital, Current Liabilities Debt. It is also available for immediate download and adjustment. So, changes can be made in the color, design, graphics or any other component to create a unique layout.

Quarterly Financial Performance Dashboard By Power BI Ppt Sample SS
This slide represents the pyramid showing the asset performance management. It includes details related to APM-centric, predictive, condition-based, preventive and reactive maintenance. Find a pre-designed and impeccable Quarterly Financial Performance Dashboard By Power BI Ppt Sample SS The templates can ace your presentation without additional effort. You can download these easy-to-edit presentation templates to make your presentation stand out from others. So, what are you waiting for Download the template from Slidegeeks today and give a unique touch to your presentation. This slide represents the pyramid showing the asset performance management. It includes details related to APM-centric, predictive, condition-based, preventive and reactive maintenance.
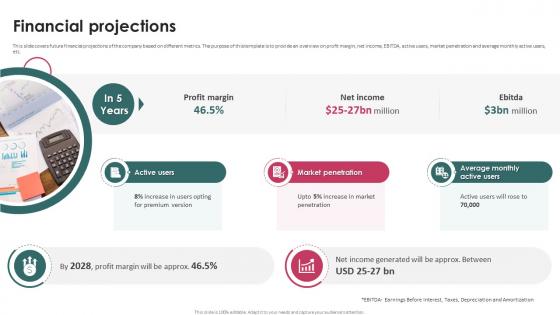
Financial Projections Task Management System Investor Funding Elevator Pitch Deck
This slide covers future financial projections of the company based on different metrics. The purpose of this template is to provide an overview on profit margin, net income, EBITDA, active users, market penetration and average monthly active users, etc. Slidegeeks is here to make your presentations a breeze with Financial Projections Task Management System Investor Funding Elevator Pitch Deck With our easy-to-use and customizable templates, you can focus on delivering your ideas rather than worrying about formatting. With a variety of designs to choose from, you are sure to find one that suits your needs. And with animations and unique photos, illustrations, and fonts, you can make your presentation pop. So whether you are giving a sales pitch or presenting to the board, make sure to check out Slidegeeks first This slide covers future financial projections of the company based on different metrics. The purpose of this template is to provide an overview on profit margin, net income, EBITDA, active users, market penetration and average monthly active users, etc.
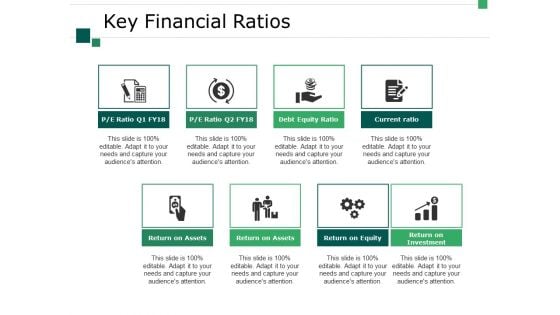
Key Financial Ratios Ppt PowerPoint Presentation Outline Slide
This is a key financial ratios ppt powerpoint presentation outline slide. This is a eight stage process. The stages in this process are return on assets, return on equity, return on investment, current ratio, debt equity ratio.
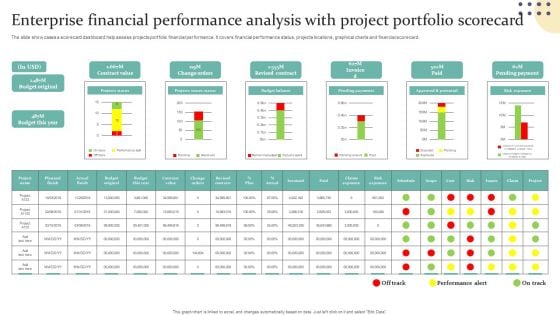
Enterprise Financial Performance Analysis With Project Portfolio Scorecard Guidelines PDF
The slide showcases a scorecard dashboard help assess projects portfolio financial performance. It covers financial performance status, projects locations, graphical charts and financial scorecard. Showcasing this set of slides titled Enterprise Financial Performance Analysis With Project Portfolio Scorecard Guidelines PDF. The topics addressed in these templates are Projects Status, Projects Issues Status, Budget Balance. All the content presented in this PPT design is completely editable. Download it and make adjustments in color, background, font etc. as per your unique business setting.
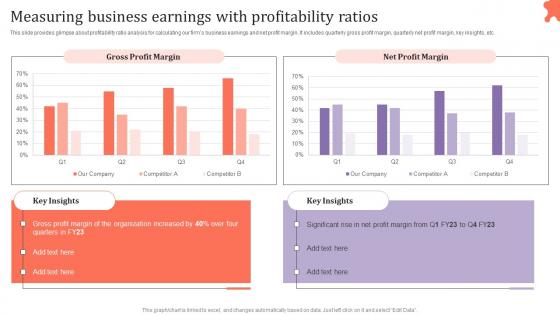
Measuring Business Earnings Assessing Corporate Financial Techniques Diagrams Pdf
This slide provides glimpse about profitability ratio analysis for calculating our firms business earnings and net profit margin. It includes quarterly gross profit margin, quarterly net profit margin, key insights, etc. Slidegeeks has constructed Measuring Business Earnings Assessing Corporate Financial Techniques Diagrams Pdf after conducting extensive research and examination. These presentation templates are constantly being generated and modified based on user preferences and critiques from editors. Here, you will find the most attractive templates for a range of purposes while taking into account ratings and remarks from users regarding the content. This is an excellent jumping off point to explore our content and will give new users an insight into our top notch PowerPoint Templates. This slide provides glimpse about profitability ratio analysis for calculating our firms business earnings and net profit margin. It includes quarterly gross profit margin, quarterly net profit margin, key insights, etc.
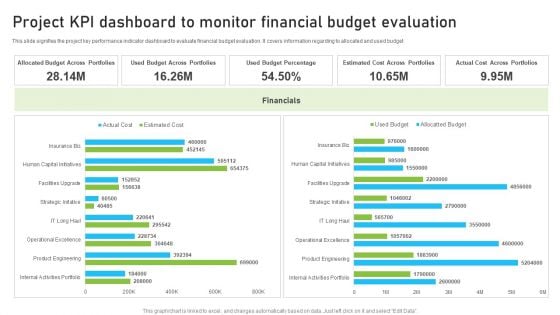
Project KPI Dashboard To Monitor Financial Budget Evaluation Demonstration PDF
This slide signifies the key performance indicator dashboard to evaluate financial estimation. It covers information regarding to expense, payable account and monthly performance. Showcasing this set of slides titled Project KPI Dashboard To Monitor Financial Budget Evaluation Demonstration PDF. The topics addressed in these templates are Project KPI Dashboard, Monitor Financial Budget Evaluation. All the content presented in this PPT design is completely editable. Download it and make adjustments in color, background, font etc. as per your unique business setting.

KPI Dashboard To Measure Financial Institution Industry Revenue Summary PDF
Pitch your topic with ease and precision using this KPI Dashboard To Measure Financial Institution Industry Revenue Summary PDF. This layout presents information on Measure Financial, Institution Industry . It is also available for immediate download and adjustment. So, changes can be made in the color, design, graphics or any other component to create a unique layout.
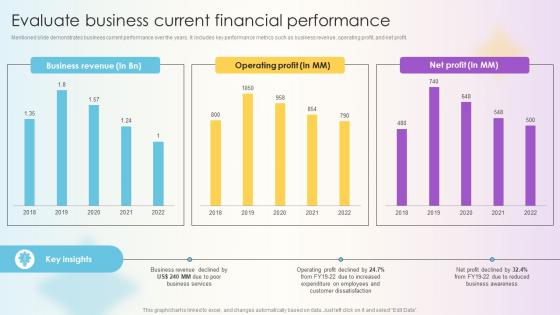
Managing Technical And Non Evaluate Business Current Financial Performance
Mentioned slide demonstrates business current performance over the years. It includes key performance metrics such as business revenue, operating profit, and net profit. The best PPT templates are a great way to save time, energy, and resources. Slidegeeks have 100 percent editable powerpoint slides making them incredibly versatile. With these quality presentation templates, you can create a captivating and memorable presentation by combining visually appealing slides and effectively communicating your message. Download Managing Technical And Non Evaluate Business Current Financial Performance from Slidegeeks and deliver a wonderful presentation. Mentioned slide demonstrates business current performance over the years. It includes key performance metrics such as business revenue, operating profit, and net profit.
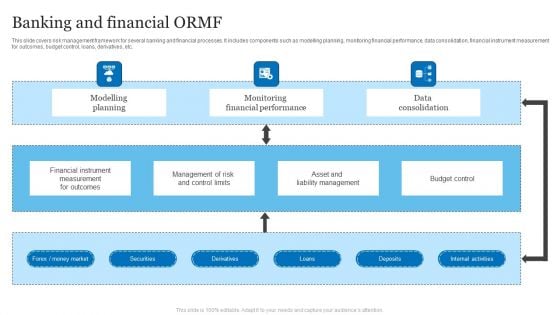
Banking And Financial ORMF Ppt PowerPoint Presentation Slides Mockup PDF
This slide covers risk management framework for several banking and financial processes. It includes components such as modelling planning, monitoring financial performance, data consolidation, financial instrument measurement for outcomes, budget control, loans, derivatives, etc.Pitch your topic with ease and precision using this Banking And Financial ORMF Ppt PowerPoint Presentation Slides Mockup PDF. This layout presents information on Modelling Planning, Financial Instrument, Measurement Outcomes. It is also available for immediate download and adjustment. So, changes can be made in the color, design, graphics or any other component to create a unique layout.
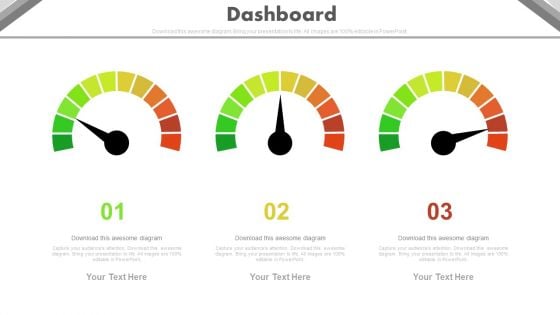
Three Steps Dashboard Charts For Financial Review Powerpoint Slides
This PowerPoint template has been designed with three dashboards. Use this PPT slide to depict financial review and plan. This professional diagram slide will help you express your views to target audience.
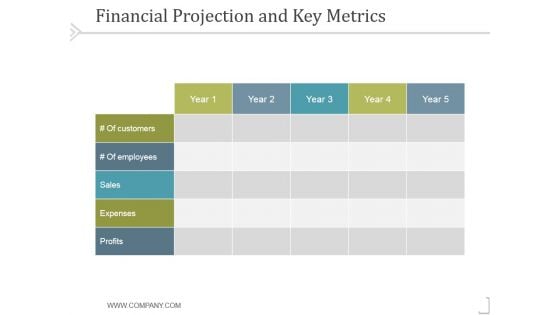
Financial Projection And Key Metrics Ppt PowerPoint Presentation Images
This is a financial projection and key metrics ppt powerpoint presentation images. This is a five stage process. The stages in this process are business, strategy, marketing, success, analysis, table.

Financial Projections And Key Metrics Ppt PowerPoint Presentation Styles Skills
This is a financial projections and key metrics ppt powerpoint presentation styles skills. This is a five stage process. The stages in this process are expenses, profits, sales, employees, years.
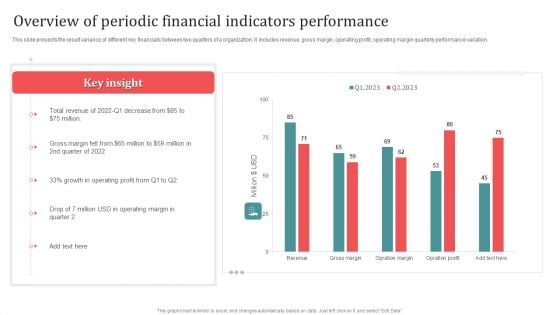
Overview Of Periodic Financial Indicators Performance Designs PDF
This slide presents the result variance of different key financials between two quarters of a organization. It includes revenue, gross margin, operating profit, operating margin quarterly performance variation. Showcasing this set of slides titled Overview Of Periodic Financial Indicators Performance Designs PDF. The topics addressed in these templates are Overview Of Periodic, Financial Indicators Performance. All the content presented in this PPT design is completely editable. Download it and make adjustments in color, background, font etc. as per your unique business setting.
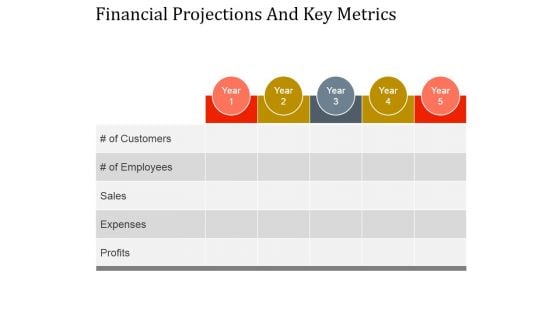
Financial Projections And Key Metrics Ppt PowerPoint Presentation Designs
This is a financial projections and key metrics ppt powerpoint presentation designs. This is a five stage process. The stages in this process are profits, expenses, sales, of employees, of customers.
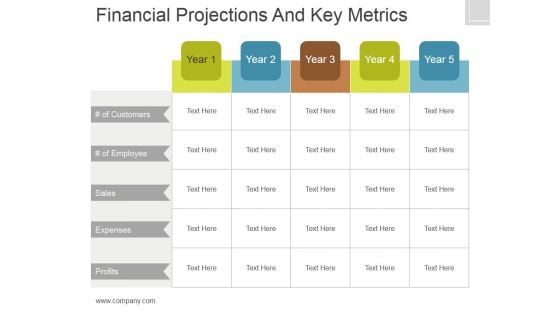
Financial Projections And Key Metrics Ppt PowerPoint Presentation Show
This is a financial projections and key metrics ppt powerpoint presentation show. This is a five stage process. The stages in this process are of customers, sales, expenses, profits.
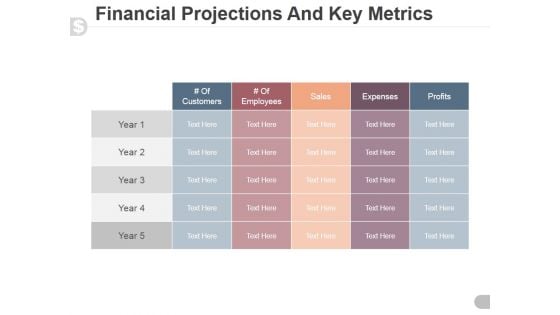
Financial Projections And Key Metrics Ppt PowerPoint Presentation Professional
This is a financial projections and key metrics ppt powerpoint presentation professional. This is a five stage process. The stages in this process are customers, employees, sales, expenses, profits.
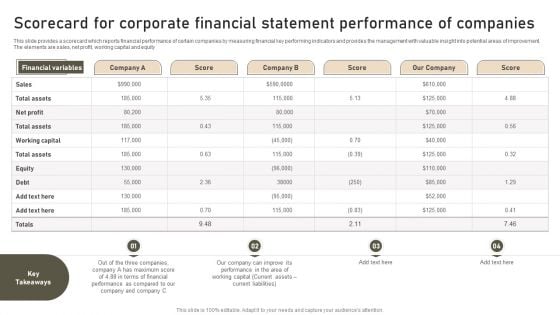
Scorecard For Corporate Financial Statement Performance Of Companies Professional PDF
This slide provides a scorecard which reports financial performance of certain companies by measuring financial key performing indicators and provides the management with valuable insight into potential areas of improvement. The elements are sales, net profit, working capital and equity. Showcasing this set of slides titled Scorecard For Corporate Financial Statement Performance Of Companies Professional PDF. The topics addressed in these templates are Terms Financial, Working Capital, Performance Compared. All the content presented in this PPT design is completely editable. Download it and make adjustments in color, background, font etc. as per your unique business setting.

Key Financial Metrics Ppt PowerPoint Presentation Portfolio Design Inspiration Cpb
Presenting this set of slides with name key financial metrics ppt powerpoint presentation portfolio design inspiration cpb. This is an editable Powerpoint four stages graphic that deals with topics like key financial metrics to help convey your message better graphically. This product is a premium product available for immediate download and is 100 percent editable in Powerpoint. Download this now and use it in your presentations to impress your audience.
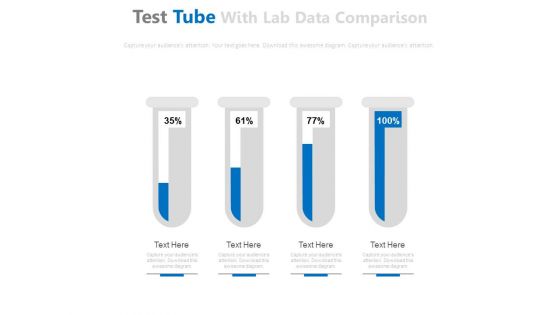
Test Tubes For Financial Ratio Analysis Powerpoint Slides
This PowerPoint template has been designed with graphics of test tubes. Use this PPT slide to depict financial ratio analysis. Download this PPT template to make impressive presentations.
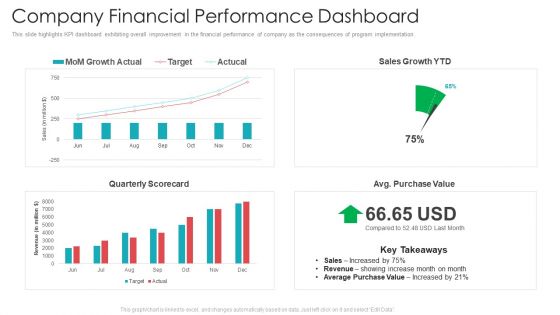
Official Team Collaboration Plan Company Financial Performance Dashboard Summary PDF
This slide highlights KPI dashboard exhibiting overall improvement in the financial performance of company as the consequences of program implementation. Deliver an awe-inspiring pitch with this creative official team collaboration plan company financial performance dashboard summary pdf bundle. Topics like company financial performance dashboard can be discussed with this completely editable template. It is available for immediate download depending on the needs and requirements of the user.
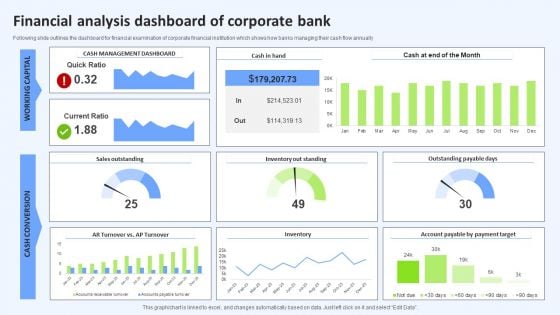
Financial Analysis Dashboard Of Corporate Bank Mockup PDF
Following slide outlines the dashboard for financial examination of corporate financial institution which shows how banks managing their cash flow annually Pitch your topic with ease and precision using this Financial Analysis Dashboard Of Corporate Bank Mockup PDF. This layout presents information on Month, Current Ratio, Inventory. It is also available for immediate download and adjustment. So, changes can be made in the color, design, graphics or any other component to create a unique layout.


 Continue with Email

 Home
Home


