Financial Kpis
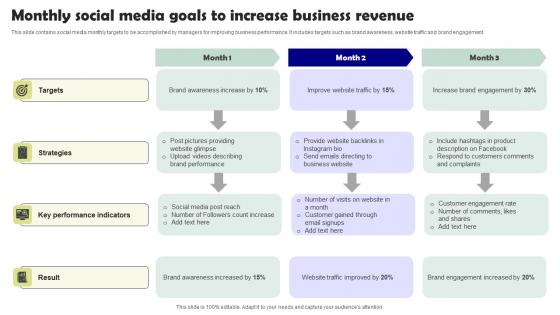
Monthly Social Media Goals To Increase Business Revenue Template Pdf
This slide contains social media monthly targets to be accomplished by managers for improving business performance. It includes targets such as brand awareness, website traffic and brand engagement. Pitch your topic with ease and precision using this Monthly Social Media Goals To Increase Business Revenue Template Pdf. This layout presents information on Targets, Strategies, Key Performance Indicators. It is also available for immediate download and adjustment. So, changes can be made in the color, design, graphics or any other component to create a unique layout. This slide contains social media monthly targets to be accomplished by managers for improving business performance. It includes targets such as brand awareness, website traffic and brand engagement.
Business Event Return On Investment Tracking Tools And Metrics Portrait Pdf
The slide displays event ROI metrics and tools that aid in determining net value and costs contributing to an events success. It contains business goals such as brand awareness. Sales revenue, event engagement, recruitment etc. event goals, ROI metrics, ROI tools, etc. Pitch your topic with ease and precision using this Business Event Return On Investment Tracking Tools And Metrics Portrait Pdf This layout presents information on Building Brand Awareness, Driving Sales Revenue, Driving Recruitment It is also available for immediate download and adjustment. So, changes can be made in the color, design, graphics or any other component to create a unique layout. The slide displays event ROI metrics and tools that aid in determining net value and costs contributing to an events success. It contains business goals such as brand awareness. Sales revenue, event engagement, recruitment etc. event goals, ROI metrics, ROI tools, etc.
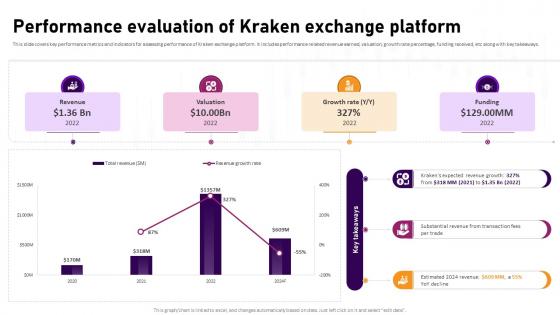
Performance Evaluation Of Kraken Exchange Platform Complete Roadmap To Blockchain BCT SS V
This slide covers key performance metrics and indicators for assessing performance of Kraken exchange platform. It includes performance related revenue earned, valuation, growth rate percentage, funding received, etc along with key takeaways. Find highly impressive Performance Evaluation Of Kraken Exchange Platform Complete Roadmap To Blockchain BCT SS V on Slidegeeks to deliver a meaningful presentation. You can save an ample amount of time using these presentation templates. No need to worry to prepare everything from scratch because Slidegeeks experts have already done a huge research and work for you. You need to download Performance Evaluation Of Kraken Exchange Platform Complete Roadmap To Blockchain BCT SS V for your upcoming presentation. All the presentation templates are 100 percent editable and you can change the color and personalize the content accordingly. Download now This slide covers key performance metrics and indicators for assessing performance of Kraken exchange platform. It includes performance related revenue earned, valuation, growth rate percentage, funding received, etc along with key takeaways.
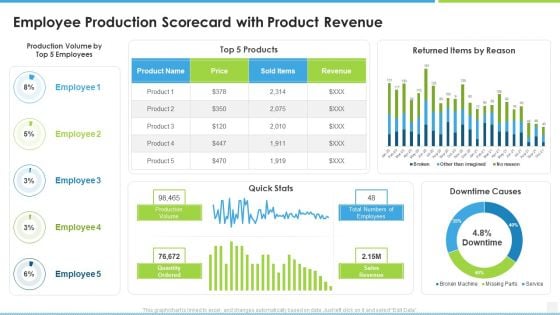
Employee Production Scorecard With Product Revenue Balanced Scorecard For Manufacturing Workforce Demonstration PDF
Deliver and pitch your topic in the best possible manner with this Employee Production Scorecard With Product Revenue Balanced Scorecard For Manufacturing Workforce Demonstration PDF. Use them to share invaluable insights on Employee Production Scorecard, Product Revenue and impress your audience. This template can be altered and modified as per your expectations. So, grab it now.
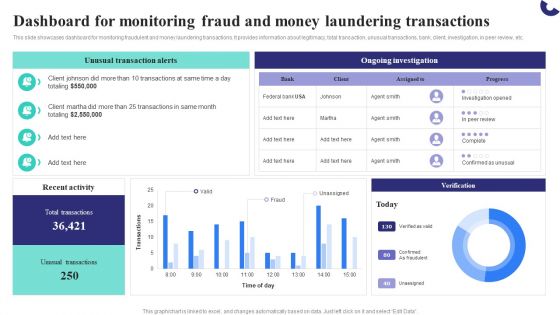
Formulating Money Laundering Dashboard For Monitoring Fraud And Money Laundering Microsoft PDF
This slide showcases dashboard for monitoring fraudulent and money laundering transactions. It provides information about legitimacy, total transaction, unusual transactions, bank, client, investigation, in peer review, etc. Slidegeeks is here to make your presentations a breeze with Formulating Money Laundering Dashboard For Monitoring Fraud And Money Laundering Microsoft PDF With our easy-to-use and customizable templates, you can focus on delivering your ideas rather than worrying about formatting. With a variety of designs to choose from, youre sure to find one that suits your needs. And with animations and unique photos, illustrations, and fonts, you can make your presentation pop. So whether youre giving a sales pitch or presenting to the board, make sure to check out Slidegeeks first.

Client Testimonials Beauty Brand Capital Raising Pitch Deck Designs Pdf
This slide shows reviews and ratings given by customers after using the products of the brand which can help investors to get an idea regarding the products performance. Create an editable Client Testimonials Beauty Brand Capital Raising Pitch Deck Designs Pdf that communicates your idea and engages your audience. Whether you are presenting a business or an educational presentation, pre designed presentation templates help save time. Client Testimonials Beauty Brand Capital Raising Pitch Deck Designs Pdf is highly customizable and very easy to edit, covering many different styles from creative to business presentations. Slidegeeks has creative team members who have crafted amazing templates. So, go and get them without any delay. This slide shows reviews and ratings given by customers after using the products of the brand which can help investors to get an idea regarding the products performance.
Developing New Product Messaging Canvas Determining Its USP Product Performance Dashboard Icons PDF
The following slide displays a brand awareness dashboard as it highlights the key metrics for measuring brand awareness such as brand search, social media searches, links, brand and mentions Deliver an awe inspiring pitch with this creative ping new product messaging canvas determining its usp product performance dashboard icons pdf bundle. Topics like product performance dashboard with total revenues can be discussed with this completely editable template. It is available for immediate download depending on the needs and requirements of the user.
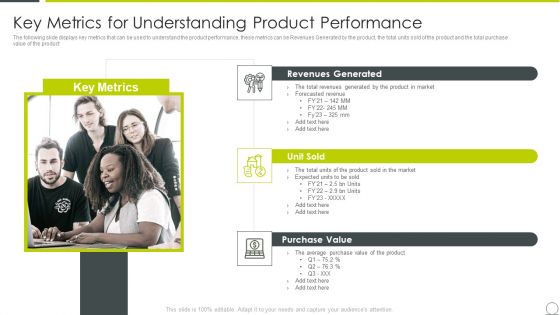
Marketing Communication Channels For Increasing Brand Awarenes Key Metrics For Understanding Inspiration PDF
The following slide displays key metrics that can be used to understand the product performance, these metrics can be Revenues Generated by the product, the total units sold of the product and the total purchase value of the product Presenting marketing communication channels for increasing brand awarenes key metrics for understanding inspiration pdf to provide visual cues and insights. Share and navigate important information on three stages that need your due attention. This template can be used to pitch topics like key metrics for understanding product performance. In addtion, this PPT design contains high resolution images, graphics, etc, that are easily editable and available for immediate download.
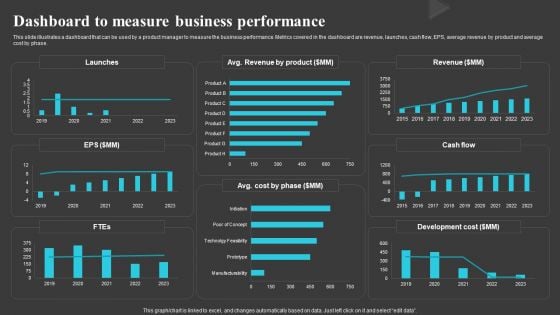
Dashboard To Measure Business Performance Creating And Offering Multiple Product Ranges In New Business Introduction PDF
This slide illustrates a dashboard that can be used by a product manager to measure the business performance. Metrics covered in the dashboard are revenue, launches, cash flow, EPS, average revenue by product and average cost by phase.There are so many reasons you need a Dashboard To Measure Business Performance Creating And Offering Multiple Product Ranges In New Business Introduction PDF. The first reason is you can notspend time making everything from scratch, Thus, Slidegeeks has made presentation templates for you too. You can easily download these templates from our website easily.

Tight Budgeting Money PowerPoint Backgrounds And Templates 1210
Microsoft PowerPoint Template and Background with Measuring tape over money, budgeting, measure money, tight budget. Money upright Our Tight Budgeting Money PowerPoint Backgrounds And Templates 1210 have more than what meets the eye. They contain additional dimensions.
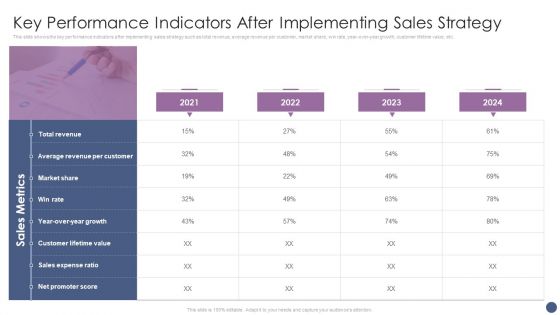
Competitive Sales Strategy Development Plan For Revenue Growth Key Performance Indicators Elements PDF
This slide shows the key performance indicators after implementing sales strategy such as total revenue, average revenue per customer, market share, win rate, year-over-year growth, customer lifetime value, etc. Presenting Competitive Sales Strategy Development Plan For Revenue Growth Key Performance Indicators Elements PDF to provide visual cues and insights. Share and navigate important information on four stages that need your due attention. This template can be used to pitch topics like Market Share, Total Revenue, Sales Expense Ratio. In addtion, this PPT design contains high resolution images, graphics, etc, that are easily editable and available for immediate download.
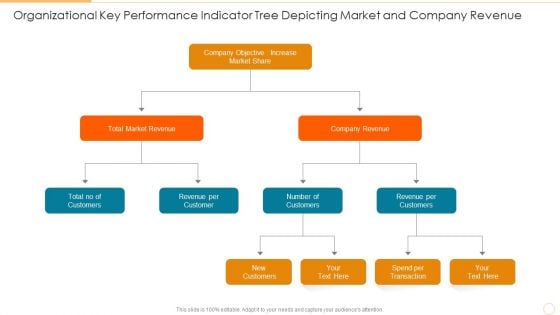
Organizational Key Performance Indicator Tree Depicting Market And Company Revenue Graphics PDF
Presenting organizational key performance indicator tree depicting market and company revenue graphics pdf to dispense important information. This template comprises three stages. It also presents valuable insights into the topics including total market revenue, company revenue, increase market share. This is a completely customizable PowerPoint theme that can be put to use immediately. So, download it and address the topic impactfully.
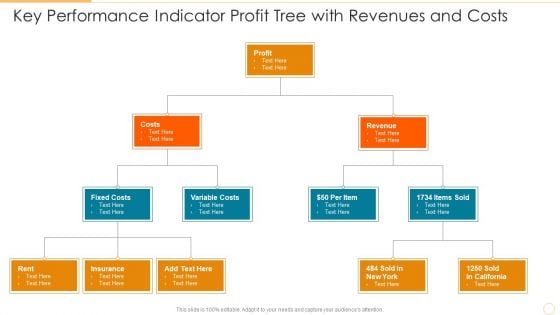
Key Performance Indicator Profit Tree With Revenues And Costs Template PDF
Presenting key performance indicator profit tree with revenues and costs template pdf to dispense important information. This template comprises three stages. It also presents valuable insights into the topics including costs, profit, revenue. This is a completely customizable PowerPoint theme that can be put to use immediately. So, download it and address the topic impactfully.
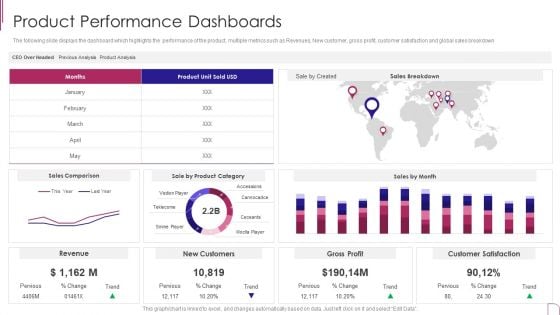
Yearly Product Performance Assessment Repor Product Performance Dashboards Designs PDF
The following slide displays the dashboard which highlights the performance of the product, multiple metrics such as Revenues, New customer, gross profit, customer satisfaction and global sales breakdown.Deliver and pitch your topic in the best possible manner with this Yearly Product Performance Assessment Repor Product Performance Dashboards Designs PDF Use them to share invaluable insights on Gross Profit, Customer Satisfaction, Sales Comparison and impress your audience. This template can be altered and modified as per your expectations. So, grab it now.
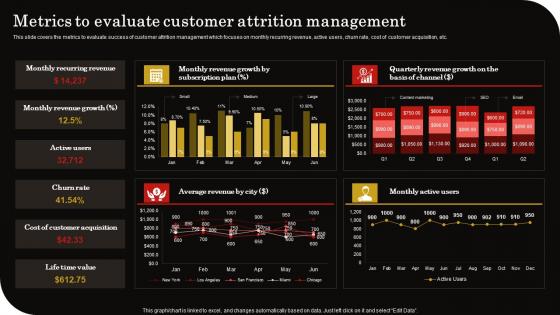
Metrics To Evaluate Customer Attrition Client Retention Strategy To Reduce Churn Rate Infographics Pdf
This slide covers the metrics to evaluate success of customer attrition management which focuses on monthly recurring revenue, active users, churn rate, cost of customer acquisition, etc. This Metrics To Evaluate Customer Attrition Client Retention Strategy To Reduce Churn Rate Infographics Pdf is perfect for any presentation, be it in front of clients or colleagues. It is a versatile and stylish solution for organizing your meetings. The Metrics To Evaluate Customer Attrition Client Retention Strategy To Reduce Churn Rate Infographics Pdf features a modern design for your presentation meetings. The adjustable and customizable slides provide unlimited possibilities for acing up your presentation. Slidegeeks has done all the homework before launching the product for you. So, do not wait, grab the presentation templates today This slide covers the metrics to evaluate success of customer attrition management which focuses on monthly recurring revenue, active users, churn rate, cost of customer acquisition, etc.
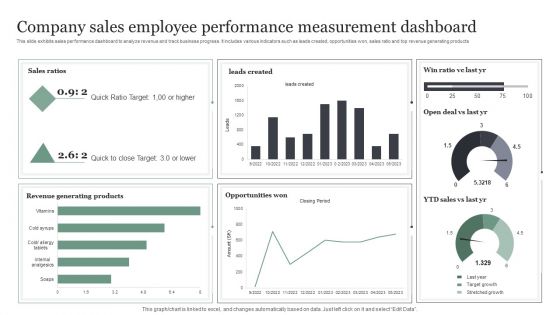
Company Sales Employee Performance Measurement Dashboard Information PDF
This slide exhibits sales performance dashboard to analyze revenue and track business progress. It includes various indicators such as leads created, opportunities won, sales ratio and top revenue generating products. Showcasing this set of slides titled Company Sales Employee Performance Measurement Dashboard Information PDF. The topics addressed in these templates are Quick Ratio Target, Opportunities Won, Revenue Generating Products. All the content presented in this PPT design is completely editable. Download it and make adjustments in color, background, font etc. as per your unique business setting.

Performance Analysis Of Binance Platform Globally Complete Roadmap To Blockchain BCT SS V
This slide covers key performance metrics and indicators for assessing performance of Binance exchange platform. It includes performance related revenue earned, profit generation along with Binance annual users for year 2017-2021. Do you have an important presentation coming up Are you looking for something that will make your presentation stand out from the rest Look no further than Performance Analysis Of Binance Platform Globally Complete Roadmap To Blockchain BCT SS V. With our professional designs, you can trust that your presentation will pop and make delivering it a smooth process. And with Slidegeeks, you can trust that your presentation will be unique and memorable. So why wait Grab Performance Analysis Of Binance Platform Globally Complete Roadmap To Blockchain BCT SS V today and make your presentation stand out from the rest This slide covers key performance metrics and indicators for assessing performance of Binance exchange platform. It includes performance related revenue earned, profit generation along with Binance annual users for year 2017-2021.
Equity Capital Funding Dashboard Ppt Model Show PDF
Deliver an awe-inspiring pitch with this creative equity capital funding dashboard ppt model show pdf bundle. Topic like dashboard can be discussed with this completely editable template. It is available for immediate download depending on the needs and requirements of the user.

Incremental Sales Kpi Measures Presentation Backgrounds
This is a incremental sales kpi measures presentation backgrounds. This is a four stage process. The stages in this process are marketing, promotion, sales revenue, social channels.
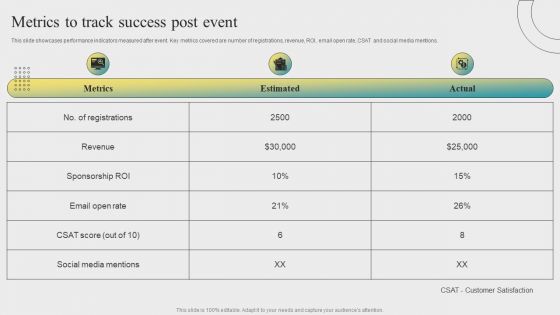
Post Event Activities Metrics To Track Success Post Event Mockup PDF
This slide showcases performance indicators measured after event. Key metrics covered are number of registrations, revenue, ROI, email open rate, CSAT and social media mentions. Slidegeeks is one of the best resources for PowerPoint templates. You can download easily and regulate Post Event Activities Metrics To Track Success Post Event Mockup PDF for your personal presentations from our wonderful collection. A few clicks is all it takes to discover and get the most relevant and appropriate templates. Use our Templates to add a unique zing and appeal to your presentation and meetings. All the slides are easy to edit and you can use them even for advertisement purposes.

Key Performance Indicator Tree Variable Revenue Ppt PowerPoint Presentation Complete Deck With Slides
This key performance indicator tree variable revenue ppt powerpoint presentation complete deck with slides acts as backup support for your ideas, vision, thoughts, etc. Use it to present a thorough understanding of the topic. This PPT slideshow can be utilized for both in-house and outside presentations depending upon your needs and business demands. Entailing twelve slides with a consistent design and theme, this template will make a solid use case. As it is intuitively designed, it suits every business vertical and industry. All you have to do is make a few tweaks in the content or any other component to design unique presentations. The biggest advantage of this complete deck is that it can be personalized multiple times once downloaded. The color, design, shapes, and other elements are free to modify to add personal touches. You can also insert your logo design in this PPT layout. Therefore a well-thought and crafted presentation can be delivered with ease and precision by downloading this key performance indicator tree variable revenue ppt powerpoint presentation complete deck with slides PPT slideshow.
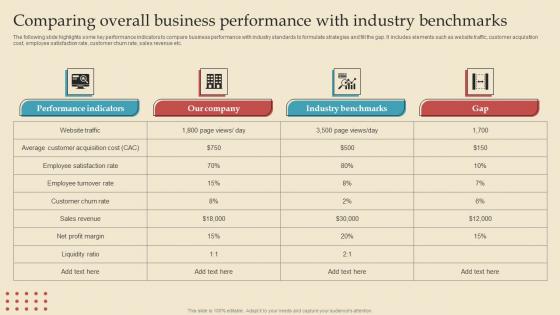
Comparing Overall Benchmarks Describing Business Performance Administration Goals Brochure Pdf
The following slide highlights some key performance indicators to compare business performance with industry standards to formulate strategies and fill the gap. It includes elements such as website traffic, customer acquisition cost, employee satisfaction rate, customer churn rate, sales revenue etc. The Comparing Overall Benchmarks Describing Business Performance Administration Goals Brochure Pdf is a compilation of the most recent design trends as a series of slides. It is suitable for any subject or industry presentation, containing attractive visuals and photo spots for businesses to clearly express their messages. This template contains a variety of slides for the user to input data, such as structures to contrast two elements, bullet points, and slides for written information. Slidegeeks is prepared to create an impression. The following slide highlights some key performance indicators to compare business performance with industry standards to formulate strategies and fill the gap. It includes elements such as website traffic, customer acquisition cost, employee satisfaction rate, customer churn rate, sales revenue etc.
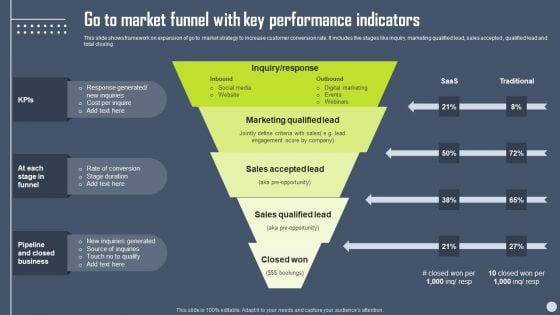
Boosting Yearly Business Revenue Go To Market Funnel With Key Performance Indicators Inspiration PDF
This slide shows framework on expansion of go to market strategy to increase customer conversion rate. It includes five stages like inquiry, marketing qualified lead, sales accepted , qualified lead and total closing. Coming up with a presentation necessitates that the majority of the effort goes into the content and the message you intend to convey. The visuals of a PowerPoint presentation can only be effective if it supplements and supports the story that is being told. Keeping this in mind our experts created Boosting Yearly Business Revenue Go To Market Funnel With Key Performance Indicators Inspiration PDF to reduce the time that goes into designing the presentation. This way, you can concentrate on the message while our designers take care of providing you with the right template for the situation.
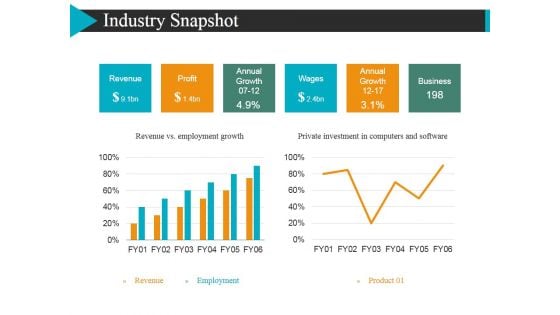
Industry Snapshot Template 2 Ppt Powerpoint Presentation Layouts Sample
This is a industry snapshot template 2 ppt powerpoint presentation layouts sample. This is a two stage process. The stages in this process are revenue, profit, annual growth, wages.
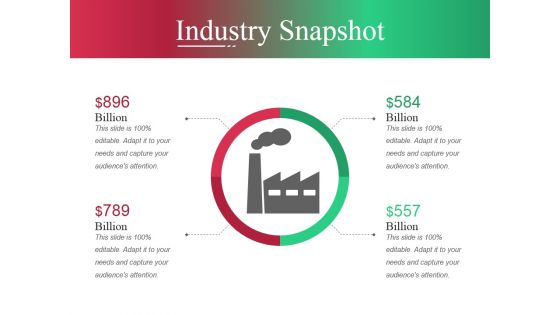
Industry Snapshot Template Ppt PowerPoint Presentation Slides Shapes
This is a industry snapshot template ppt powerpoint presentation slides shapes. This is a two stage process. The stages in this process are revenue, profit, annual growth, wages, annual growth, business.
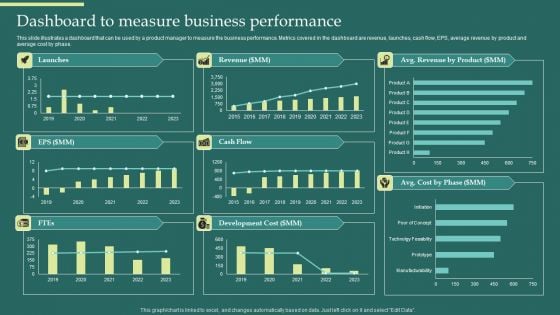
Product Portfolios And Strategic Dashboard To Measure Business Performance Portrait PDF
This slide illustrates a dashboard that can be used by a product manager to measure the business performance. Metrics covered in the dashboard are revenue, launches, cash flow, EPS, average revenue by product and average cost by phase. Do you have an important presentation coming up Are you looking for something that will make your presentation stand out from the rest Look no further than Product Portfolios And Strategic Dashboard To Measure Business Performance Portrait PDF. With our professional designs, you can trust that your presentation will pop and make delivering it a smooth process. And with Slidegeeks, you can trust that your presentation will be unique and memorable. So why wait Grab Product Portfolios And Strategic Dashboard To Measure Business Performance Portrait PDF today and make your presentation stand out from the rest.
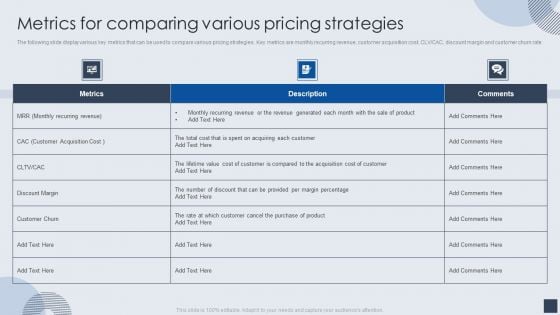
Implementing Marketing Mix Strategy To Enhance Overall Performance Metrics For Comparing Various Pricing Strategies Slides PDF
The following slide display various key metrics that can be used to compare various pricing strategies . Key metrics are monthly recurring revenue, customer acquisition cost, CLV or CAC, discount margin and customer churn rate. Deliver and pitch your topic in the best possible manner with this Implementing Marketing Mix Strategy To Enhance Overall Performance Metrics For Comparing Various Pricing Strategies Slides PDF. Use them to share invaluable insights on Metrics, Customer, Purchase Of Product and impress your audience. This template can be altered and modified as per your expectations. So, grab it now.
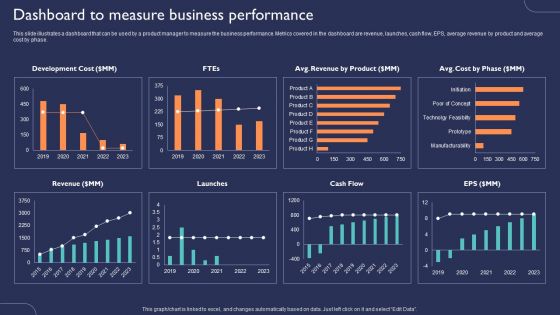
Introduction To New Product Portfolio Dashboard To Measure Business Performance Ppt Ideas Clipart Images PDF
This slide illustrates a dashboard that can be used by a product manager to measure the business performance. Metrics covered in the dashboard are revenue, launches, cash flow, EPS, average revenue by product and average cost by phase. Are you in need of a template that can accommodate all of your creative concepts. This one is crafted professionally and can be altered to fit any style. Use it with Google Slides or PowerPoint. Include striking photographs, symbols, depictions, and other visuals. Fill, move around, or remove text boxes as desired. Test out color palettes and font mixtures. Edit and save your work, or work with colleagues. Download Introduction To New Product Portfolio Dashboard To Measure Business Performance Ppt Ideas Clipart Images PDF and observe how to make your presentation outstanding. Give an impeccable presentation to your group and make your presentation unforgettable.
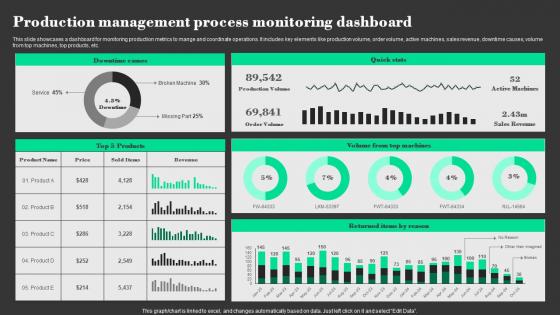
Production Management Process Monitoring Dashboard Designs Pdf
This slide showcases a dashboard for monitoring production metrics to mange and coordinate operations. It includes key elements like production volume, order volume, active machines, sales revenue, downtime causes, volume from top machines, top products, etc. Showcasing this set of slides titled Production Management Process Monitoring Dashboard Designs Pdf The topics addressed in these templates are Downtime Causes, Products, Volume From Top Machines All the content presented in this PPT design is completely editable. Download it and make adjustments in color, background, font etc. as per your unique business setting. This slide showcases a dashboard for monitoring production metrics to mange and coordinate operations. It includes key elements like production volume, order volume, active machines, sales revenue, downtime causes, volume from top machines, top products, etc.
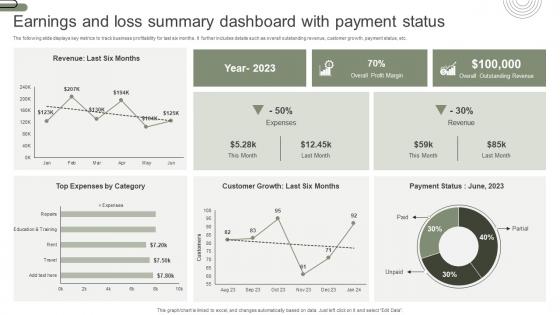
Earnings And Loss Summary Dashboard With Payment Status Elements Pdf
The following slide displays key metrics to track business profitability for last six months. It further includes details such as overall outstanding revenue, customer growth, payment status, etc. Pitch your topic with ease and precision using this Earnings And Loss Summary Dashboard With Payment Status Elements Pdf. This layout presents information on Earnings And Loss, Summary Dashboard, Payment Status. It is also available for immediate download and adjustment. So, changes can be made in the color, design, graphics or any other component to create a unique layout. The following slide displays key metrics to track business profitability for last six months. It further includes details such as overall outstanding revenue, customer growth, payment status, etc.
Saving Money For Home PowerPoint Icon S
Microsoft PowerPoint Template and Background with man saving money on white background Equip your thoughts with all accessories. Add on our Saving Money For Home PowerPoint Icon S for good measure.
Comparison Metrics Of Digital And Offline Marketing Ppt Icon Format PDF
This slide showcases essential key performance indicators of online and offline marketing. Key metrics covered are spend, lead generated, revenue and customer retention. Persuade your audience using this Comparison Metrics Of Digital And Offline Marketing Ppt Icon Format PDF. This PPT design covers four stages, thus making it a great tool to use. It also caters to a variety of topics including Lead Generated, Revenue, Customer Retention, Spend. Download this PPT design now to present a convincing pitch that not only emphasizes the topic but also showcases your presentation skills.
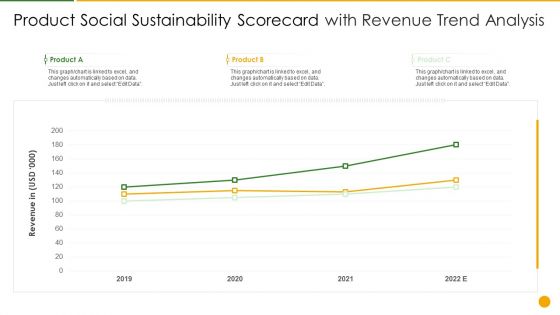
Product Social Sustainability Scorecard With Revenue Trend Analysis Download PDF
Deliver an awe inspiring pitch with this creative product social sustainability scorecard with revenue trend analysis download pdf bundle. Topics like product social sustainability scorecard with revenue trend analysis can be discussed with this completely editable template. It is available for immediate download depending on the needs and requirements of the user.
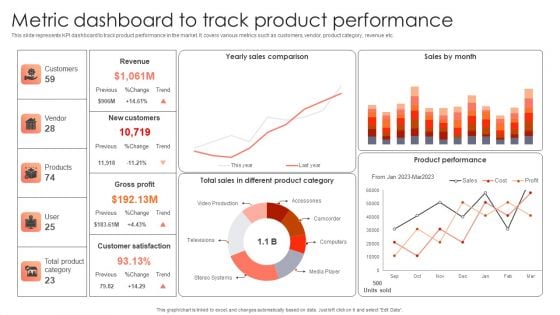
Management Plan For Product Life Cycle Metric Dashboard To Track Product Performance Infographics PDF
This slide represents KPI dashboard to track product performance in the market. It covers various metrics such as customers, vendor, product category, revenue etc. Slidegeeks has constructed Management Plan For Product Life Cycle Metric Dashboard To Track Product Performance Infographics PDF after conducting extensive research and examination. These presentation templates are constantly being generated and modified based on user preferences and critiques from editors. Here, you will find the most attractive templates for a range of purposes while taking into account ratings and remarks from users regarding the content. This is an excellent jumping-off point to explore our content and will give new users an insight into our top-notch PowerPoint Templates.
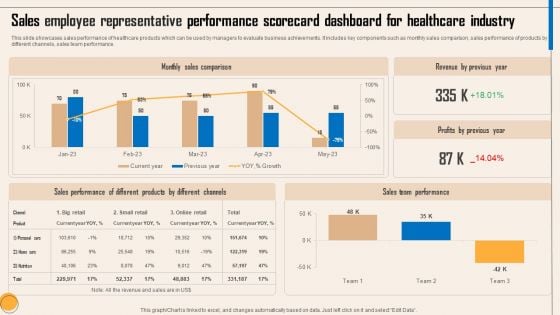
Sales Employee Representative Performance Scorecard Dashboard For Healthcare Industry Clipart PDF
This slide showcases sales performance of healthcare products which can be used by managers to evaluate business achievements. It includes key components such as monthly sales comparison, sales performance of products by different channels, sales team performance. Pitch your topic with ease and precision using this Sales Employee Representative Performance Scorecard Dashboard For Healthcare Industry Clipart PDF. This layout presents information on Monthly Sales Comparison, Revenue By Previous Year, Sales Performance, Different Products, Different Channels, Sales Team Performance . It is also available for immediate download and adjustment. So, changes can be made in the color, design, graphics or any other component to create a unique layout.

American Dream Money PowerPoint Templates And PowerPoint Backgrounds 0411
Microsoft PowerPoint Template and Background with a gold key with us banknotes Measure your team's success with our American Dream Money PowerPoint Templates And PowerPoint Backgrounds 0411. You will be at the top of your game.
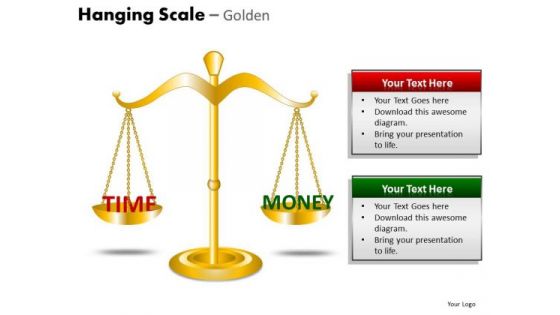
Balance Time And Money Editable PowerPoint Slides
Balance Time and Money Editable PowerPoint Slides-These high quality powerpoint pre-designed slides and powerpoint templates have been carefully created by our professional team to help you impress your audience. All slides have been created and are 100% editable in powerpoint. Each and every property of any graphic - color, size, orientation, shading, outline etc. can be modified to help you build an effective powerpoint presentation. Any text can be entered at any point in the powerpoint template or slide. Simply DOWNLOAD, TYPE and PRESENT!-These PowerPoint presentation slides can be used for themes relating to-Alternative, analysis, balance, brass, bronze, case, classic, comparison, concept, court, crime, doubt, equal, golden, guilt, icon, idea, innocence, judge, justice, law, lawsuit, legal, litigation, measure, opinion, render, scales, sign, symbol, trial, tribunal, value, weigh-Balance Time and Money Editable PowerPoint Slides Put out some feelers on our Balance Time And Money Editable PowerPoint Slides. They will extract encouraging responses.
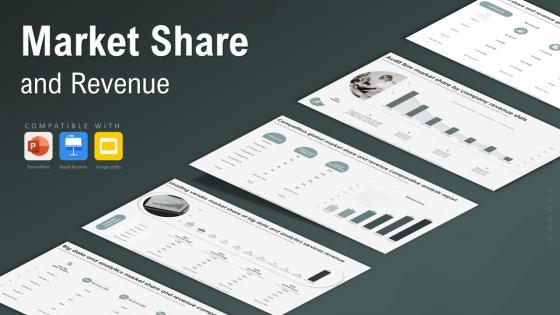
Market Share And Revenue Powerpoint Ppt
This Market Share And Revenue Powerpoint Ppt is designed to help you retain your audiences attention. This content-ready PowerPoint Template enables you to take your audience on a journey and share information in a way that is easier to recall. It helps you highlight the crucial parts of your work so that the audience does not get saddled with information download. This Market Share And Revenue From Sales, Big Data Market Share, Competitors Market Share, Unit Market And Revenue Share-slide PPT Deck comes prepared with the graphs and charts you could need to showcase your information through visuals. You only need to enter your own data in them. Download this editable PowerPoint Theme and walk into that meeting with confidence. The Market Share and Revenue PowerPoint PPT is a dynamic presentation template designed to analyze and showcase a companys market performance. It features visually appealing slides covering market share trends, revenue growth comparisons, and competitive analysis. This template includes charts, graphs, and infographics to clearly communicate key metrics and business insights. Ideal for business analysts, marketing professionals, and executives, it enables users to highlight strategic achievements, performance benchmarks, and growth opportunities effectively.
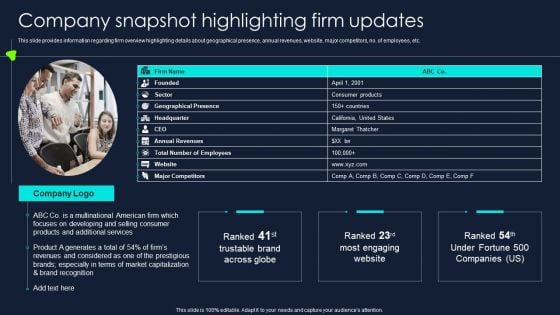
Developing Significant Business Company Snapshot Highlighting Firm Updates Topics PDF
This slide provides information regarding firm overview highlighting details about geographical presence, annual revenues, website, major competitors, no. of employees, etc. Presenting Developing Significant Business Company Snapshot Highlighting Firm Updates Topics PD to provide visual cues and insights. Share and navigate important information on one stages that need your due attention. This template can be used to pitch topics like Geographical Presence, Annual Revenues, CEO. In addtion, this PPT design contains high resolution images, graphics, etc, that are easily editable and available for immediate download.
Employee Performance Measurement And Management Pyramid Ppt Powerpoint SS
This slide illustrates detailed strategic account plan which helps to reduce acquisition cost . It includes business overview, annual account targets, revenue stream and action plan. If you are looking for a format to display your unique thoughts, then the professionally designed Employee Performance Measurement And Management Pyramid Ppt Powerpoint SS is the one for you. You can use it as a Google Slides template or a PowerPoint template. Incorporate impressive visuals, symbols, images, and other charts. Modify or reorganize the text boxes as you desire. Experiment with shade schemes and font pairings. Alter, share or cooperate with other people on your work. Download Employee Performance Measurement And Management Pyramid Ppt Powerpoint SS and find out how to give a successful presentation. Present a perfect display to your team and make your presentation unforgettable. This slide illustrates detailed strategic account plan which helps to reduce acquisition cost . It includes business overview, annual account targets, revenue stream and action plan.

Business Performance Review Dashboard To Measure Overall Business Performance Formats PDF
The following slide highlights a comprehensive quarterly business review QBR dashboard which can be used by the organization to evaluate business performance. The metrics used for review are total revenue, new customers, gross profit, overall costs, sales comparison, sales by different products and top performing channels. Showcasing this set of slides titled Business Performance Review Dashboard To Measure Overall Business Performance Formats PDF. The topics addressed in these templates are Sales Comparison, Sales Product, High Performing. All the content presented in this PPT design is completely editable. Download it and make adjustments in color, background, font etc. as per your unique business setting.

Marketing Project Performance Email Marketing Campaign To Increase Product Sales CRP SS V
This slide showcases various email marketing campaigns run to increase business sales revenue, customer base and retention rates. Slidegeeks is here to make your presentations a breeze with Marketing Project Performance Email Marketing Campaign To Increase Product Sales CRP SS V With our easy-to-use and customizable templates, you can focus on delivering your ideas rather than worrying about formatting. With a variety of designs to choose from, you are sure to find one that suits your needs. And with animations and unique photos, illustrations, and fonts, you can make your presentation pop. So whether you are giving a sales pitch or presenting to the board, make sure to check out Slidegeeks first This slide showcases various email marketing campaigns run to increase business sales revenue, customer base and retention rates.
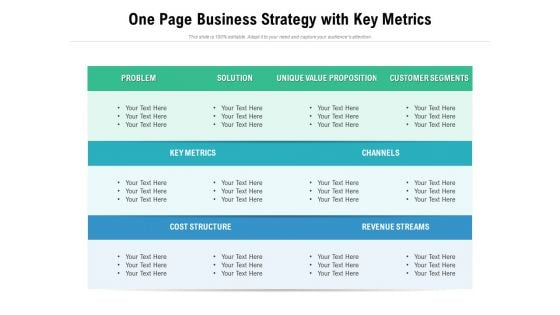
One Page Business Strategy With Key Metrics Ppt PowerPoint Presentation File Background Image PDF
Showcasing this set of slides titled one page business strategy with key metrics ppt powerpoint presentation file background image pdf. The topics addressed in these templates are metrics, revenue, cost. All the content presented in this PPT design is completely editable. Download it and make adjustments in color, background, font etc. as per your unique business setting.
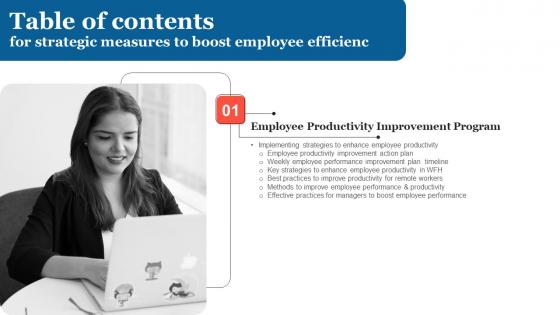
Strategic Measures To Boost Employee Efficienc Table Of Contents Themes Pdf
Make sure to capture your audiences attention in your business displays with our gratis customizable Strategic Measures To Boost Employee Efficienc Table Of Contents Themes Pdf. These are great for business strategies, office conferences, capital raising or task suggestions. If you desire to acquire more customers for your tech business and ensure they stay satisfied, create your own sales presentation with these plain slides. Our Strategic Measures To Boost Employee Efficienc Table Of Contents Themes Pdf are topically designed to provide an attractive backdrop to any subject. Use them to look like a presentation pro.
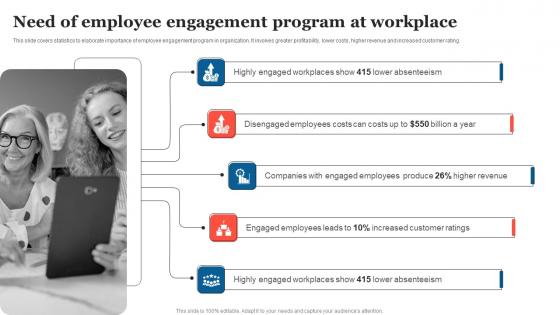
Need Of Employee Engagement Strategic Measures To Boost Employee Efficienc Formats Pdf
This slide covers statistics to elaborate importance of employee engagement program in organization. It involves greater profitability, lower costs, higher revenue and increased customer rating. Find highly impressive Need Of Employee Engagement Strategic Measures To Boost Employee Efficienc Formats Pdf on Slidegeeks to deliver a meaningful presentation. You can save an ample amount of time using these presentation templates. No need to worry to prepare everything from scratch because Slidegeeks experts have already done a huge research and work for you. You need to download Need Of Employee Engagement Strategic Measures To Boost Employee Efficienc Formats Pdf for your upcoming presentation. All the presentation templates are 100 percent editable and you can change the color and personalize the content accordingly. Download now This slide covers statistics to elaborate importance of employee engagement program in organization. It involves greater profitability, lower costs, higher revenue and increased customer rating.

Measuring Projected ROI Post Skill Building Plan For Application PPT Sample DTE SS V
This slide represents a projected return on investment of software development training program that the business earns highlighting elements investment and project revenue that helps business in strategic decision making. Crafting an eye-catching presentation has never been more straightforward. Let your presentation shine with this tasteful yet straightforward Measuring Projected ROI Post Skill Building Plan For Application PPT Sample DTE SS V template. It offers a minimalistic and classy look that is great for making a statement. The colors have been employed intelligently to add a bit of playfulness while still remaining professional. Construct the ideal Measuring Projected ROI Post Skill Building Plan For Application PPT Sample DTE SS V that effortlessly grabs the attention of your audience Begin now and be certain to wow your customers This slide represents a projected return on investment of software development training program that the business earns highlighting elements investment and project revenue that helps business in strategic decision making.
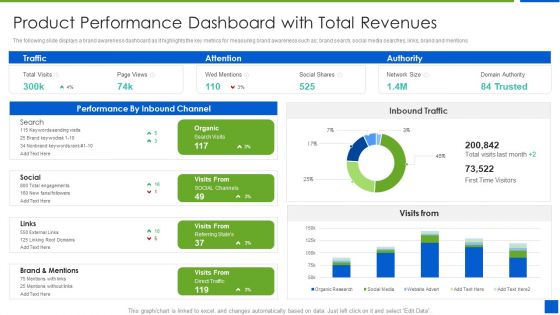
Improving Brand Recognition With Message And Differentiation Strategy Product Performance Dashboard Information PDF
The following slide displays a brand awareness dashboard as it highlights the key metrics for measuring brand awareness such as brand search, social media searches, links, brand and mentions Deliver an awe inspiring pitch with this creative improving brand recognition with message and differentiation strategy product performance dashboard information pdf bundle. Topics like product performance dashboard with total revenues can be discussed with this completely editable template. It is available for immediate download depending on the needs and requirements of the user.
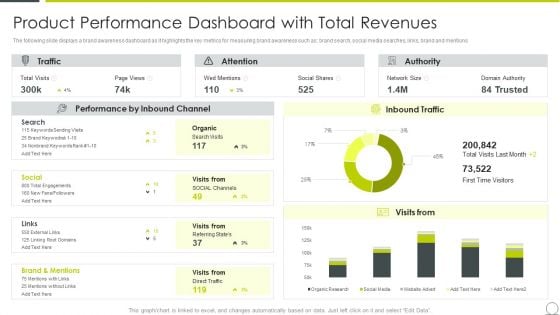
Marketing Communication Channels For Increasing Brand Awarenes Product Performance Dashboard Brochure PDF
The following slide displays a brand awareness dashboard as it highlights the key metrics for measuring brand awareness such as brand search, social media searches, links, brand and mentions Deliver an awe inspiring pitch with this creative marketing communication channels for increasing brand awarenes product performance dashboard brochure pdf bundle. Topics like product performance dashboard with total revenues can be discussed with this completely editable template. It is available for immediate download depending on the needs and requirements of the user.
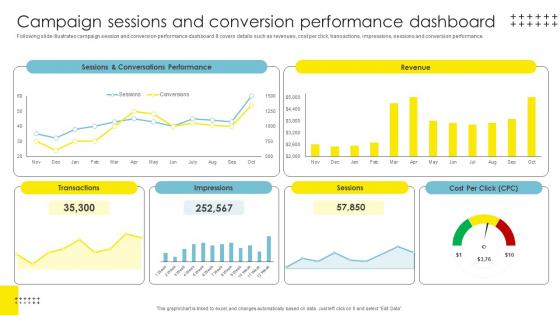
Campaign Sessions And Conversion Strategic Brand Management Template Pdf
Following slide illustrates campaign session and conversion performance dashboard. It covers details such as revenues, cost per click, transactions, impressions, sessions and conversion performance. Get a simple yet stunning designed Campaign Sessions And Conversion Strategic Brand Management Template Pdf. It is the best one to establish the tone in your meetings. It is an excellent way to make your presentations highly effective. So, download this PPT today from Slidegeeks and see the positive impacts. Our easy to edit Campaign Sessions And Conversion Strategic Brand Management Template Pdf can be your go to option for all upcoming conferences and meetings. So, what are you waiting for Grab this template today. Following slide illustrates campaign session and conversion performance dashboard. It covers details such as revenues, cost per click, transactions, impressions, sessions and conversion performance.
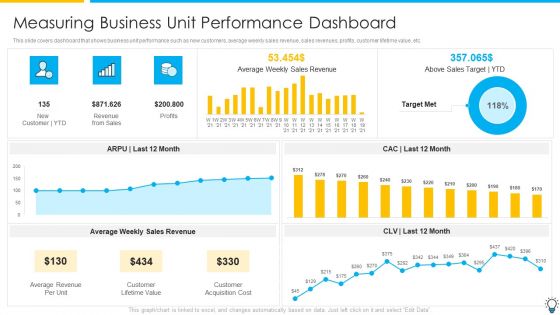
Assuring Management In Product Innovation To Enhance Processes Measuring Business Unit Performance Dashboard Inspiration PDF
This slide covers dashboard that shows business unit performance such as new customers, average weekly sales revenue, sales revenues, profits, customer lifetime value, etc.Deliver an awe inspiring pitch with this creative assuring management in product innovation to enhance processes measuring business unit performance dashboard inspiration pdf bundle. Topics like average weekly sales revenue, customer lifetime value, customer acquisition cost can be discussed with this completely editable template. It is available for immediate download depending on the needs and requirements of the user.
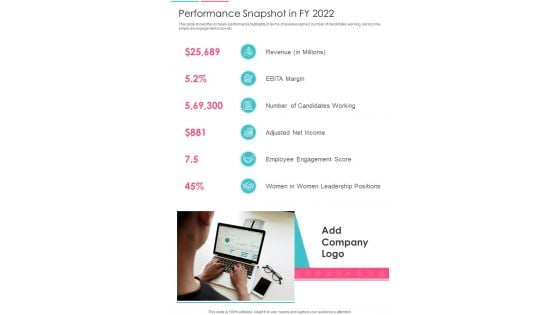
Performance Snapshot In FY 2022 One Pager Documents
This slide shows the company performance highlights in terms of revenue earned, number of candidates working, net income, employee engagement score etc. Presenting you an exemplary Performance Snapshot In FY 2022 One Pager Documents. Our one-pager comprises all the must-have essentials of an inclusive document. You can edit it with ease, as its layout is completely editable. With such freedom, you can tweak its design and other elements to your requirements. Download this Performance Snapshot In FY 2022 One Pager Documents brilliant piece now.
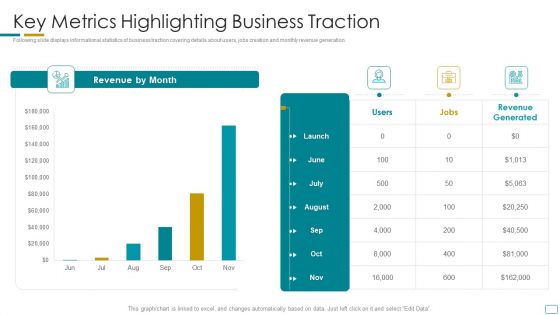
Fundraising Pitch Deck For Startup Company Key Metrics Highlighting Business Traction Template PDF
Following slide displays informational statistics of business traction covering details about users, jobs creation and monthly revenue generation. Deliver and pitch your topic in the best possible manner with this fundraising pitch deck for startup company key metrics highlighting business traction template pdf. Use them to share invaluable insights on key metrics highlighting business traction and impress your audience. This template can be altered and modified as per your expectations. So, grab it now.
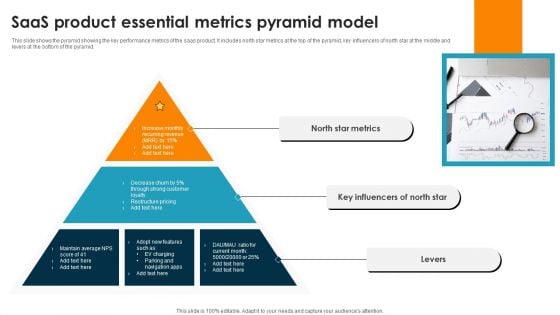
Saas Product Essential Metrics Pyramid Model Ppt PowerPoint Presentation Portfolio Layout PDF
This slide shows the pyramid showing the key performance metrics of the saas product. It includes north star metrics at the top of the pyramid, key influencers of north star at the middle and levers at the bottom of the pyramid.Presenting Saas Product Essential Metrics Pyramid Model Ppt PowerPoint Presentation Portfolio Layout PDF to dispense important information. This template comprises one stage. It also presents valuable insights into the topics including Strong Customer, Increase Monthly, Recurring Revenue. This is a completely customizable PowerPoint theme that can be put to use immediately. So, download it and address the topic impactfully.

Building Trust With IoT Security And Privacy Measures IoT CD V
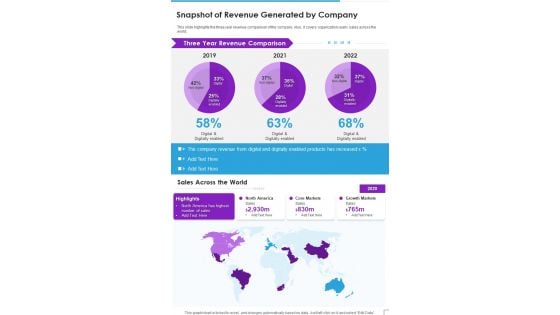
Snapshot Of Revenue Generated By Company Template 348 One Pager Documents
This slide highlights the three year revenue comparison of the company. Also, it covers organization yearly sales across the world. Presenting you a fantastic Snapshot Of Revenue Generated By Company Template 348 One Pager Documents. This piece is crafted on hours of research and professional design efforts to ensure you have the best resource. It is completely editable and its design allow you to rehash its elements to suit your needs. Get this Snapshot Of Revenue Generated By Company Template 348 One Pager Documents A4 One-pager now.
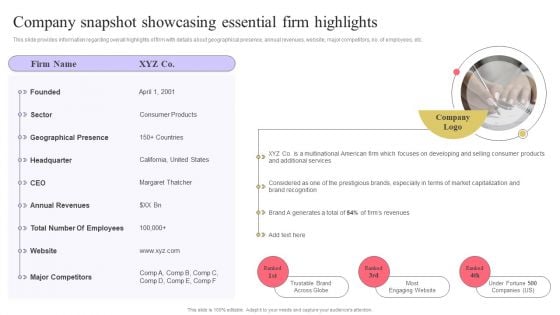
Strengthen Customer Relation Company Snapshot Showcasing Essential Firm Summary PDF
This slide provides information regarding overall highlights of firm with details about geographical presence, annual revenues, website, major competitors, no. of employees, etc. If your project calls for a presentation, then Slidegeeks is your go-to partner because we have professionally designed, easy-to-edit templates that are perfect for any presentation. After downloading, you can easily edit Strengthen Customer Relation Company Snapshot Showcasing Essential Firm Summary PDF and make the changes accordingly. You can rearrange slides or fill them with different images. Check out all the handy templates
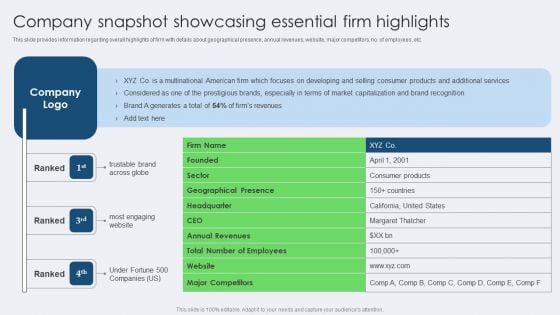
Company Snapshot Showcasing Essential Firm Highlights Infographics PDF
This slide provides information regarding overall highlights of firm with details about geographical presence, annual revenues, website, major competitors, no. of employees, etc. From laying roadmaps to briefing everything in detail, our templates are perfect for you. You can set the stage with your presentation slides. All you have to do is download these easy to edit and customizable templates. Company Snapshot Showcasing Essential Firm Highlights Infographics PDF will help you deliver an outstanding performance that everyone would remember and praise you for. Do download this presentation today.
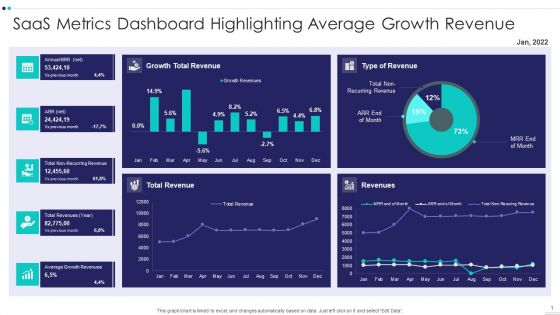
Saas Metrics Dashboard Highlighting Average Growth Revenue Diagrams PDF
Showcasing this set of slides titled Saas Metrics Dashboard Highlighting Average Growth Revenue Diagrams PDF The topics addressed in these templates are Saas Metrics Dashboard Highlighting Average Growth Revenue All the content presented in this PPT design is completely editable. Download it and make adjustments in color, background, font etc. as per your unique business setting.

Saas Metrics Dashboard Illustrating Revenue Growth Rate Demonstration PDF
Showcasing this set of slides titled Saas Metrics Dashboard Illustrating Revenue Growth Rate Demonstration PDF The topics addressed in these templates are Saas Metrics Dashboard Illustrating Revenue Growth Rate All the content presented in this PPT design is completely editable. Download it and make adjustments in color, background, font etc. as per your unique business setting.
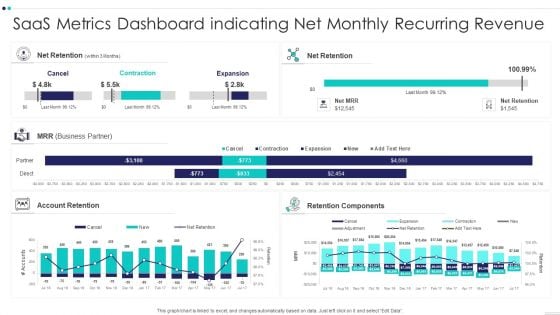
Saas Metrics Dashboard Indicating Net Monthly Recurring Revenue Information PDF
Showcasing this set of slides titled Saas Metrics Dashboard Indicating Net Monthly Recurring Revenue Information PDF The topics addressed in these templates are Saas Metrics Dashboard Indicating Net Monthly Recurring Revenue All the content presented in this PPT design is completely editable. Download it and make adjustments in color, background, font etc. as per your unique business setting.


 Continue with Email

 Home
Home


