Financial Kpis
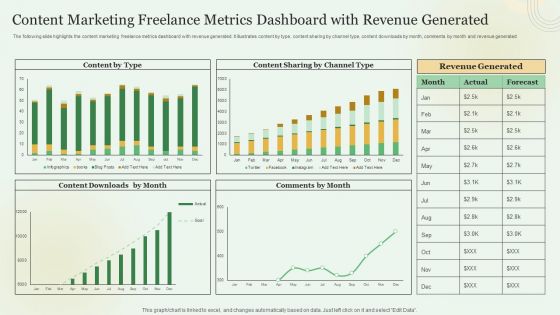
Content Marketing Freelance Metrics Dashboard With Revenue Generated Demonstration PDF
Showcasing this set of slides titled Content Marketing Freelance Metrics Dashboard With Revenue Generated Demonstration PDF. The topics addressed in these templates are Content Marketing, Freelance Metrics Dashboard, Revenue Generated. All the content presented in this PPT design is completely editable. Download it and make adjustments in color, background, font etc. as per your unique business setting.
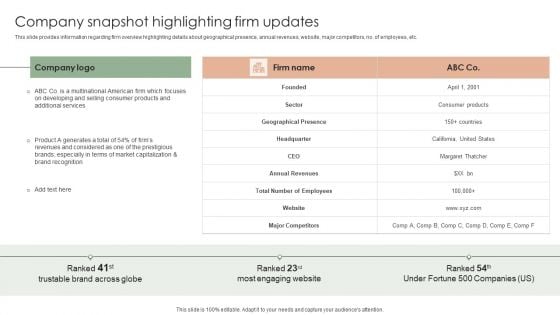
Implementing Effective Strategy Company Snapshot Highlighting Firm Updates Structure PDF
This slide provides information regarding firm overview highlighting details about geographical presence, annual revenues, website, major competitors, no. of employees, etc. Are you searching for a Implementing Effective Strategy Company Snapshot Highlighting Firm Updates Structure PDF that is uncluttered, straightforward, and original Its easy to edit, and you can change the colors to suit your personal or business branding. For a presentation that expresses how much effort youve put in, this template is ideal With all of its features, including tables, diagrams, statistics, and lists, its perfect for a business plan presentation. Make your ideas more appealing with these professional slides. Download Implementing Effective Strategy Company Snapshot Highlighting Firm Updates Structure PDF from Slidegeeks today.

Measuring Customer Satisfaction Improving Customer Retention PPT Template
The following slide covers KPI dashboard to evaluate customer satisfaction score. It includes elements such as requests answered, total revenue, service level, cost per support, retention rate, average time taken to resolve an issue etc. This modern and well-arranged Measuring Customer Satisfaction Improving Customer Retention PPT Template provides lots of creative possibilities. It is very simple to customize and edit with the Powerpoint Software. Just drag and drop your pictures into the shapes. All facets of this template can be edited with Powerpoint, no extra software is necessary. Add your own material, put your images in the places assigned for them, adjust the colors, and then you can show your slides to the world, with an animated slide included. The following slide covers KPI dashboard to evaluate customer satisfaction score. It includes elements such as requests answered, total revenue, service level, cost per support, retention rate, average time taken to resolve an issue etc.

Measuring Customer Satisfaction Enhancing Customer Experience Ppt Sample
The following slide covers KPI dashboard to evaluate customer satisfaction score. It includes elements such as requests answered, total revenue, service level, cost per support, retention rate, average time taken to resolve an issue etc. This modern and well-arranged Measuring Customer Satisfaction Enhancing Customer Experience Ppt Sample provides lots of creative possibilities. It is very simple to customize and edit with the Powerpoint Software. Just drag and drop your pictures into the shapes. All facets of this template can be edited with Powerpoint, no extra software is necessary. Add your own material, put your images in the places assigned for them, adjust the colors, and then you can show your slides to the world, with an animated slide included. The following slide covers KPI dashboard to evaluate customer satisfaction score. It includes elements such as requests answered, total revenue, service level, cost per support, retention rate, average time taken to resolve an issue etc.
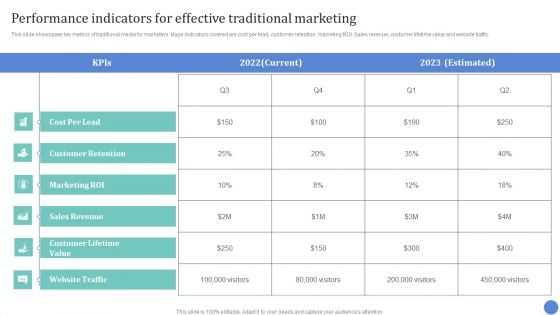
Conventional Media Channels Performance Indicators For Effective Traditional Marketing Themes PDF
This slide showcases key metrics of traditional media for marketers. Major indicators covered are cost per lead, customer retention, marketing ROI. Sales revenue, customer lifetime value and website traffic. From laying roadmaps to briefing everything in detail, our templates are perfect for you. You can set the stage with your presentation slides. All you have to do is download these easy to edit and customizable templates. Conventional Media Channels Performance Indicators For Effective Traditional Marketing Themes PDF will help you deliver an outstanding performance that everyone would remember and praise you for. Do download this presentation today.
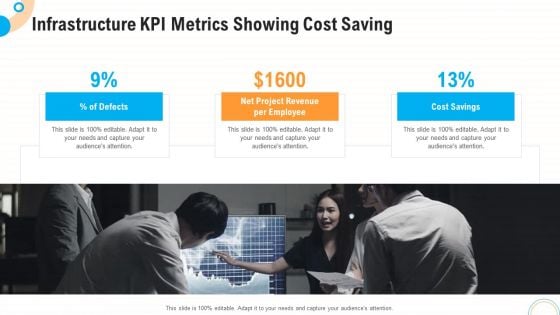
Fiscal And Operational Assessment Infrastructure KPI Metrics Showing Cost Saving Microsoft PDF
Presenting fiscal and operational assessment infrastructure kpi metrics showing cost saving microsoft pdf to provide visual cues and insights. Share and navigate important information on three stages that need your due attention. This template can be used to pitch topics like infrastructure kpi metrics showing cost saving. In addtion, this PPT design contains high resolution images, graphics, etc, that are easily editable and available for immediate download.
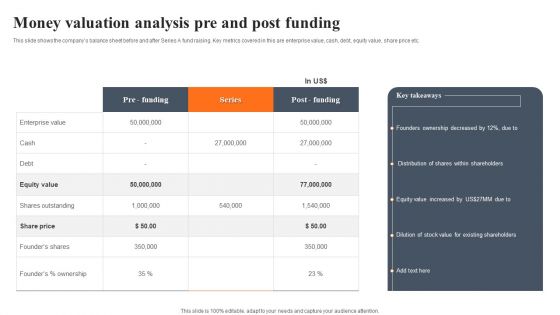
Money Valuation Analysis Pre And Post Funding Formats PDF
This slide shows the companys balance sheet before and after Series A fund raising. Key metrics covered in this are enterprise value, cash, debt, equity value, share price etc. Showcasing this set of slides titled Money Valuation Analysis Pre And Post Funding Formats PDF. The topics addressed in these templates are Share Price, Equity Value, Enterprise Value. All the content presented in this PPT design is completely editable. Download it and make adjustments in color, background, font etc. as per your unique business setting.
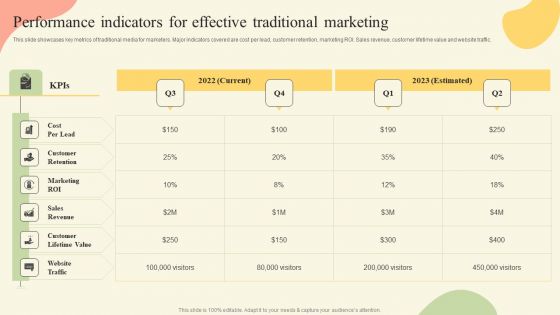
Offline Media Channel Analysis Performance Indicators For Effective Traditional Marketing Elements PDF
This slide showcases key metrics of traditional media for marketers. Major indicators covered are cost per lead, customer retention, marketing ROI. Sales revenue, customer lifetime value and website traffic. Want to ace your presentation in front of a live audience Our Offline Media Channel Analysis Performance Indicators For Effective Traditional Marketing Elements PDF can help you do that by engaging all the users towards you.. Slidegeeks experts have put their efforts and expertise into creating these impeccable powerpoint presentations so that you can communicate your ideas clearly. Moreover, all the templates are customizable, and easy-to-edit and downloadable. Use these for both personal and commercial use.
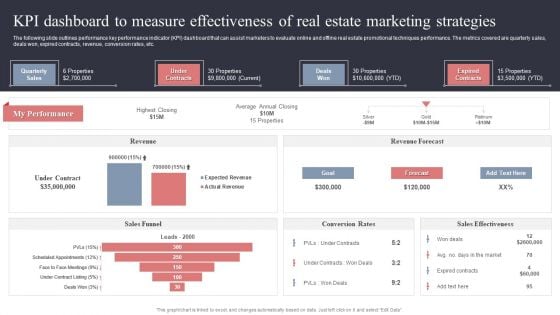
KPI Dashboard To Measure Effectiveness Of Real Estate Marketing Strategies Inspiration PDF
The following slide outlines performance key performance indicator KPI dashboard that can assist marketers to evaluate online and offline real estate promotional techniques performance. The metrics covered are quarterly sales, deals won, expired contracts, revenue, conversion rates, etc. Coming up with a presentation necessitates that the majority of the effort goes into the content and the message you intend to convey. The visuals of a PowerPoint presentation can only be effective if it supplements and supports the story that is being told. Keeping this in mind our experts created KPI Dashboard To Measure Effectiveness Of Real Estate Marketing Strategies Inspiration PDF to reduce the time that goes into designing the presentation. This way, you can concentrate on the message while our designers take care of providing you with the right template for the situation.
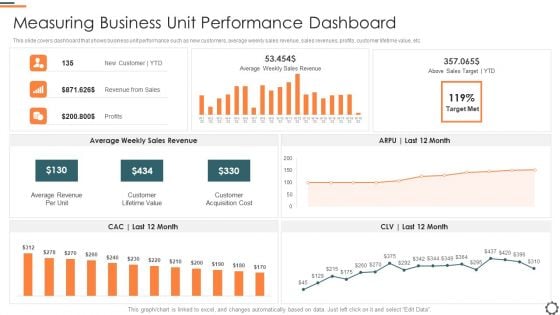
Agile Group For Product Development Measuring Business Unit Performance Dashboard Pictures PDF
This slide covers dashboard that shows business unit performance such as new customers, average weekly sales revenue, sales revenues, profits, customer lifetime value, etc. Deliver and pitch your topic in the best possible manner with this agile group for product development measuring business unit performance dashboard pictures pdf. Use them to share invaluable insights on average revenue per unit, customer lifetime value, customer acquisition cost and impress your audience. This template can be altered and modified as per your expectations. So, grab it now.
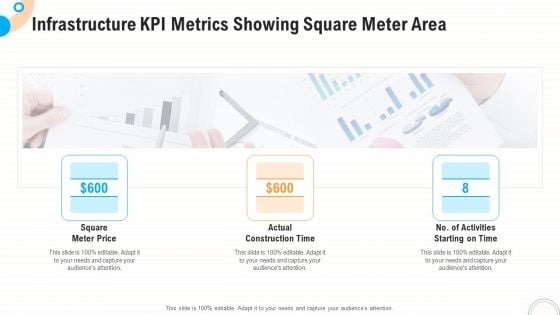
Fiscal And Operational Assessment Infrastructure KPI Metrics Showing Square Meter Area Guidelines PDF
Presenting fiscal and operational assessment infrastructure kpi metrics showing square meter area guidelines pdf to provide visual cues and insights. Share and navigate important information on three stages that need your due attention. This template can be used to pitch topics like square meter price, actual construction time, activities starting. In addtion, this PPT design contains high resolution images, graphics, etc, that are easily editable and available for immediate download.
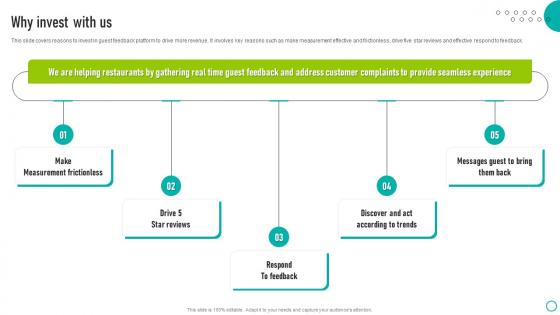
Why Invest With Us Ovation Capital Funding Pitch Deck Clipart Pdf
This slide covers reasons to invest in guest feedback platform to drive more revenue. It involves key reasons such as make measurement effective and frictionless, drive five star reviews and effective respond to feedback. Want to ace your presentation in front of a live audience Our Why Invest With Us Ovation Capital Funding Pitch Deck Clipart Pdf can help you do that by engaging all the users towards you. Slidegeeks experts have put their efforts and expertise into creating these impeccable powerpoint presentations so that you can communicate your ideas clearly. Moreover, all the templates are customizable, and easy to edit and downloadable. Use these for both personal and commercial use. This slide covers reasons to invest in guest feedback platform to drive more revenue. It involves key reasons such as make measurement effective and frictionless, drive five star reviews and effective respond to feedback.
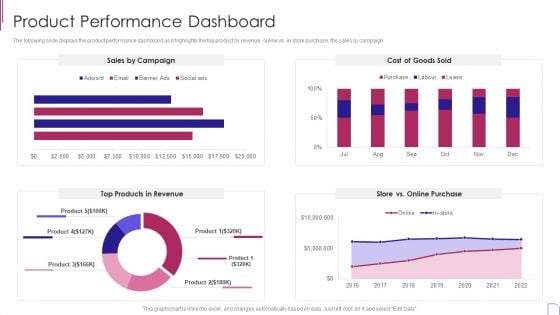
Yearly Product Performance Assessment Repor Product Performance Dashboard Download PDF
The following slide displays the product performance dashboard as it highlights the top product by revenue, online vs. in store purchase, the sales by campaign.Deliver an awe inspiring pitch with this creative Yearly Product Performance Assessment Repor Product Performance Dashboard Download PDF bundle. Topics like Products, Revenue, Online Purchase can be discussed with this completely editable template. It is available for immediate download depending on the needs and requirements of the user.
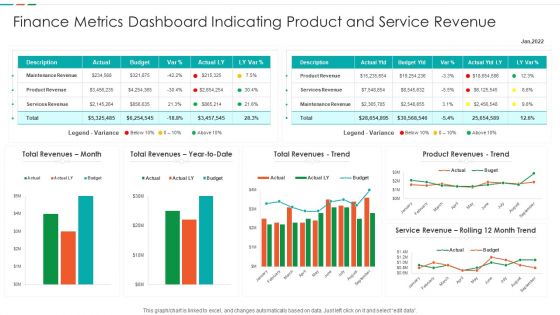
Finance Metrics Dashboard Indicating Product And Service Revenue Designs PDF
This graph or chart is linked to excel, and changes automatically based on data. Just left click on it and select edit data. Showcasing this set of slides titled Finance Metrics Dashboard Indicating Product And Service Revenue Designs PDF. The topics addressed in these templates are Maintenance Revenue Product, Revenue Product Revenues, Service Revenue Rolling. All the content presented in this PPT design is completely editable. Download it and make adjustments in color, background, font etc. as per your unique business setting.
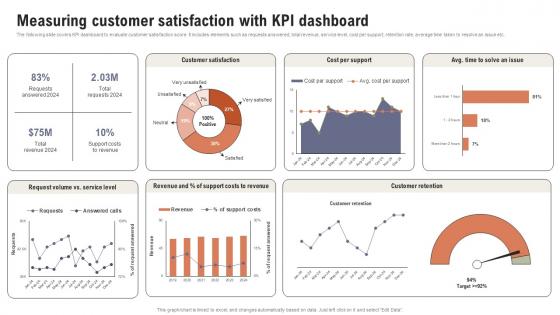
Measuring Customer Satisfaction With KPI Boosting Customer Retention Rate With Live Chat
The following slide covers KPI dashboard to evaluate customer satisfaction score. It includes elements such as requests answered, total revenue, service level, cost per support, retention rate, average time taken to resolve an issue etc. This modern and well-arranged Measuring Customer Satisfaction With KPI Boosting Customer Retention Rate With Live Chat provides lots of creative possibilities. It is very simple to customize and edit with the Powerpoint Software. Just drag and drop your pictures into the shapes. All facets of this template can be edited with Powerpoint, no extra software is necessary. Add your own material, put your images in the places assigned for them, adjust the colors, and then you can show your slides to the world, with an animated slide included. The following slide covers KPI dashboard to evaluate customer satisfaction score. It includes elements such as requests answered, total revenue, service level, cost per support, retention rate, average time taken to resolve an issue etc.
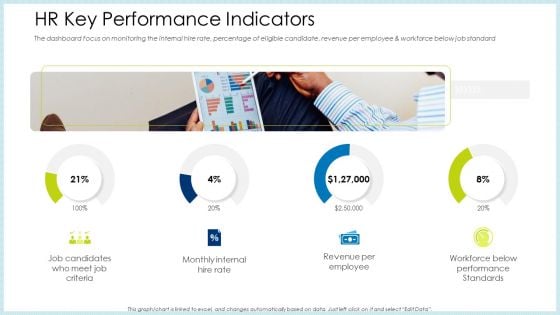
Technology Innovation Human Resource System HR Key Performance Indicators Ppt Styles Designs Download PDF
The dashboard focus on monitoring the internal hire rate, percentage of eligible candidate, revenue per employee and workforce below job standard. Presenting technology innovation human resource system hr key performance indicators ppt styles designs download pdf to provide visual cues and insights. Share and navigate important information on four stages that need your due attention. This template can be used to pitch topics like revenue per employee, performance standards, internal rate. In addition, this PPT design contains high-resolution images, graphics, etc, that are easily editable and available for immediate download.
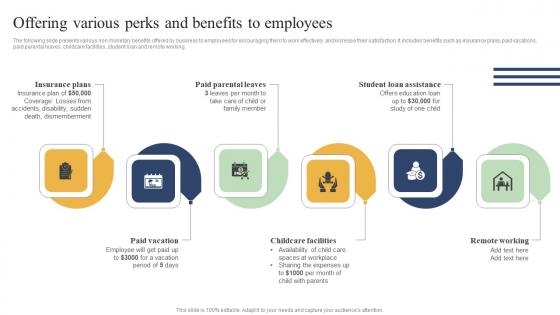
Action Measures To Build Staff Offering Various Perks And Benefits To Employees Graphics Pdf
The following slide presents various non monetary benefits offered by business to employees for encouraging them to work effectively and increase their satisfaction. It includes benefits such as insurance plans, paid vacations, paid parental leaves, childcare facilities, student loan and remote working. Retrieve professionally designed Action Measures To Build Staff Offering Various Perks And Benefits To Employees Graphics Pdf to effectively convey your message and captivate your listeners. Save time by selecting pre-made slideshows that are appropriate for various topics, from business to educational purposes. These themes come in many different styles, from creative to corporate, and all of them are easily adjustable and can be edited quickly. Access them as PowerPoint templates or as Google Slides themes. You do not have to go on a hunt for the perfect presentation because Slidegeeks got you covered from everywhere. The following slide presents various non monetary benefits offered by business to employees for encouraging them to work effectively and increase their satisfaction. It includes benefits such as insurance plans, paid vacations, paid parental leaves, childcare facilities, student loan and remote working.
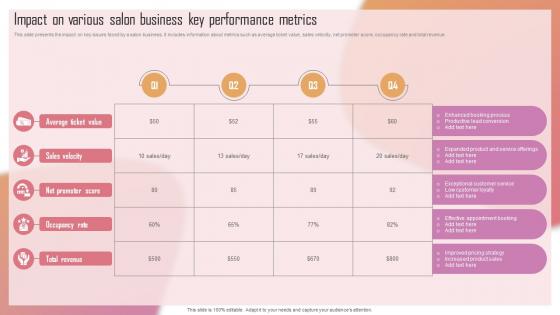
Customizing The Salon Experience Impact On Various Salon Business Key Performance Metrics Strategy SS V
This slide presents the impact on key issues faced by a salon business. It includes information about metrics such as average ticket value, sales velocity, net promoter score, occupancy rate and total revenue. Presenting this PowerPoint presentation, titled Customizing The Salon Experience Impact On Various Salon Business Key Performance Metrics Strategy SS V, with topics curated by our researchers after extensive research. This editable presentation is available for immediate download and provides attractive features when used. Download now and captivate your audience. Presenting this Customizing The Salon Experience Impact On Various Salon Business Key Performance Metrics Strategy SS V. Our researchers have carefully researched and created these slides with all aspects taken into consideration. This is a completely customizable Customizing The Salon Experience Impact On Various Salon Business Key Performance Metrics Strategy SS V that is available for immediate downloading. Download now and make an impact on your audience. Highlight the attractive features available with our PPTs. This slide presents the impact on key issues faced by a salon business. It includes information about metrics such as average ticket value, sales velocity, net promoter score, occupancy rate and total revenue.
PowerPoint Backgrounds Education Measuring Growth Ppt Slide
PowerPoint Backgrounds Education Measuring Growth PPT Slide-These high quality powerpoint pre-designed slides and powerpoint templates have been carefully created by our professional team to help you impress your audience. All slides have been created and are 100% editable in powerpoint. Each and every property of any graphic - color, size, orientation, shading, outline etc. can be modified to help you build an effective powerpoint presentation. Any text can be entered at any point in the powerpoint template or slide. Simply DOWNLOAD, TYPE and PRESENT! Label your success story with our PowerPoint Backgrounds Education Measuring Growth Ppt Slide. Make sure your presentation gets the attention it deserves.
PowerPoint Slides Company Measuring Growth Ppt Design
PowerPoint Slides Company Measuring Growth PPT Design-These high quality powerpoint pre-designed slides and powerpoint templates have been carefully created by our professional team to help you impress your audience. All slides have been created and are 100% editable in powerpoint. Each and every property of any graphic - color, size, orientation, shading, outline etc. can be modified to help you build an effective powerpoint presentation. Any text can be entered at any point in the powerpoint template or slide. Simply DOWNLOAD, TYPE and PRESENT! Give them more than they expect of you. Add to the bounty with our PowerPoint Slides Company Measuring Growth Ppt Design.
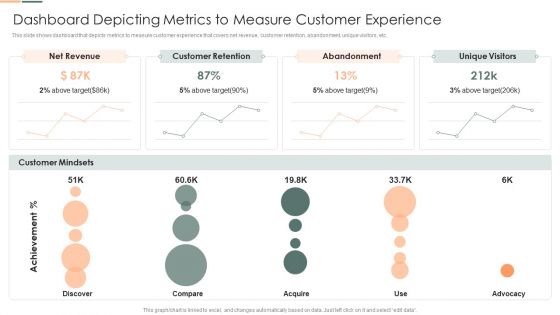
Developing Client Engagement Techniques Dashboard Depicting Metrics To Measure Customer Experience Summary PDF
This slide shows dashboard that depicts metrics to measure customer experience that covers net revenue, customer retention, abandonment, unique visitors, etc. Deliver and pitch your topic in the best possible manner with this Developing Client Engagement Techniques Dashboard Depicting Metrics To Measure Customer Experience Summary PDF. Use them to share invaluable insights on Customer Mindsets, Net Revenue, Customer Retention and impress your audience. This template can be altered and modified as per your expectations. So, grab it now.
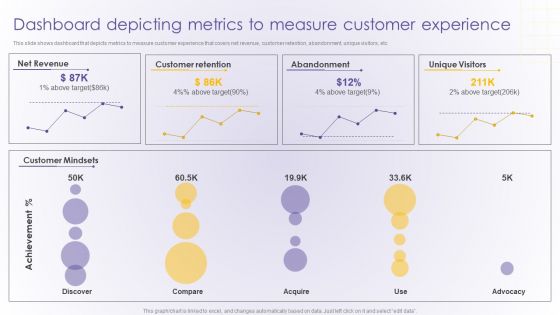
Dashboard Depicting Metrics To Measure Customer Experience Developing Online Summary PDF
This slide shows dashboard that depicts metrics to measure customer experience that covers net revenue, customer retention, abandonment, unique visitors, etc.Deliver an awe inspiring pitch with this creative Dashboard Depicting Metrics To Measure Customer Experience Developing Online Summary PDF bundle. Topics like Net Revenue, Customer Retention, Abandonment can be discussed with this completely editable template. It is available for immediate download depending on the needs and requirements of the user.
AI And ML Driving Monetary Value For Organization Customer Engagement Tracking Kpi Dashboard Pictures PDF
This slide displays customer engagement dashboard. It include key performance indicators namely median lifetime spend. Average churn risk, brand affinities and highly engaged customers. Deliver an awe inspiring pitch with this creative ai and ml driving monetary value for organization customer engagement tracking kpi dashboard pictures pdf bundle. Topics like high earners, high engaged customers, return customers, brand affinities, interests can be discussed with this completely editable template. It is available for immediate download depending on the needs and requirements of the user.
Project Metrics Dashboard With Revenues And Expenses Icons PDF
This slide shows the project management dashboard which covers the name, priorities, indicators and status which includes strategic priorities, research and development, administration, performance management, etc. With purchases in last 30 days and tasks. Showcasing this set of slides titled Project Metrics Dashboard With Revenues And Expenses Icons PDF. The topics addressed in these templates are Performance Management, Research And Development, Strategic Priorities. All the content presented in this PPT design is completely editable. Download it and make adjustments in color, background, font etc. as per your unique business setting.
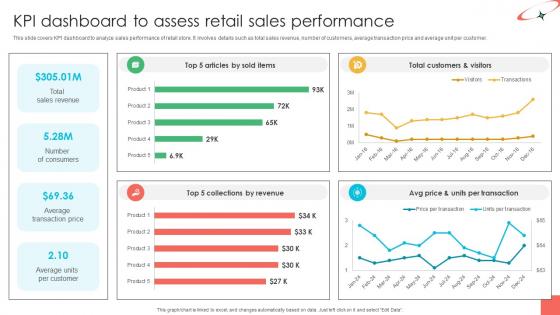
Marketing Strategies For Effective KPI Dashboard To Assess Retail Sales Performance
This slide covers KPI dashboard to analyze sales performance of retail store. It involves details such as total sales revenue, number of customers, average transaction price and average unit per customer. This Marketing Strategies For Effective KPI Dashboard To Assess Retail Sales Performance is perfect for any presentation, be it in front of clients or colleagues. It is a versatile and stylish solution for organizing your meetings. The Marketing Strategies For Effective KPI Dashboard To Assess Retail Sales Performance features a modern design for your presentation meetings. The adjustable and customizable slides provide unlimited possibilities for acing up your presentation. Slidegeeks has done all the homework before launching the product for you. So, do not wait, grab the presentation templates today This slide covers KPI dashboard to analyze sales performance of retail store. It involves details such as total sales revenue, number of customers, average transaction price and average unit per customer.
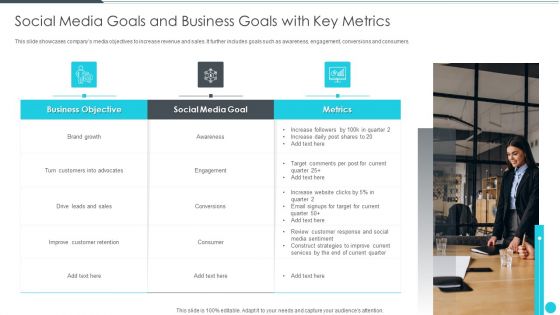
Social Media Goals And Business Goals With Key Metrics Structure PDF
This slide showcases companys media objectives to increase revenue and sales. It further includes goals such as awareness, engagement, conversions and consumers. Persuade your audience using this social media goals and business goals with key metrics structure pdf. This PPT design covers three stages, thus making it a great tool to use. It also caters to a variety of topics including brand growth, customers, sales. Download this PPT design now to present a convincing pitch that not only emphasizes the topic but also showcases your presentation skills.
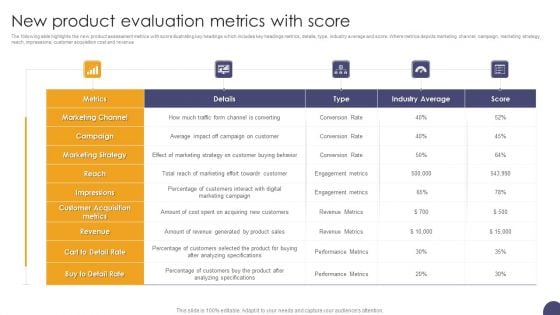
New Product Evaluation Metrics With Score Ppt Inspiration Outline PDF
The following slide highlights the new product assessment metrics with score illustrating key headings which includes key headings metrics, details, type, industry average and score. Where metrics depicts marketing channel, campaign, marketing strategy, reach, impressions, customer acquisition cost and revenue Showcasing this set of slides titled New Product Evaluation Metrics With Score Ppt Inspiration Outline PDF. The topics addressed in these templates are Marketing Channel, Campaign, Marketing Strategy. All the content presented in this PPT design is completely editable. Download it and make adjustments in color, background, font etc. as per your unique business setting.
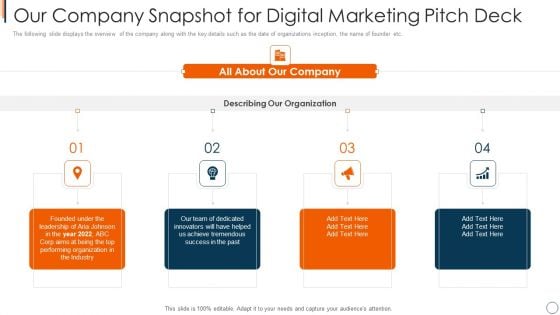
Online Advertising Service Investor Capital Raising Our Company Snapshot For Digital Marketing Pitch Deck Guidelines PDF
The following slide displays the overview of the company along with the key details such as the date of organizations inception, the name of founder etc. This is a online advertising service investor capital raising our company snapshot for digital marketing pitch deck guidelines pdf template with various stages. Focus and dispense information on four stages using this creative set, that comes with editable features. It contains large content boxes to add your information on topics like organization, industry, innovators. You can also showcase facts, figures, and other relevant content using this PPT layout. Grab it now.
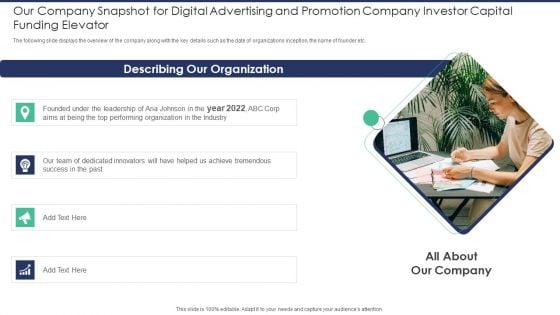
Our Company Snapshot For Digital Advertising And Promotion Company Investor Capital Portrait PDF
The following slide displays the overview of the company along with the key details such as the date of organizations inception, the name of founder etc. This is a our company snapshot for digital advertising and promotion company investor capital portrait pdf template with various stages. Focus and dispense information on four stages using this creative set, that comes with editable features. It contains large content boxes to add your information on topics like our team, dedicated innovators, performing organization, leadership. You can also showcase facts, figures, and other relevant content using this PPT layout. Grab it now.
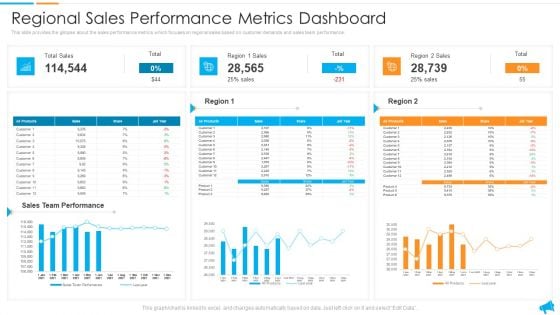
Strategy For Regional Economic Progress Outlining Regional Sales Performance Metrics Dashboard Designs PDF
This slide provides the glimpse about the sales performance metrics which focuses on regional sales based on customer demands and sales team performance. Deliver and pitch your topic in the best possible manner with this strategy for regional economic progress outlining regional sales performance metrics dashboard designs pdf. Use them to share invaluable insights on sales team performance, regional sales performance metrics dashboard and impress your audience. This template can be altered and modified as per your expectations. So, grab it now.
Executive Dashboards For Tracking Key Performance Icons PDF
This slide represents the dashboard for the CEO to track the companys performance. It includes key performance indicators such as no. of deals, open deals, revenue, expected revenue and win percentage. Showcasing this set of slides titled Executive Dashboards For Tracking Key Performance Icons PDF. The topics addressed in these templates are Pen Deals, Revenue, Expected Revenue. All the content presented in this PPT design is completely editable. Download it and make adjustments in color, background, font etc. as per your unique business setting.

Evaluating New Commodity Impact On Market Key Metrics For Understanding Product Guidelines PDF
The following slide displays key metrics that can be used to understand the product, these metrics can be Revenues Generated by the product, the total units sold of the product and the total purchase value of the product This is a Evaluating New Commodity Impact On Market Key Metrics For Understanding Product Guidelines PDF template with various stages. Focus and dispense information on three stages using this creative set, that comes with editable features. It contains large content boxes to add your information on topics like Revenues Generated, Purchase Value, Revenues Generated You can also showcase facts, figures, and other relevant content using this PPT layout. Grab it now.
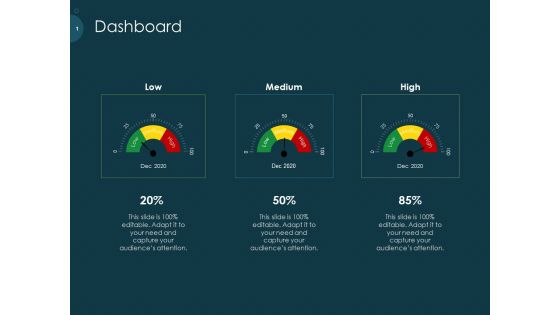
Raise Funding From Pre Seed Capital Dashboard Professional PDF
Showcasing this set of slides titled raise funding from pre seed capital dashboard professional pdf. The topics addressed in these templates is dashboard. All the content presented in this PPT design is completely editable. Download it and make adjustments in color, background, font etc. as per your unique business setting.
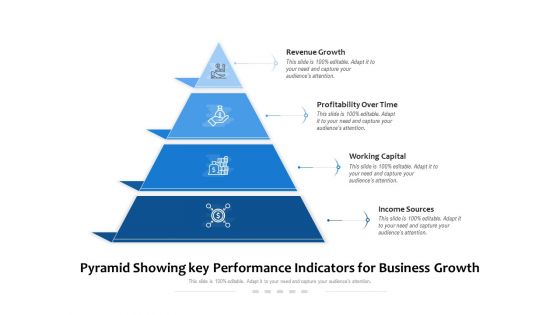
Pyramid Showing Key Performance Indicators For Business Growth Ppt PowerPoint Presentation Layouts Introduction PDF
Persuade your audience using this pyramid showing key performance indicators for business growth ppt powerpoint presentation layouts introduction pdf. This PPT design covers four stages, thus making it a great tool to use. It also caters to a variety of topics including revenue growth, profitability over time, working capital, income sources. Download this PPT design now to present a convincing pitch that not only emphasizes the topic but also showcases your presentation skills.
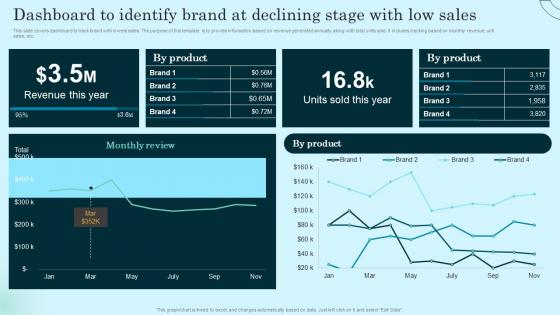
Dashboard To Identify Brand At Declining Stage Comprehensive Guide To Product Lifecycle Template Pdf
This slide covers dashboard to track brand with lowest sales. The purpose of this template is to provide information based on revenue generated annually along with total units sold. It includes tracking based on monthly revenue, unit sales, etc. From laying roadmaps to briefing everything in detail, our templates are perfect for you. You can set the stage with your presentation slides. All you have to do is download these easy to edit and customizable templates. Dashboard To Identify Brand At Declining Stage Comprehensive Guide To Product Lifecycle Template Pdf will help you deliver an outstanding performance that everyone would remember and praise you for. Do download this presentation today. This slide covers dashboard to track brand with lowest sales. The purpose of this template is to provide information based on revenue generated annually along with total units sold. It includes tracking based on monthly revenue, unit sales, etc.
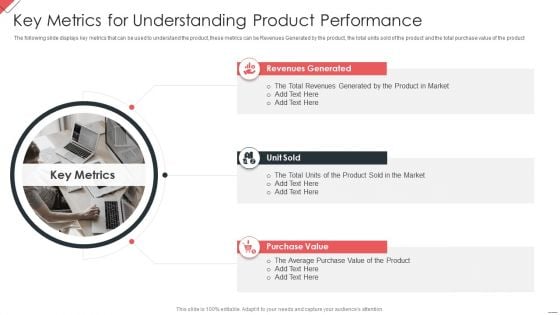
New Commodity Market Viability Review Key Metrics For Understanding Product Inspiration PDF
The following slide displays key metrics that can be used to understand the product, these metrics can be Revenues Generated by the product, the total units sold of the product and the total purchase value of the product This is a New Commodity Market Viability Review Key Metrics For Understanding Product Inspiration PDF template with various stages. Focus and dispense information on three stages using this creative set, that comes with editable features. It contains large content boxes to add your information on topics like Revenues Generated, Purchase Value, Revenues Generated You can also showcase facts, figures, and other relevant content using this PPT layout. Grab it now.
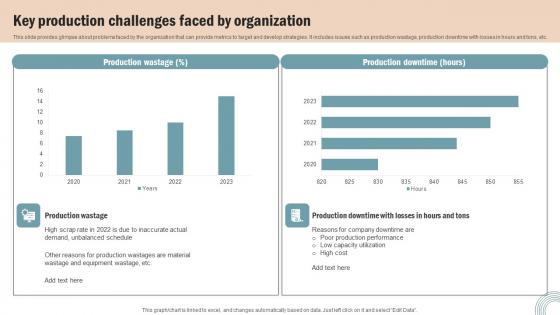
Key Production Challenges Faced Operations Strategy Improve Business Productivity Information Pdf
This slide provides glimpse about problems faced by the organization that can provide metrics to target and develop strategies. It includes issues such as production wastage, production downtime with losses in hours and tons, etc. Make sure to capture your audiences attention in your business displays with our gratis customizable Key Production Challenges Faced Operations Strategy Improve Business Productivity Information Pdf. These are great for business strategies, office conferences, capital raising or task suggestions. If you desire to acquire more customers for your tech business and ensure they stay satisfied, create your own sales presentation with these plain slides. This slide provides glimpse about problems faced by the organization that can provide metrics to target and develop strategies. It includes issues such as production wastage, production downtime with losses in hours and tons, etc.
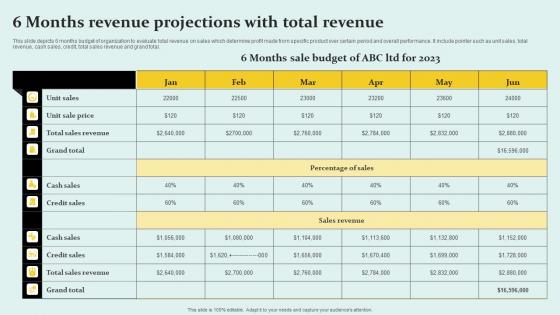
6 Months Revenue Projections With Total Revenue Sample Pdf
This slide depicts 6 months budget of organization to evaluate total revenue on sales which determine profit made from specific product over certain period and overall performance. It include pointer such as unit sales, total revenue, cash sales, credit, total sales revenue and grand total. Showcasing this set of slides titled 6 Months Revenue Projections With Total Revenue Sample Pdf The topics addressed in these templates are Sales Revenue, Percentage Of Sales, Cash Sales All the content presented in this PPT design is completely editable. Download it and make adjustments in color, background, font etc. as per your unique business setting. This slide depicts 6 months budget of organization to evaluate total revenue on sales which determine profit made from specific product over certain period and overall performance. It include pointer such as unit sales, total revenue, cash sales, credit, total sales revenue and grand total.
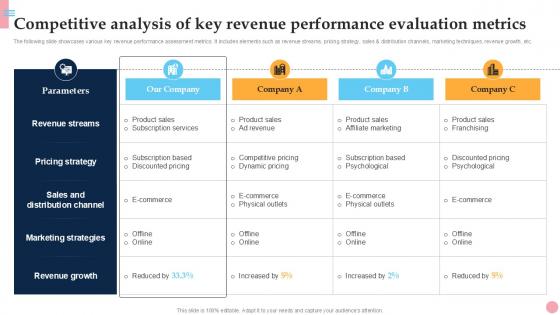
Competitive Analysis Of Key Revenue How To Improve Company PPT Example Strategy SS V
The following slide showcases various key revenue performance assessment metrics. It includes elements such as revenue streams, pricing strategy, sales and distribution channels, marketing techniques, revenue growth, etc. Get a simple yet stunning designed Competitive Analysis Of Key Revenue How To Improve Company PPT Example Strategy SS V. It is the best one to establish the tone in your meetings. It is an excellent way to make your presentations highly effective. So, download this PPT today from Slidegeeks and see the positive impacts. Our easy-to-edit Competitive Analysis Of Key Revenue How To Improve Company PPT Example Strategy SS V can be your go-to option for all upcoming conferences and meetings. So, what are you waiting for Grab this template today. The following slide showcases various key revenue performance assessment metrics. It includes elements such as revenue streams, pricing strategy, sales and distribution channels, marketing techniques, revenue growth, etc.
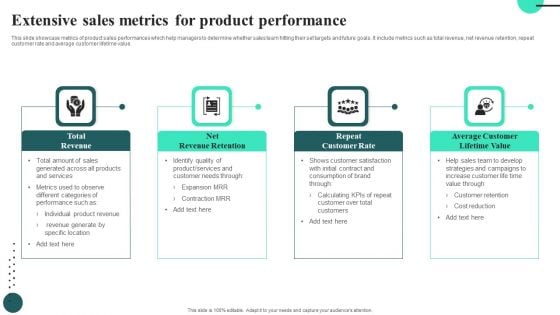
Extensive Sales Metrics For Product Performance Summary PDF
This slide showcase metrics of product sales performances which help managers to determine whether sales team hitting their set targets and future goals. It include metrics such as total revenue, net revenue retention, repeat customer rate and average customer lifetime value.Persuade your audience using this Extensive Sales Metrics For Product Performance Summary PDF. This PPT design covers four stages, thus making it a great tool to use. It also caters to a variety of topics including Total Revenue, Net Revenue Retention. Download this PPT design now to present a convincing pitch that not only emphasizes the topic but also showcases your presentation skills.
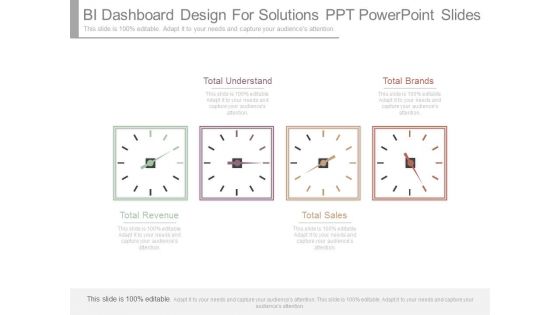
Bi Dashboard Design For Solutions Ppt Powerpoint Slides
This is a bi dashboard design for solutions ppt powerpoint slides. This is a four stage process. The stages in this process are total understand, total brands, total revenue, total sales.
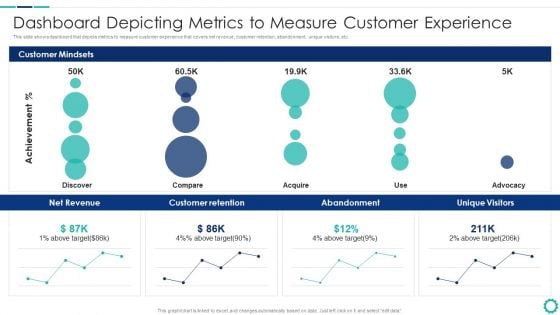
Creating Successful Strategies To Enhance Customer Experience Dashboard Depicting Metrics To Measure Slides PDF
This slide shows dashboard that depicts metrics to measure customer experience that covers net revenue, customer retention, abandonment, unique visitors, etc.Deliver an awe inspiring pitch with this creative Creating Successful Strategies To Enhance Customer Experience Dashboard Depicting Metrics To Measure Slides PDF bundle. Topics like Customer Retention, Abandonment, Unique Visitors can be discussed with this completely editable template. It is available for immediate download depending on the needs and requirements of the user.
Dashboard Depicting Metrics To Measure Customer Experience Icons PDF Elements PDF
This slide shows dashboard that depicts metrics to measure customer experience that covers net revenue, customer retention, abandonment, unique visitors, etc.Deliver and pitch your topic in the best possible manner with this Dashboard Depicting Metrics To Measure Customer Experience Icons PDF Elements PDF. Use them to share invaluable insights on Customer Retention, Abandonment, Customer Mindsets and impress your audience. This template can be altered and modified as per your expectations. So, grab it now.
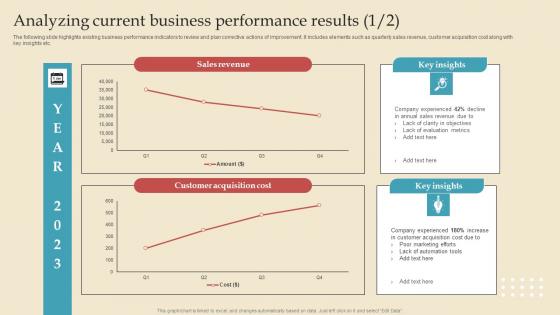
Analyzing Current Describing Business Performance Administration Goals Microsoft Pdf
The following slide highlights existing business performance indicators to review and plan corrective actions of improvement. It includes elements such as quarterly sales revenue, customer acquisition cost along with key insights etc. This modern and well arranged Analyzing Current Describing Business Performance Administration Goals Microsoft Pdf provides lots of creative possibilities. It is very simple to customize and edit with the Powerpoint Software. Just drag and drop your pictures into the shapes. All facets of this template can be edited with Powerpoint, no extra software is necessary. Add your own material, put your images in the places assigned for them, adjust the colors, and then you can show your slides to the world, with an animated slide included. The following slide highlights existing business performance indicators to review and plan corrective actions of improvement. It includes elements such as quarterly sales revenue, customer acquisition cost along with key insights etc.
Umbrella Branding Measures To Boost Brand Awareness Product Branding Performance Tracking Dashboard Information PDF
This slide provides information regarding product branding performance tracking dashboard in terms of revenues, new customers, customer satisfaction rate. This Umbrella Branding Measures To Boost Brand Awareness Product Branding Performance Tracking Dashboard Information PDF from Slidegeeks makes it easy to present information on your topic with precision. It provides customization options, so you can make changes to the colors, design, graphics, or any other component to create a unique layout. It is also available for immediate download, so you can begin using it right away. Slidegeeks has done good research to ensure that you have everything you need to make your presentation stand out. Make a name out there for a brilliant performance.
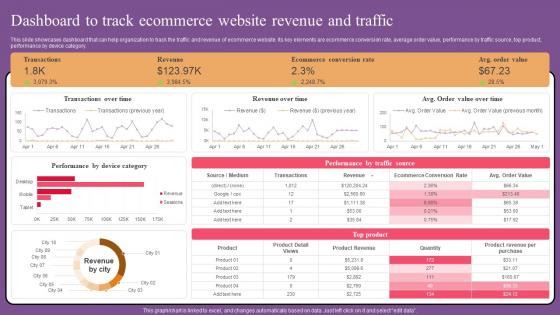
Dashboard Track Ecommerce Website Optimization To Improve Product Sale Professional Pdf
This slide showcases dashboard that can help organization to track the traffic and revenue of ecommerce website. Its key elements are ecommerce conversion rate, average order value, performance by traffic source, top product, performance by device category. Find highly impressive Dashboard Track Ecommerce Website Optimization To Improve Product Sale Professional Pdf on Slidegeeks to deliver a meaningful presentation. You can save an ample amount of time using these presentation templates. No need to worry to prepare everything from scratch because Slidegeeks experts have already done a huge research and work for you. You need to download Dashboard Track Ecommerce Website Optimization To Improve Product Sale Professional Pdf for your upcoming presentation. All the presentation templates are 100 percent editable and you can change the color and personalize the content accordingly. Download now This slide showcases dashboard that can help organization to track the traffic and revenue of ecommerce website. Its key elements are ecommerce conversion rate, average order value, performance by traffic source, top product, performance by device category.

Continuously Monitor Digital Content Performance Top Of The Funnel Digital Content Strategy SS V
The following slide highlights key performance indicators to be tracked to ensure continuous content performance review. It includes elements such as user behavior, engagement, SEO outcomes, company revenue, comments, mention, keyword ranking etc. Slidegeeks is here to make your presentations a breeze with Continuously Monitor Digital Content Performance Top Of The Funnel Digital Content Strategy SS V With our easy-to-use and customizable templates, you can focus on delivering your ideas rather than worrying about formatting. With a variety of designs to choose from, you are sure to find one that suits your needs. And with animations and unique photos, illustrations, and fonts, you can make your presentation pop. So whether you are giving a sales pitch or presenting to the board, make sure to check out Slidegeeks first The following slide highlights key performance indicators to be tracked to ensure continuous content performance review. It includes elements such as user behavior, engagement, SEO outcomes, company revenue, comments, mention, keyword ranking etc.
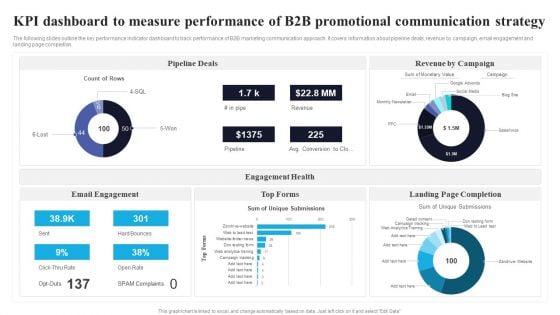
KPI Dashboard To Measure Performance Of B2B Promotional Communication Strategy Mockup PDF
The following slides outline the key performance indicator dashboard to track performance of B2B marketing communication approach. It covers information about pipeline deals, revenue by campaign, email engagement and landing page completion. Pitch your topic with ease and precision using this KPI Dashboard To Measure Performance Of B2B Promotional Communication Strategy Mockup PDF. This layout presents information on Pipeline Deals, Engagement Health, Email Engagement. It is also available for immediate download and adjustment. So, changes can be made in the color, design, graphics or any other component to create a unique layout.
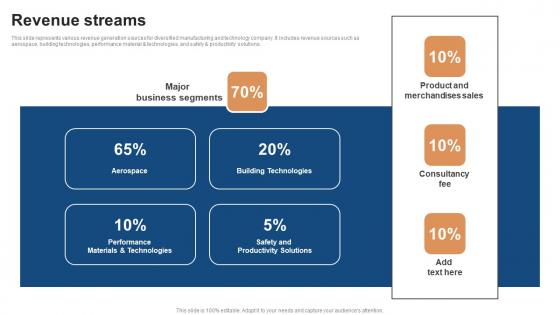
Revenue Streams Conglomerate Company Fund Raising Pitch Deck Guidelines Pdf
This slide represents various revenue generation sources for diversified manufacturing and technology company. It includes revenue sources such as aerospace, building technologies, performance material and technologies, and safety and productivity solutions. Coming up with a presentation necessitates that the majority of the effort goes into the content and the message you intend to convey. The visuals of a PowerPoint presentation can only be effective if it supplements and supports the story that is being told. Keeping this in mind our experts created Revenue Streams Conglomerate Company Fund Raising Pitch Deck Guidelines Pdf to reduce the time that goes into designing the presentation. This way, you can concentrate on the message while our designers take care of providing you with the right template for the situation. This slide represents various revenue generation sources for diversified manufacturing and technology company. It includes revenue sources such as aerospace, building technologies, performance material and technologies, and safety and productivity solutions.
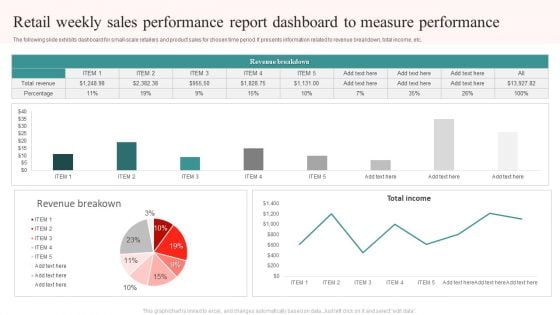
Retail Weekly Sales Performance Report Dashboard To Measure Performance Ppt Gallery File Formats PDF
The following slide exhibits dashboard for small-scale retailers and product sales for chosen time period. It presents information related to revenue breakdown, total income, etc. Showcasing this set of slides titled Retail Weekly Sales Performance Report Dashboard To Measure Performance Ppt Gallery File Formats PDF. The topics addressed in these templates are Revenue Breakdown, Total Income, Total Revenue. All the content presented in this PPT design is completely editable. Download it and make adjustments in color, background, font etc. as per your unique business setting.
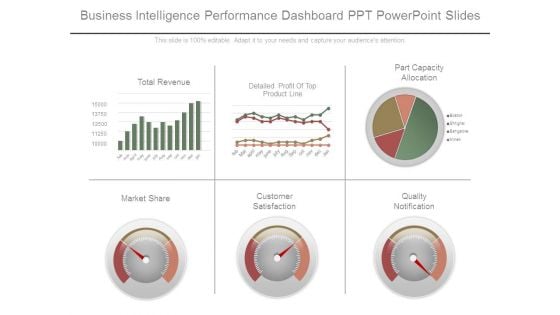
Business Intelligence Performance Dashboard Ppt Powerpoint Slides
This is a business intelligence performance dashboard ppt powerpoint slides. This is a six stage process. The stages in this process are total revenue, detailed profit of top product line, part capacity allocation, market share, customer satisfaction, quality notification.
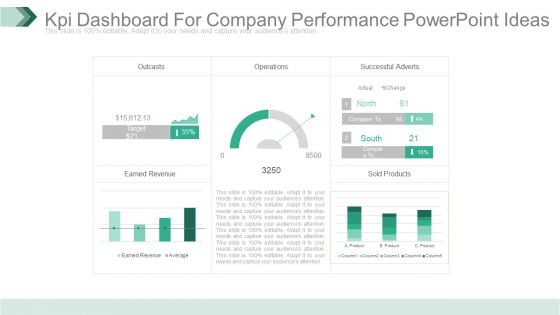
Kpi Dashboard For Company Performance Powerpoint Ideas
This is a kpi dashboard for company performance powerpoint ideas. This is a five stage process. The stages in this process are outcasts, operations, successful adverts, earned revenue, sold products.
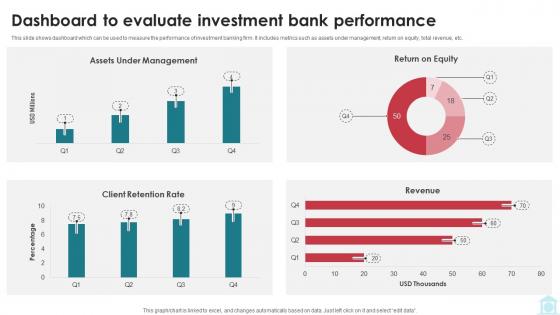
Dashboard To Evaluate Investment Bank Performance Mastering Investment Banking Fin SS V
This slide shows dashboard which can be used to measure the performance of investment banking firm. It includes metrics such as assets under management, return on equity, total revenue, etc. Find highly impressive Dashboard To Evaluate Investment Bank Performance Mastering Investment Banking Fin SS V on Slidegeeks to deliver a meaningful presentation. You can save an ample amount of time using these presentation templates. No need to worry to prepare everything from scratch because Slidegeeks experts have already done a huge research and work for you. You need to download Dashboard To Evaluate Investment Bank Performance Mastering Investment Banking Fin SS V for your upcoming presentation. All the presentation templates are 100 percent editable and you can change the color and personalize the content accordingly. Download now This slide shows dashboard which can be used to measure the performance of investment banking firm. It includes metrics such as assets under management, return on equity, total revenue, etc.
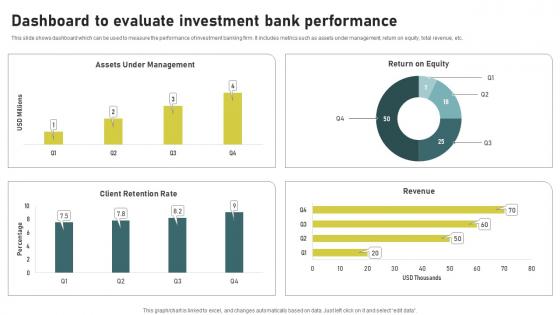
Dashboard To Evaluate Investment Bank Investment Banking Simplified Functions Fin SS V
This slide shows dashboard which can be used to measure the performance of investment banking firm. It includes metrics such as assets under management, return on equity, total revenue, etc. Find highly impressive Dashboard To Evaluate Investment Bank Investment Banking Simplified Functions Fin SS V on Slidegeeks to deliver a meaningful presentation. You can save an ample amount of time using these presentation templates. No need to worry to prepare everything from scratch because Slidegeeks experts have already done a huge research and work for you. You need to download Dashboard To Evaluate Investment Bank Investment Banking Simplified Functions Fin SS V for your upcoming presentation. All the presentation templates are 100 percent editable and you can change the color and personalize the content accordingly. Download now This slide shows dashboard which can be used to measure the performance of investment banking firm. It includes metrics such as assets under management, return on equity, total revenue, etc.
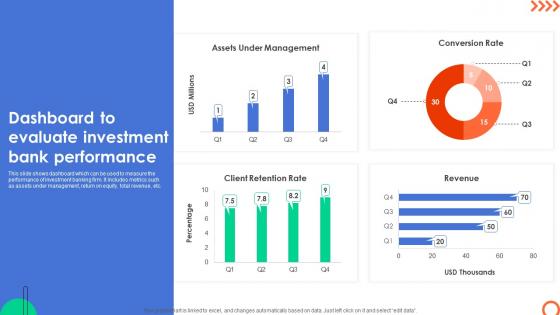
Dashboard To Evaluate Investment Bank Understanding Investment Banking Framework Fin SS V
This slide shows dashboard which can be used to measure the performance of investment banking firm. It includes metrics such as assets under management, return on equity, total revenue, etc. Find highly impressive Dashboard To Evaluate Investment Bank Understanding Investment Banking Framework Fin SS V on Slidegeeks to deliver a meaningful presentation. You can save an ample amount of time using these presentation templates. No need to worry to prepare everything from scratch because Slidegeeks experts have already done a huge research and work for you. You need to download Dashboard To Evaluate Investment Bank Understanding Investment Banking Framework Fin SS V for your upcoming presentation. All the presentation templates are 100 percent editable and you can change the color and personalize the content accordingly. Download now This slide shows dashboard which can be used to measure the performance of investment banking firm. It includes metrics such as assets under management, return on equity, total revenue, etc.
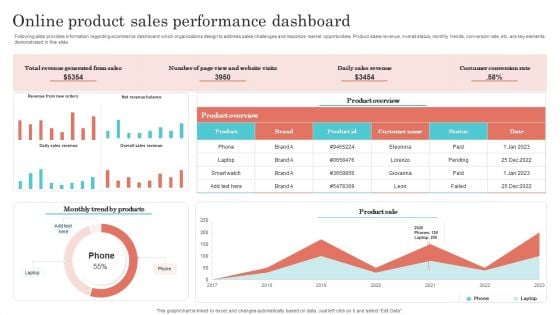
Online Product Sales Performance Dashboard Designs PDF
Following slide provides information regarding ecommerce dashboard which organizations design to address sales challenges and maximize market opportunities. Product sales revenue, overall status, monthly trends, conversion rate, etc. are key elements demonstrated in this slide. Showcasing this set of slides titled Online Product Sales Performance Dashboard Designs PDF. The topics addressed in these templates are Revenue Generated From Sales, Daily Sales Revenue, Costumer Conversion Rate. All the content presented in this PPT design is completely editable. Download it and make adjustments in color, background, font etc. as per your unique business setting.

Money And Time Saving Vector Illustration Ppt PowerPoint Presentation Model Format Ideas PDF
Persuade your audience using this money and time saving vector illustration ppt powerpoint presentation model format ideas pdf. This PPT design covers three stages, thus making it a great tool to use. It also caters to a variety of topics including money and time saving vector illustration. Download this PPT design now to present a convincing pitch that not only emphasizes the topic but also showcases your presentation skills.
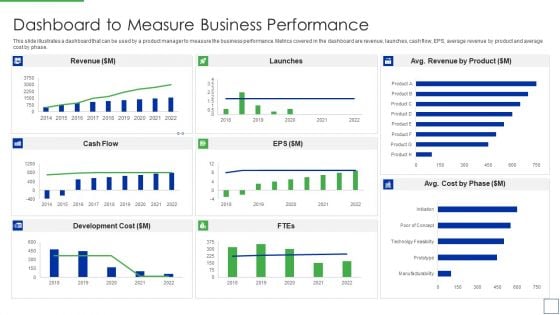
Product Portfolio Management For New Target Region Dashboard To Measure Business Rules PDF
This slide illustrates a dashboard that can be used by a product manager to measure the business performance. Metrics covered in the dashboard are revenue, launches, cash flow, EPS, average revenue by product and average cost by phase.Deliver and pitch your topic in the best possible manner with this Product Portfolio Management For New Target Region Dashboard To Measure Business Rules PDF Use them to share invaluable insights on Dashboard to Measure Business Performance and impress your audience. This template can be altered and modified as per your expectations. So, grab it now.
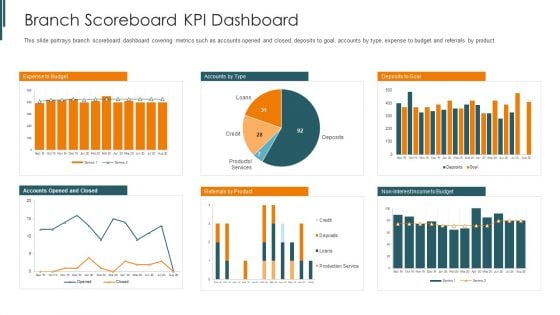
Introduction To Mobile Money In Developing Countries Branch Scoreboard KPI Dashboard Diagrams PDF
This slide portrays branch scoreboard dashboard covering metrics such as accounts opened and closed, deposits to goal, accounts by type, expense to budget and referrals by product. Deliver an awe inspiring pitch with this creative introduction to mobile money in developing countries branch scoreboard kpi dashboard diagrams pdf bundle. Topics like expense to budget, deposits to goal, referrals by product can be discussed with this completely editable template. It is available for immediate download depending on the needs and requirements of the user.
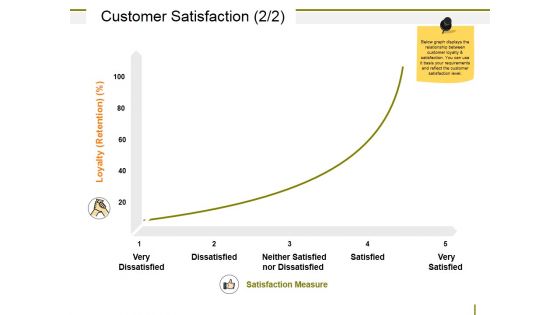
Customer Satisfaction Template Ppt PowerPoint Presentation Picture
This is a customer satisfaction template ppt powerpoint presentation picture. This is a three stage process. The stages in this process are overall satisfaction with service, satisfaction with value for money, overall satisfaction with relationship.


 Continue with Email

 Home
Home


