Financial Kpis
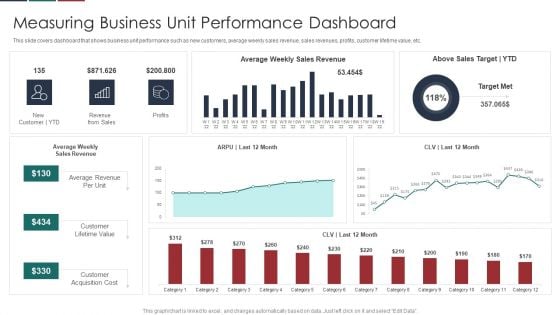
Deliver Efficiency Innovation Measuring Business Unit Performance Dashboard Background PDF
This slide covers dashboard that shows business unit performance such as new customers, average weekly sales revenue, sales revenues, profits, customer lifetime value, etc. Deliver an awe inspiring pitch with this creative Deliver Efficiency Innovation Measuring Business Unit Performance Dashboard Background PDF bundle. Topics like Customer Lifetime Value, Customer Acquisition Cost, Average Revenue Per Unit, Above Sales Target YTD can be discussed with this completely editable template. It is available for immediate download depending on the needs and requirements of the user.
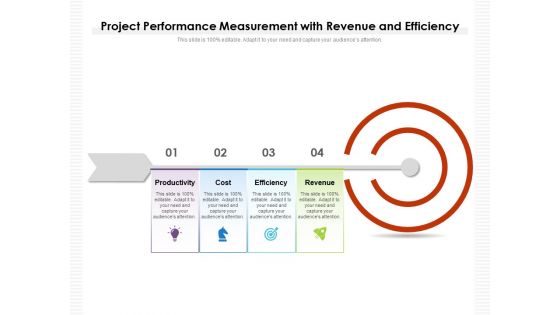
Project Performance Measurement With Revenue And Efficiency Ppt PowerPoint Presentation Infographics Elements PDF
Presenting this set of slides with name project performance measurement with revenue and efficiency ppt powerpoint presentation infographics elements pdf. This is a four stage process. The stages in this process are productivity, cost, efficiency, revenue. This is a completely editable PowerPoint presentation and is available for immediate download. Download now and impress your audience.
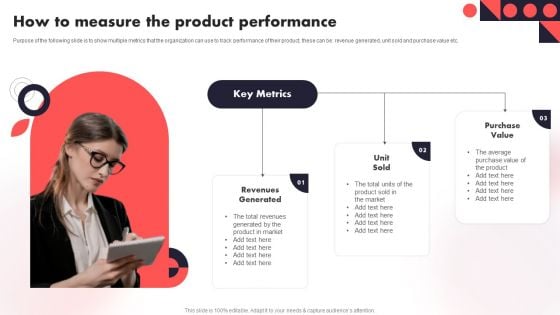
How To Measure The Product Performance Year Over Year Business Success Playbook Demonstration PDF
Purpose of the following slide is to show multiple metrics that the organization can use to track performance of their product, these can be revenue generated, unit sold and purchase value etc.Create an editable How To Measure The Product Performance Year Over Year Business Success Playbook Demonstration PDF that communicates your idea and engages your audience. Whether you are presenting a business or an educational presentation, pre-designed presentation templates help save time. How To Measure The Product Performance Year Over Year Business Success Playbook Demonstration PDF is highly customizable and very easy to edit, covering many different styles from creative to business presentations. Slidegeeks has creative team members who have crafted amazing templates. So, go and get them without any delay.
Market Evaluation Of IT Industry Marketing Campaign Dashboard For B2b Marketers Icons PDF
The following slide showcases key performance indicator KPI dashboard that can assist managers to evaluate digital marketing campaign performance. The key metrics mentioned in the slide are click through rate CTR, conversion rate, cost per click CPC, etc. Make sure to capture your audiences attention in your business displays with our gratis customizable Market Evaluation Of IT Industry Marketing Campaign Dashboard For B2b Marketers Icons PDF. These are great for business strategies, office conferences, capital raising or task suggestions. If you desire to acquire more customers for your tech business and ensure they stay satisfied, create your own sales presentation with these plain slides.
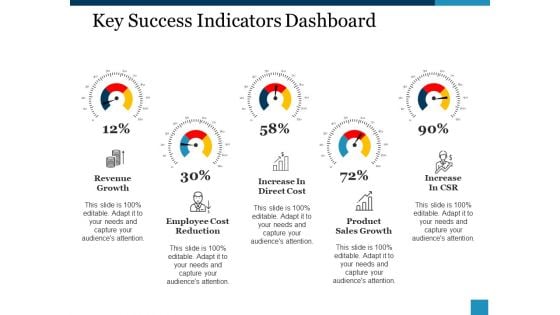
Key Success Indicators Dashboard Ppt PowerPoint Presentation Inspiration Guide
This is a key success indicators dashboard ppt powerpoint presentation inspiration guide. This is a five stage process. The stages in this process are revenue growth, increase in direct cost, increase in csr, employee cost reduction, product, sales growth.
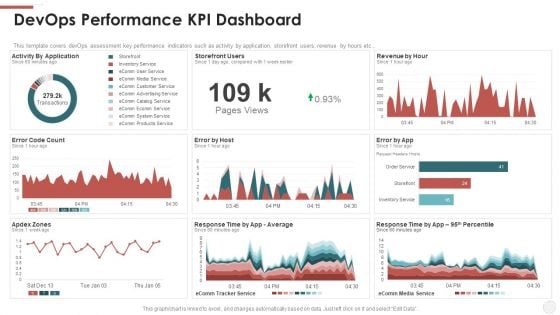
Devops Performance KPI Dashboard Ppt File Example Topics PDF
This template covers devOps assessment key performance indicators such as activity by application, storefront users, revenue by hours etc. Deliver and pitch your topic in the best possible manner with this devops performance kpi dashboard ppt file example topics pdf. Use them to share invaluable insights on revenue, application and impress your audience. This template can be altered and modified as per your expectations. So, grab it now.
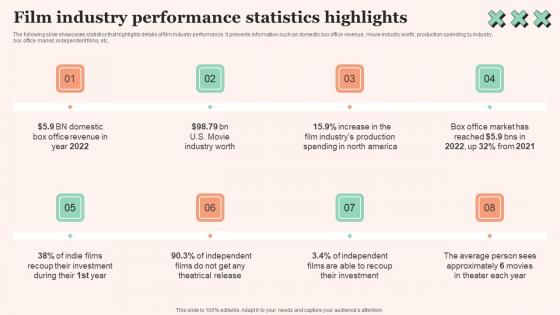
Film Industry Performance Film Promotional Techniques To Increase Box Office Collection Template Pdf
The following slide showcases statistics that highlights details of film industry performance. It presents information such as domestic box office revenue, movie industry worth, production spending by industry, box office market, independent films, etc. Here you can discover an assortment of the finest PowerPoint and Google Slides templates. With these templates, you can create presentations for a variety of purposes while simultaneously providing your audience with an eye catching visual experience. Download Film Industry Performance Film Promotional Techniques To Increase Box Office Collection Template Pdf to deliver an impeccable presentation. These templates will make your job of preparing presentations much quicker, yet still, maintain a high level of quality. Slidegeeks has experienced researchers who prepare these templates and write high quality content for you. Later on, you can personalize the content by editing the Film Industry Performance Film Promotional Techniques To Increase Box Office Collection Template Pdf. The following slide showcases statistics that highlights details of film industry performance. It presents information such as domestic box office revenue, movie industry worth, production spending by industry, box office market, independent films, etc.
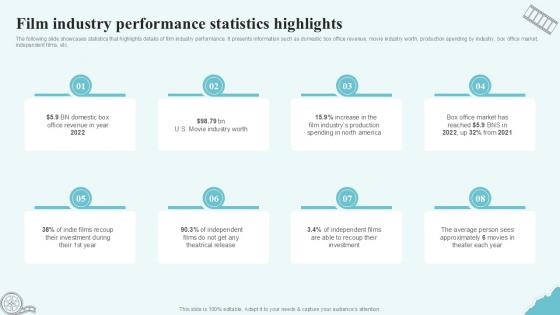
Film Industry Performance Statistics Highlights Strategic Plan To Increase Film Ppt Presentation Strategy SS V
The following slide showcases statistics that highlights details of film industry performance. It presents information such as domestic box office revenue, movie industry worth, production spending by industry, box office market, independent films, etc. Find highly impressive Film Industry Performance Statistics Highlights Strategic Plan To Increase Film Ppt Presentation Strategy SS V on Slidegeeks to deliver a meaningful presentation. You can save an ample amount of time using these presentation templates. No need to worry to prepare everything from scratch because Slidegeeks experts have already done a huge research and work for you. You need to download Film Industry Performance Statistics Highlights Strategic Plan To Increase Film Ppt Presentation Strategy SS V for your upcoming presentation. All the presentation templates are 100 percent editable and you can change the color and personalize the content accordingly. Download now The following slide showcases statistics that highlights details of film industry performance. It presents information such as domestic box office revenue, movie industry worth, production spending by industry, box office market, independent films, etc.
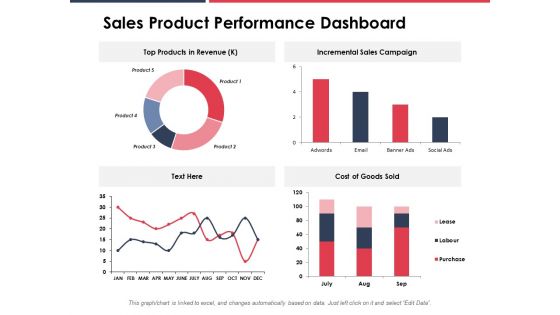
Sales Product Performance Dashboard Ppt PowerPoint Presentation Gallery Background
Presenting this set of slides with name sales product performance dashboard ppt powerpoint presentation gallery background. The topics discussed in these slides are sales, performance, revenue, incremental, social. This is a completely editable PowerPoint presentation and is available for immediate download. Download now and impress your audience.
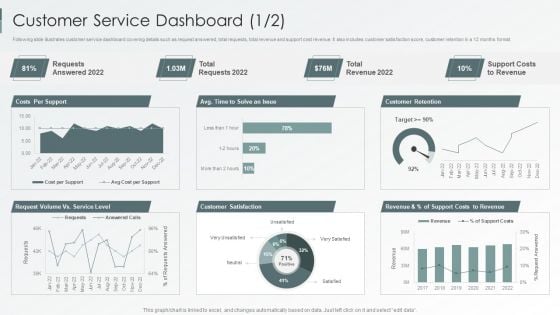
Enterprise Sustainability Performance Metrics Customer Service Dashboard Professional PDF
Following slide illustrates customer service dashboard covering details such as request answered, total requests, total revenue and support cost revenue. It also includes customer satisfaction score, customer retention in a 12 months format.Deliver and pitch your topic in the best possible manner with this Enterprise Sustainability Performance Metrics Customer Service Dashboard Professional PDF. Use them to share invaluable insights on Customer Satisfaction, Customer Retention, Support Revenue and impress your audience. This template can be altered and modified as per your expectations. So, grab it now.
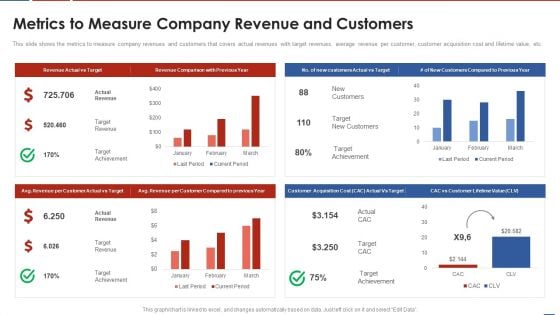
Formulating Product Development Action Plan To Enhance Client Experience Metrics To Measure Company Diagrams PDF
This slide shows the metrics to measure company revenues and customers that covers actual revenues with target revenues, average revenue per customer, customer acquisition cost and lifetime value, etc. Deliver and pitch your topic in the best possible manner with this formulating product development action plan to enhance client experience metrics to measure company diagrams pdf. Use them to share invaluable insights on target revenues, average revenue per customer, customer acquisition cost, lifetime value and impress your audience. This template can be altered and modified as per your expectations. So, grab it now.
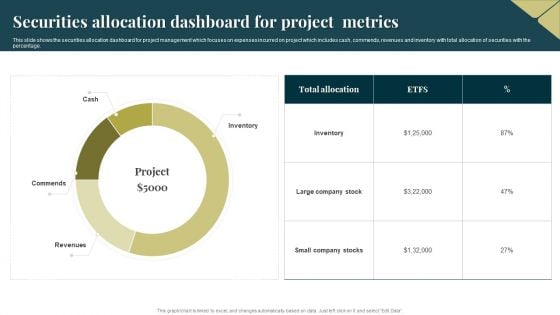
Securities Allocation Dashboard For Project Metrics Information PDF
This slide shows the securities allocation dashboard for project management which focuses on expenses incurred on project which includes cash, commends, revenues and inventory with total allocation of securities with the percentage. Showcasing this set of slides titled Securities Allocation Dashboard For Project Metrics Information PDF. The topics addressed in these templates are Inventory, Project, Revenues. All the content presented in this PPT design is completely editable. Download it and make adjustments in color, background, font etc. as per your unique business setting.
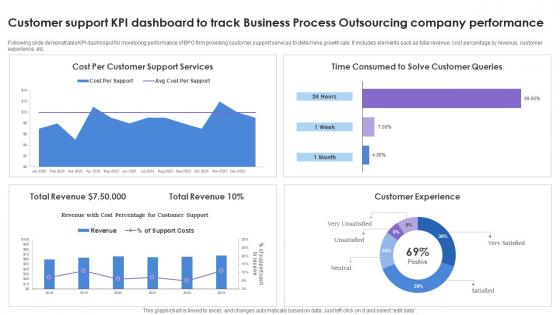
Customer Support KPI Dashboard To Track Business Process Outsourcing Company Performance Rules Pdf Wd
Following slide demonstrates KPI dashboard for monitoring performance of BPO firm providing customer support services to determine growth rate. It includes elements such as total revenue, cost percentage by revenue, customer experience, etc. Showcasing this set of slides titled Customer Support KPI Dashboard To Track Business Process Outsourcing Company Performance Rules Pdf Wd. The topics addressed in these templates are Customer Experience, Total Revenue. All the content presented in this PPT design is completely editable. Download it and make adjustments in color, background, font etc. as per your unique business setting. Following slide demonstrates KPI dashboard for monitoring performance of BPO firm providing customer support services to determine growth rate. It includes elements such as total revenue, cost percentage by revenue, customer experience, etc.
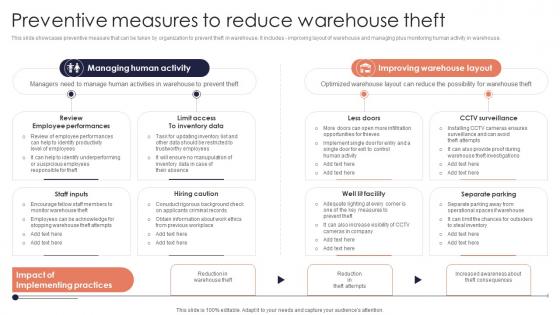
Preventive Measures Reduce Minimizing Inventory Wastage Through Warehouse Guidelines Pdf
This slide showcases preventive measure that can be taken by organization to prevent theft in warehouse. It includes improving layout of warehouse and managing plus monitoring human activity in warehouse. Make sure to capture your audiences attention in your business displays with our gratis customizable Preventive Measures Reduce Minimizing Inventory Wastage Through Warehouse Guidelines Pdf. These are great for business strategies, office conferences, capital raising or task suggestions. If you desire to acquire more customers for your tech business and ensure they stay satisfied, create your own sales presentation with these plain slides. This slide showcases preventive measure that can be taken by organization to prevent theft in warehouse. It includes improving layout of warehouse and managing plus monitoring human activity in warehouse.
Development And Operations KPI Dashboard IT Devops Performance KPI Dashboard Icons PDF
This template covers DevOps assessment key performance indicators such as activity by application, storefront users, revenue by hours etc. Deliver an awe inspiring pitch with this creative development and operations kpi dashboard it devops performance kpi dashboard icons pdf bundle. Topics like revenue, service can be discussed with this completely editable template. It is available for immediate download depending on the needs and requirements of the user.
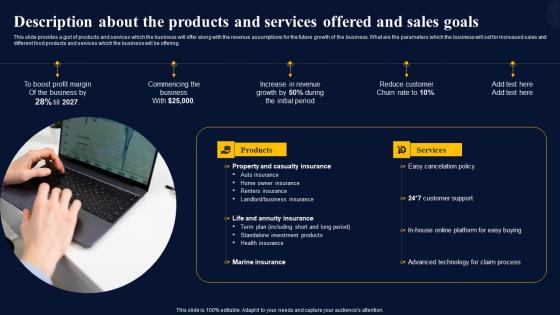
Description About The Products And Services Insurance Broker Business Plan Topics Pdf
This slide provides a gist of products and services which the business will offer along with the revenue assumptions for the future growth of the business. What are the parameters which the business will set for increased sales and different food products and services which the business will be offering.From laying roadmaps to briefing everything in detail, our templates are perfect for you. You can set the stage with your presentation slides. All you have to do is download these easy-to-edit and customizable templates. Description About The Products And Services Insurance Broker Business Plan Topics Pdf will help you deliver an outstanding performance that everyone would remember and praise you for. Do download this presentation today. This slide provides a gist of products and services which the business will offer along with the revenue assumptions for the future growth of the business. What are the parameters which the business will set for increased sales and different food products and services which the business will be offering.
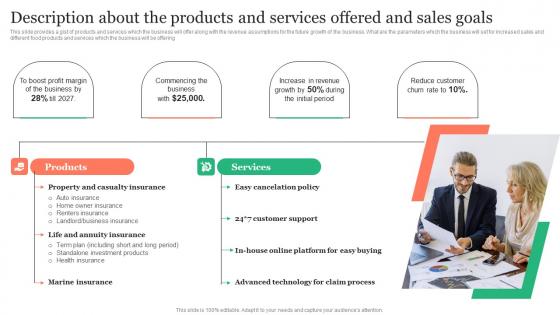
Description About The Products And Services Offered Insurance Business Plan Ideas Pdf
This slide provides a gist of products and services which the business will offer along with the revenue assumptions for the future growth of the business. What are the parameters which the business will set for increased sales and different food products and services which the business will be offering. From laying roadmaps to briefing everything in detail, our templates are perfect for you. You can set the stage with your presentation slides. All you have to do is download these easy-to-edit and customizable templates. Description About The Products And Services Offered Insurance Business Plan Ideas Pdf will help you deliver an outstanding performance that everyone would remember and praise you for. Do download this presentation today. This slide provides a gist of products and services which the business will offer along with the revenue assumptions for the future growth of the business. What are the parameters which the business will set for increased sales and different food products and services which the business will be offering.

Balance Scale With Money Bags And Gold Coins Ppt Powerpoint Presentation Infographics Templates
This is a balance scale with money bags and gold coins ppt powerpoint presentation infographics templates. This is a two stage process. The stages in this process are balance scale, weighing scale, measuring scale.
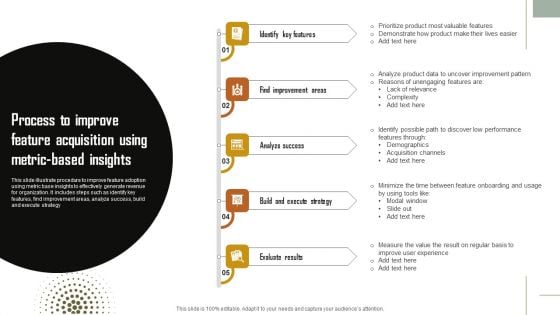
Process To Improve Feature Acquisition Using Metric Based Insights Topics PDF
This slide illustrate procedure to improve feature adoption using metric base insights to effectively generate revenue for organization. It includes steps such as identify key features, find improvement areas, analyze success, build and execute strategy. Persuade your audience using this Process To Improve Feature Acquisition Using Metric Based Insights Topics PDF. This PPT design covers five stages, thus making it a great tool to use. It also caters to a variety of topics including Analyze Success, Build And Execute Strategy, Evaluate Results. Download this PPT design now to present a convincing pitch that not only emphasizes the topic but also showcases your presentation skills.
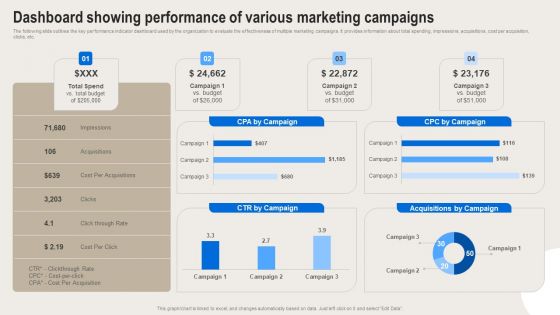
Formulating Branding Strategy To Enhance Revenue And Sales Dashboard Showing Performance Of Various Graphics PDF
The following slide outlines the key performance indicator dashboard used by the organization to evaluate the effectiveness of multiple marketing campaigns. It provides information about total spending, impressions, acquisitions, cost per acquisition, clicks, etc. Create an editable Formulating Branding Strategy To Enhance Revenue And Sales Dashboard Showing Performance Of Various Graphics PDF that communicates your idea and engages your audience. Whether youre presenting a business or an educational presentation, pre designed presentation templates help save time. Formulating Branding Strategy To Enhance Revenue And Sales Dashboard Showing Performance Of Various Graphics PDF is highly customizable and very easy to edit, covering many different styles from creative to business presentations. Slidegeeks has creative team members who have crafted amazing templates. So, go and get them without any delay.
Dashboard For Tracking And Measuring Business Sales And Revenue Ppt PowerPoint Presentation Slides Introduction PDF
Showcasing this set of slides titled dashboard for tracking and measuring business sales and revenue ppt powerpoint presentation slides introduction pdf. The topics addressed in these templates are revenue by pipeline jun 2020, new deals by month this year 2020, forecast june 2020, revenue goal attainment by owner jun 2020, revenue goal attainment jun 2020, pipeline coverage jul 2020. All the content presented in this PPT design is completely editable. Download it and make adjustments in color, background, font etc. as per your unique business setting.
Product Branding To Enhance Product Sales Performance Tracking Dashboard Infographics PDF
This slide provides information regarding product branding performance tracking dashboard in terms of revenues, new customers, customer satisfaction rate. Make sure to capture your audiences attention in your business displays with our gratis customizable Product Branding To Enhance Product Sales Performance Tracking Dashboard Infographics PDF. These are great for business strategies, office conferences, capital raising or task suggestions. If you desire to acquire more customers for your tech business and ensure they stay satisfied, create your own sales presentation with these plain slides.
Referral Program Partners Performance Tracking Dashboard Word Of Mouth Marketing Pictures Pdf
This slide covers dashboard to track effectiveness of partners in referral program along revenue generation. It include elements such as total partners, patner employees, referrals received, revenue earned, etc.Do you know about Slidesgeeks Referral Program Partners Performance Tracking Dashboard Word Of Mouth Marketing Pictures Pdf These are perfect for delivering any kind od presentation. Using it, create PowerPoint presentations that communicate your ideas and engage audiences. Save time and effort by using our pre-designed presentation templates that are perfect for a wide range of topic. Our vast selection of designs covers a range of styles, from creative to business, and are all highly customizable and easy to edit. Download as a PowerPoint template or use them as Google Slides themes. This slide covers dashboard to track effectiveness of partners in referral program along revenue generation. It include elements such as total partners, patner employees, referrals received, revenue earned, etc.
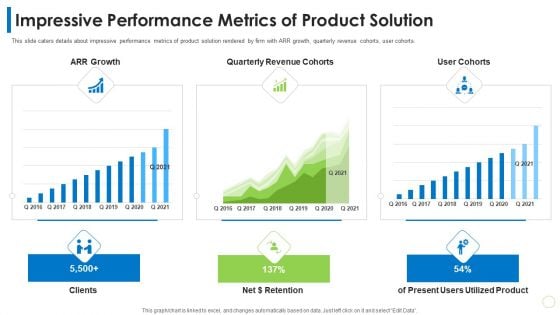
Pitch Deck PPT For Commodity Impressive Performance Metrics Of Product Solution Ppt Gallery Vector PDF
This slide caters details about impressive performance metrics of product solution rendered by firm with ARR growth, quarterly revenue cohorts, user cohorts. Deliver and pitch your topic in the best possible manner with this pitch deck ppt for commodity impressive performance metrics of product solution ppt gallery vector pdf. Use them to share invaluable insights on arr growth, quarterly revenue cohorts, user cohorts, clients and impress your audience. This template can be altered and modified as per your expectations. So, grab it now.
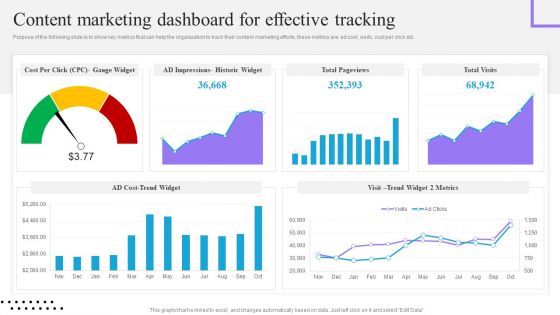
Content And Permission Marketing Tactics For Enhancing Business Revenues Content Marketing Dashboard Topics PDF
Purpose of the following slide is to show key metrics that can help the organization to track their content marketing efforts, these metrics are ad cost, visits, cost per click etc. Slidegeeks is here to make your presentations a breeze with Content And Permission Marketing Tactics For Enhancing Business Revenues Content Marketing Dashboard Topics PDF With our easy-to-use and customizable templates, you can focus on delivering your ideas rather than worrying about formatting. With a variety of designs to choose from, you are sure to find one that suits your needs. And with animations and unique photos, illustrations, and fonts, you can make your presentation pop. So whether you are giving a sales pitch or presenting to the board, make sure to check out Slidegeeks first
Content Marketing Freelance Metrics Dashboard With Visitor Demographics Icons PDF
Showcasing this set of slides titled Content Marketing Freelance Metrics Dashboard With Visitor Demographics Icons PDF. The topics addressed in these templates are Content Level Metrics, Revenue Generated, Visitor Demographics. All the content presented in this PPT design is completely editable. Download it and make adjustments in color, background, font etc. as per your unique business setting.
Product Management Team Performance Tracking KPI Dashboard Pictures PDF
This slide provides performance tracking dashboard for product development project team. It provides information regarding hours spent on project, deadlines, employee responsible, new leads and revenue generated. Pitch your topic with ease and precision using this Product Management Team Performance Tracking KPI Dashboard Pictures PDF. This layout presents information on Tracking KPI Dashboard, Product Management Team Performance. It is also available for immediate download and adjustment. So, changes can be made in the color, design, graphics or any other component to create a unique layout.
Optimize Brand Valuation Product Branding Performance Tracking Dashboard Background PDF
This slide provides information regarding product branding performance tracking dashboard in terms of revenues, new customers, customer satisfaction rate. Create an editable Optimize Brand Valuation Product Branding Performance Tracking Dashboard Background PDF that communicates your idea and engages your audience. Whether you are presenting a business or an educational presentation, pre-designed presentation templates help save time. Optimize Brand Valuation Product Branding Performance Tracking Dashboard Background PDF is highly customizable and very easy to edit, covering many different styles from creative to business presentations. Slidegeeks has creative team members who have crafted amazing templates. So, go and get them without any delay.
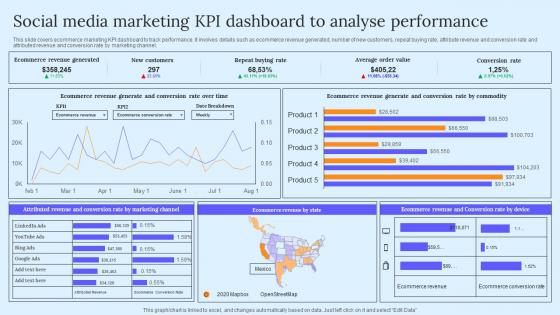
Social Media Marketing KPI Dashboard B2B Marketing Techniques To Attract Potential Pictures Pdf
This slide covers ecommerce marketing KPI dashboard to track performance. It involves details such as ecommerce revenue generated, number of new customers, repeat buying rate, attribute revenue and conversion rate and attributed revenue and conversion rate by marketing channel. Do you have an important presentation coming up Are you looking for something that will make your presentation stand out from the rest Look no further than Social Media Marketing KPI Dashboard B2B Marketing Techniques To Attract Potential Pictures Pdf. With our professional designs, you can trust that your presentation will pop and make delivering it a smooth process. And with Slidegeeks, you can trust that your presentation will be unique and memorable. So why wait Grab Social Media Marketing KPI Dashboard B2B Marketing Techniques To Attract Potential Pictures Pdf today and make your presentation stand out from the rest This slide covers ecommerce marketing KPI dashboard to track performance. It involves details such as ecommerce revenue generated, number of new customers, repeat buying rate, attribute revenue and conversion rate and attributed revenue and conversion rate by marketing channel.
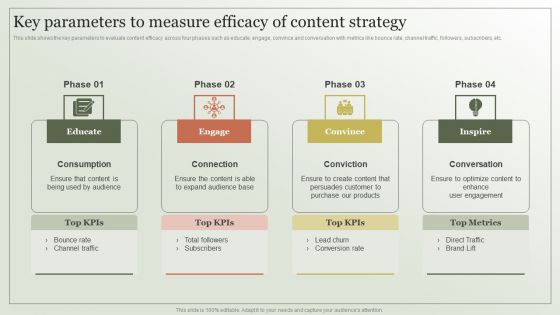
Content Marketing Strategy Key Parameters To Measure Efficacy Of Content Strategy Sample PDF
This slide shows the key parameters to evaluate content efficacy across four phases such as educate, engage, convince and conversation with metrics like bounce rate, channel traffic, followers, subscribers, etc. Make sure to capture your audiences attention in your business displays with our gratis customizable Content Marketing Strategy Key Parameters To Measure Efficacy Of Content Strategy Sample PDF. These are great for business strategies, office conferences, capital raising or task suggestions. If you desire to acquire more customers for your tech business and ensure they stay satisfied, create your own sales presentation with these plain slides.
Expensive Education Balance PowerPoint Slides Editable Ppt Templates
Expensive Education Balance PowerPoint Slides Editable PPT templates-These high quality powerpoint pre-designed slides and powerpoint templates have been carefully created by our professional team to help you impress your audience. All slides have been created and are 100% editable in powerpoint. Each and every property of any graphic - color, size, orientation, shading, outline etc. can be modified to help you build an effective powerpoint presentation. Any text can be entered at any point in the powerpoint template or slide. Simply DOWNLOAD, TYPE and PRESENT!-These PowerPoint presentation slides can be used for themes relating to-Alternative, analysis, background, balance, business, case, classic, compare, comparison, concept, court, crime, decisions, doubt, election, equal, fairness, guilt, honesty, icon, idea, innocence, judge, justice, law, legal, liberty, litigation, measure, measurement, opinion, scale, sign, silver, stand, steel, symbol, trial, tribunal, value, web, weigh, weight-Expensive Education Balance PowerPoint Slides Editable PPT templates Access our Expensive Education Balance PowerPoint Slides Editable Ppt Templates anytime,anywhere. They are available around the clock.
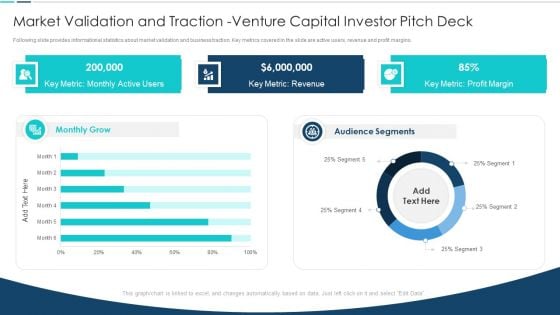
Market Validation And Traction Venture Capital Investor Pitch Deck Microsoft PDF
Following slide provides informational statistics about market validation and business traction. Key metrics covered in the slide are active users, revenue and profit margins. Deliver an awe inspiring pitch with this creative Market Validation And Traction Venture Capital Investor Pitch Deck Microsoft PDF bundle. Topics like Monthly Grow Segment, Audience Segments Monthly, Key Metric Revenue, Key Metric Profit can be discussed with this completely editable template. It is available for immediate download depending on the needs and requirements of the user.
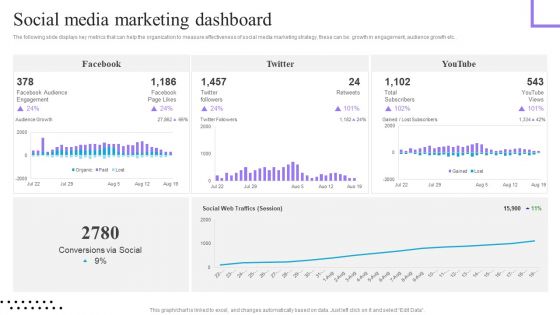
Content And Permission Marketing Tactics For Enhancing Business Revenues Social Media Marketing Dashboard Download PDF
The following slide displays key metrics that can help the organization to measure effectiveness of social media marketing strategy, these can be growth in engagement, audience growth etc.. Present like a pro with Content And Permission Marketing Tactics For Enhancing Business Revenues Social Media Marketing Dashboard Download PDF Create beautiful presentations together with your team, using our easy-to-use presentation slides. Share your ideas in real-time and make changes on the fly by downloading our templates. So whether you are in the office, on the go, or in a remote location, you can stay in sync with your team and present your ideas with confidence. With Slidegeeks presentation got a whole lot easier. Grab these presentations today.

Project Metrics Dashboard With Average Margin Sample PDF
This slide focuses on project management dashboard which covers number of active projects, average margin, revenues, costs, tasks status, resources with planned and actual efforts, available hours, tasks assignments with project deadlines, client, etc. Pitch your topic with ease and precision using this Project Metrics Dashboard With Average Margin Sample PDF. This layout presents information on Average Margin, Revenue, Cost. It is also available for immediate download and adjustment. So, changes can be made in the color, design, graphics or any other component to create a unique layout.
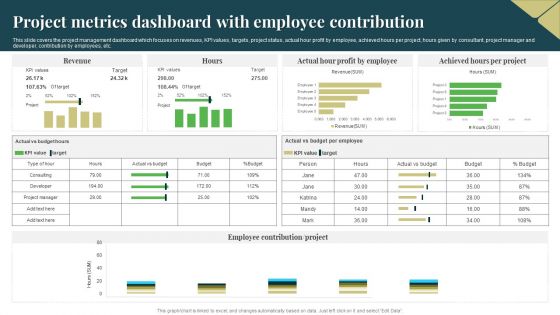
Project Metrics Dashboard With Employee Contribution Guidelines PDF
This slide covers the project management dashboard which focuses on revenues, KPI values, targets, project status, actual hour profit by employee, achieved hours per project, hours given by consultant, project manager and developer, contribution by employees, etc. Showcasing this set of slides titled Project Metrics Dashboard With Employee Contribution Guidelines PDF. The topics addressed in these templates are Target, Revenue, Profit By Employee. All the content presented in this PPT design is completely editable. Download it and make adjustments in color, background, font etc. as per your unique business setting.
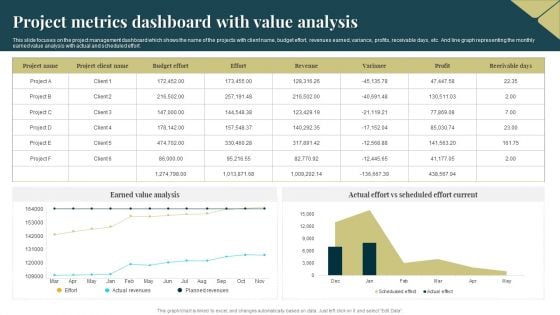
Project Metrics Dashboard With Value Analysis Introduction PDF
This slide focuses on the project management dashboard which shows the name of the projects with client name, budget effort, revenues earned, variance, profits, receivable days, etc. And line graph representing the monthly earned value analysis with actual and scheduled effort. Showcasing this set of slides titled Project Metrics Dashboard With Value Analysis Introduction PDF. The topics addressed in these templates are Budget Effort, Revenues, Earned Value Analysis. All the content presented in this PPT design is completely editable. Download it and make adjustments in color, background, font etc. as per your unique business setting.
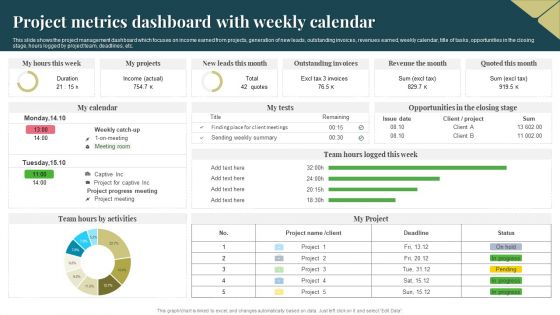
Project Metrics Dashboard With Weekly Calendar Download PDF
This slide shows the project management dashboard which focuses on income earned from projects, generation of new leads, outstanding invoices, revenues earned, weekly calendar, title of tasks, opportunities in the closing stage, hours logged by project team, deadlines, etc. Pitch your topic with ease and precision using this Project Metrics Dashboard With Weekly Calendar Download PDF. This layout presents information on Income, Revenue, Project. It is also available for immediate download and adjustment. So, changes can be made in the color, design, graphics or any other component to create a unique layout.
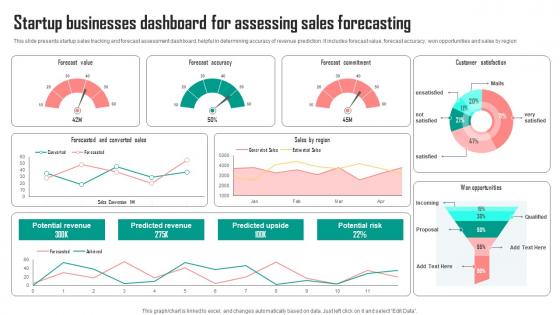
Startup Businesses Dashboard For Assessing Sales Forecasting Background Pdf
This slide presents startup sales tracking and forecast assessment dashboard, helpful in determining accuracy of revenue prediction. It includes forecast value, forecast accuracy, won opportunities and sales by region Pitch your topic with ease and precision using this Startup Businesses Dashboard For Assessing Sales Forecasting Background Pdf. This layout presents information on Forecast Value, Accuracy, Commitment. It is also available for immediate download and adjustment. So, changes can be made in the color, design, graphics or any other component to create a unique layout. This slide presents startup sales tracking and forecast assessment dashboard, helpful in determining accuracy of revenue prediction. It includes forecast value, forecast accuracy, won opportunities and sales by region
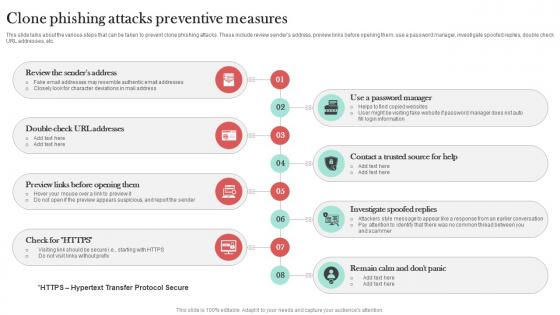
Clone Phishing Attacks Preventive Measures Man In The Middle Phishing IT
This slide talks about the various steps that can be taken to prevent clone phishing attacks. These include review senders address, preview links before opening them, use a password manager, investigate spoofed replies, double check URL addresses, etc. Make sure to capture your audiences attention in your business displays with our gratis customizable Clone Phishing Attacks Preventive Measures Man In The Middle Phishing IT. These are great for business strategies, office conferences, capital raising or task suggestions. If you desire to acquire more customers for your tech business and ensure they stay satisfied, create your own sales presentation with these plain slides. This slide talks about the various steps that can be taken to prevent clone phishing attacks. These include review senders address, preview links before opening them, use a password manager, investigate spoofed replies, double check URL addresses, etc.

Man Deciding Which Way To Go PowerPoint Templates Ppt Backgrounds For Slides 0713
Generate camaradarie with our Man Deciding Which Way To Go PowerPoint Templates PPT Backgrounds For Slides. Measure your team's success with our Man Deciding Which Way To Go PowerPoint Templates Ppt Backgrounds For Slides 0713. You will be at the top of your game.
Dashboard For Tracking Organizational OGSM Model Metrics Microsoft PDF
Pitch your topic with ease and precision using this Dashboard For Tracking Organizational OGSM Model Metrics Microsoft PDF. This layout presents information on Revenue, Market Share, Gross Margin. It is also available for immediate download and adjustment. So, changes can be made in the color, design, graphics or any other component to create a unique layout.
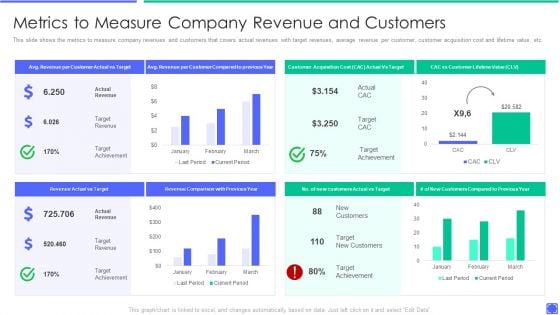
Best Techniques To Enhance New Product Management Efficiency Metrics To Measure Company Professional PDF
This slide shows the metrics to measure company revenues and customers that covers actual revenues with target revenues, average revenue per customer, customer acquisition cost and lifetime value, etc. Deliver and pitch your topic in the best possible manner with this best techniques to enhance new product management efficiency metrics to measure company professional pdf. Use them to share invaluable insights on measuring affect of development strategy on product metrics and impress your audience. This template can be altered and modified as per your expectations. So, grab it now.
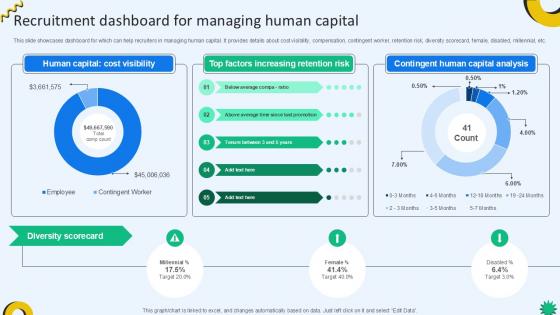
Recruitment Dashboard For Managing Cloud Recruiting Technologies PPT Example
This slide showcases dashboard for which can help recruiters in managing human capital. It provides details about cost visibility, compensation, contingent worker, retention risk, diversity scorecard, female, disabled, millennial, etc. The Recruitment Dashboard For Managing Cloud Recruiting Technologies PPT Example is a compilation of the most recent design trends as a series of slides. It is suitable for any subject or industry presentation, containing attractive visuals and photo spots for businesses to clearly express their messages. This template contains a variety of slides for the user to input data, such as structures to contrast two elements, bullet points, and slides for written information. Slidegeeks is prepared to create an impression. This slide showcases dashboard for which can help recruiters in managing human capital. It provides details about cost visibility, compensation, contingent worker, retention risk, diversity scorecard, female, disabled, millennial, etc.
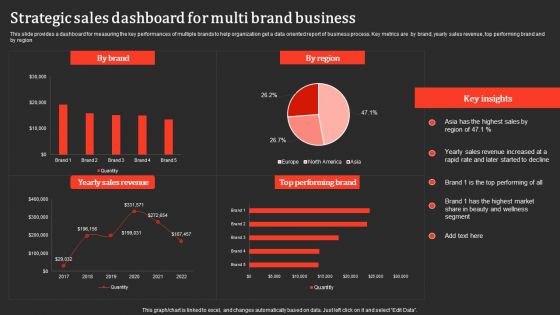
Strategic Sales Dashboard For Multi Brand Business Professional PDF
This slide provides a dashboard for measuring the key performances of multiple brands to help organization get a data oriented report of business process. Key metrics are by brand, yearly sales revenue, top performing brand and by region. Pitch your topic with ease and precision using this Strategic Sales Dashboard For Multi Brand Business Professional PDF. This layout presents information on Yearly Sales Revenue, Performing Brand. It is also available for immediate download and adjustment. So, changes can be made in the color, design, graphics or any other component to create a unique layout.
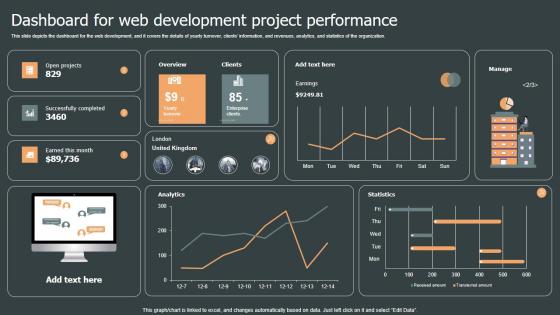
Dashboard For Web Development Role Web Designing User Engagement Topics PDF
This slide depicts the dashboard for the web development, and it covers the details of yearly turnover, clients information, and revenues, analytics, and statistics of the organization. There are so many reasons you need a Dashboard For Web Development Role Web Designing User Engagement Topics PDF. The first reason is you can not spend time making everything from scratch, Thus, Slidegeeks has made presentation templates for you too. You can easily download these templates from our website easily. This slide depicts the dashboard for the web development, and it covers the details of yearly turnover, clients information, and revenues, analytics, and statistics of the organization.
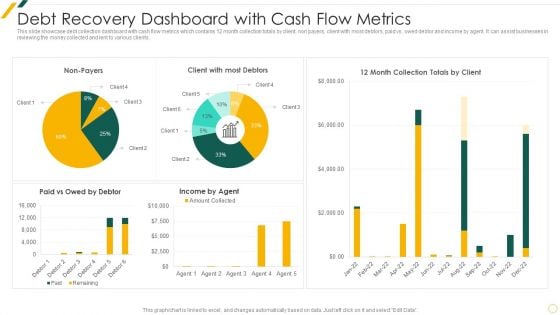
Debt Recovery Dashboard With Cash Flow Metrics Summary PDF
This slide showcase debt collection dashboard with cash flow metrics which contains 12 month collection totals by client, non payers, client with most debtors, paid vs. owed debtor and income by agent. It can assist businesses in reviewing the money collected and lent to various clients.Pitch your topic with ease and precision using this Debt Recovery Dashboard With Cash Flow Metrics Summary PDF This layout presents information on Debt Recovery, Dashboard Cash, Flow Metrics It is also available for immediate download and adjustment. So, changes can be made in the color, design, graphics or any other component to create a unique layout.
KPI Dashboard For Tracking Holistic Marketing Strategies To Optimize Guidelines Pdf
This slide showcases the KPI dashboard that would help the business organization to track shareholder and companys valuation. It includes parameters such as total dividend growth rate, total capital return, share count reduced, etc. Explore a selection of the finest KPI Dashboard For Tracking Holistic Marketing Strategies To Optimize Guidelines Pdf here. With a plethora of professionally designed and pre made slide templates, you can quickly and easily find the right one for your upcoming presentation. You can use our KPI Dashboard For Tracking Holistic Marketing Strategies To Optimize Guidelines Pdf to effectively convey your message to a wider audience. Slidegeeks has done a lot of research before preparing these presentation templates. The content can be personalized and the slides are highly editable. Grab templates today from Slidegeeks. This slide showcases the KPI dashboard that would help the business organization to track shareholder and companys valuation. It includes parameters such as total dividend growth rate, total capital return, share count reduced, etc.
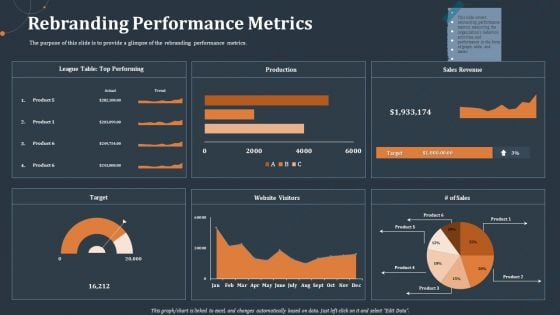
Rebranding Performance Metrics Ppt PowerPoint Presentation Infographics Layout PDF
The purpose of this slide is to provide a glimpse of the rebranding performance metrics.Deliver an awe inspiring pitch with this creative rebranding performance metrics ppt powerpoint presentation infographics layout pdf bundle. Topics like league table top performing, production, sales revenue, website visitors, target can be discussed with this completely editable template. It is available for immediate download depending on the needs and requirements of the user.
Product And Customer Performance Tracking Dashboard Portrait PDF
This slide provides information regarding dashboard utilized by firm to monitor performance of products offered and customer associated. The performance is tracked through revenues generated, new customer acquired, customer satisfaction, sales comparison, etc. Do you have an important presentation coming up Are you looking for something that will make your presentation stand out from the rest Look no further than Product And Customer Performance Tracking Dashboard Portrait PDF. With our professional designs, you can trust that your presentation will pop and make delivering it a smooth process. And with Slidegeeks, you can trust that your presentation will be unique and memorable. So why wait Grab Product And Customer Performance Tracking Dashboard Portrait PDF today and make your presentation stand out from the rest.
Product And Customer Performance Tracking Dashboard Summary PDF
This slide provides information regarding dashboard utilized by firm to monitor performance of products offered and customer associated. The performance is tracked through revenues generated, new customer acquired, customer satisfaction, sales comparison, etc. If you are looking for a format to display your unique thoughts, then the professionally designed Product And Customer Performance Tracking Dashboard Summary PDF is the one for you. You can use it as a Google Slides template or a PowerPoint template. Incorporate impressive visuals, symbols, images, and other charts. Modify or reorganize the text boxes as you desire. Experiment with shade schemes and font pairings. Alter, share or cooperate with other people on your work. Download Product And Customer Performance Tracking Dashboard Summary PDF and find out how to give a successful presentation. Present a perfect display to your team and make your presentation unforgettable.

New Product Sales Strategy And Marketing KPI Dashboard To Monitor Sales Performance Information PDF
This slide shows sales performance monitoring dashboard. Metrics included in the dashboard are sales revenue, sales growth, average revenue per unit, customer lifetime value and customer acquisition cost. Deliver an awe inspiring pitch with this creative New Product Sales Strategy And Marketing KPI Dashboard To Monitor Sales Performance Information PDF bundle. Topics like Sales Revenue, Monthly Sales Growth, Sales Country Performance can be discussed with this completely editable template. It is available for immediate download depending on the needs and requirements of the user.
Market Penetration Dashboard With Sales Metrics Ppt Icon Examples PDF
This slide shows market penetration dashboard for sales team. It provides information about regions, emerging markets, planned sales, actual sales, revenue, gender wise sales, etc. Pitch your topic with ease and precision using this Market Penetration Dashboard With Sales Metrics Ppt Icon Examples PDF. This layout presents information on Emerging Markets, Sales Gender, Actual Sales. It is also available for immediate download and adjustment. So, changes can be made in the color, design, graphics or any other component to create a unique layout.
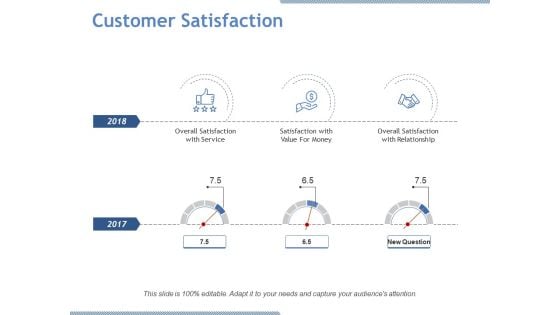
Customer Satisfaction Ppt PowerPoint Presentation Model Gridlines
This is a customer satisfaction ppt powerpoint presentation model gridlines. This is a three stage process. The stages in this process are overall satisfaction with service, new question, satisfaction with value for money.
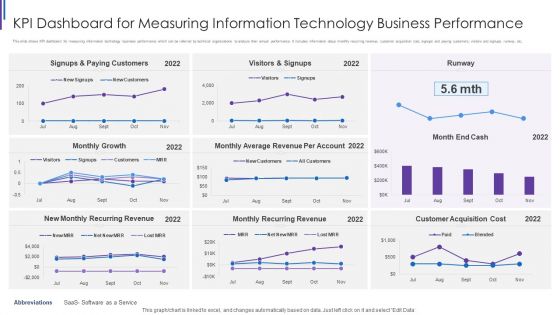
KPI Dashboard For Measuring Information Technology Business Performance Designs PDF
This slide shows KPI dashboard for measuring information technology business performance which can be referred by technical organizations to analyze their annual performance. It includes information about monthly recurring revenue, customer acquisition cost, signups and paying customers, visitors and signups, runway, etc. Showcasing this set of slides titled KPI Dashboard For Measuring Information Technology Business Performance Designs PDF. The topics addressed in these templates are Signups And Paying, Customers Monthly Growth, Visitors And Signups, Monthly Average Revenue. All the content presented in this PPT design is completely editable. Download it and make adjustments in color, background, font etc. as per your unique business setting.
Social Media Customer Service Tracking Dashboard Video Conferencing In Corporate Elements Pdf
This slide represents the social dashboard for tracking media customer service by covering the total number of requests and requests answered, total revenue, support costs rate to revenue rate, customer satisfaction, the average time to solve an issue, and so on. Presenting this PowerPoint presentation, titled Social Media Customer Service Tracking Dashboard Video Conferencing In Corporate Elements Pdf, with topics curated by our researchers after extensive research. This editable presentation is available for immediate download and provides attractive features when used. Download now and captivate your audience. Presenting this Social Media Customer Service Tracking Dashboard Video Conferencing In Corporate Elements Pdf. Our researchers have carefully researched and created these slides with all aspects taken into consideration. This is a completely customizable Social Media Customer Service Tracking Dashboard Video Conferencing In Corporate Elements Pdf that is available for immediate downloading. Download now and make an impact on your audience. Highlight the attractive features available with our PPTs. This slide represents the social dashboard for tracking media customer service by covering the total number of requests and requests answered, total revenue, support costs rate to revenue rate, customer satisfaction, the average time to solve an issue, and so on.
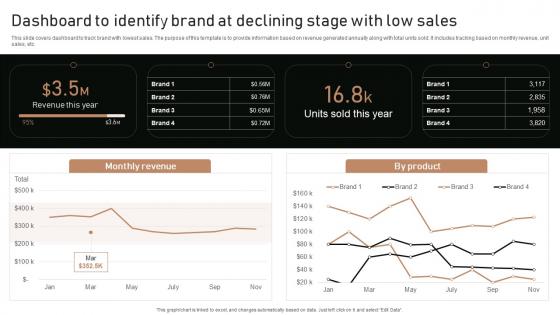
Execution Of Product Lifecycle Dashboard To Identify Brand At Declining Stage Ideas Pdf
This slide covers dashboard to track brand with lowest sales. The purpose of this template is to provide information based on revenue generated annually along with total units sold. It includes tracking based on monthly revenue, unit sales, etc. Get a simple yet stunning designed Execution Of Product Lifecycle Dashboard To Identify Brand At Declining Stage Ideas Pdf. It is the best one to establish the tone in your meetings. It is an excellent way to make your presentations highly effective. So, download this PPT today from Slidegeeks and see the positive impacts. Our easy-to-edit Execution Of Product Lifecycle Dashboard To Identify Brand At Declining Stage Ideas Pdf can be your go-to option for all upcoming conferences and meetings. So, what are you waiting for Grab this template today. This slide covers dashboard to track brand with lowest sales. The purpose of this template is to provide information based on revenue generated annually along with total units sold. It includes tracking based on monthly revenue, unit sales, etc.
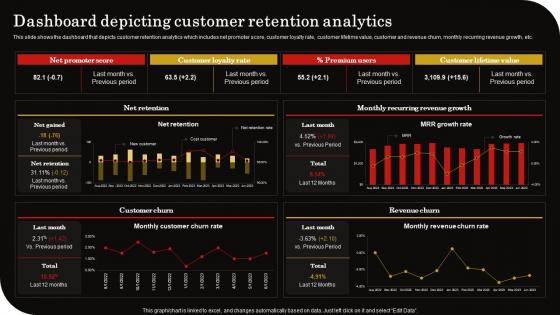
Dashboard Depicting Customer Retention Client Retention Strategy To Reduce Churn Rate Professional Pdf
This slide shows the dashboard that depicts customer retention analytics which includes net promoter score, customer loyalty rate, customer lifetime value, customer and revenue churn, monthly recurring revenue growth, etc. If you are looking for a format to display your unique thoughts, then the professionally designed Dashboard Depicting Customer Retention Client Retention Strategy To Reduce Churn Rate Professional Pdf is the one for you. You can use it as a Google Slides template or a PowerPoint template. Incorporate impressive visuals, symbols, images, and other charts. Modify or reorganize the text boxes as you desire. Experiment with shade schemes and font pairings. Alter, share or cooperate with other people on your work. Download Dashboard Depicting Customer Retention Client Retention Strategy To Reduce Churn Rate Professional Pdf and find out how to give a successful presentation. Present a perfect display to your team and make your presentation unforgettable. This slide shows the dashboard that depicts customer retention analytics which includes net promoter score, customer loyalty rate, customer lifetime value, customer and revenue churn, monthly recurring revenue growth, etc.
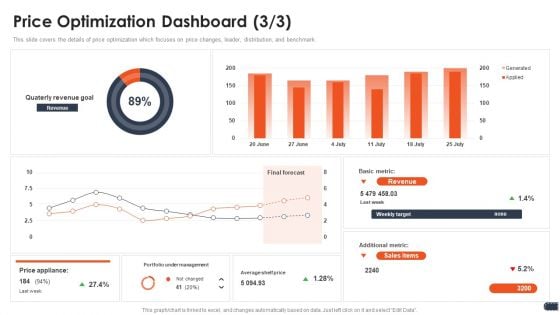
Business Pricing Model Price Optimization Dashboard Metric Clipart PDF
This slide covers the details of price optimization which focuses on price changes, leader, distribution, and benchmark. Deliver and pitch your topic in the best possible manner with this business pricing model price optimization dashboard metric clipart pdf. Use them to share invaluable insights on portfolio, management, price, revenue, target and impress your audience. This template can be altered and modified as per your expectations. So, grab it now.
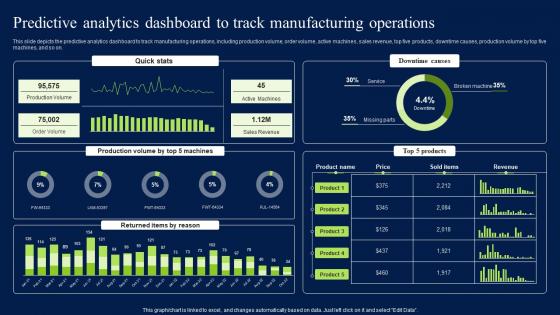
Predictive Analytics Dashboard To Track Manufacturing Operations Download PDF
This slide depicts the predictive analytics dashboard to track manufacturing operations, including production volume, order volume, active machines, sales revenue, top five products, downtime causes, production volume by top five machines, and so on. Present like a pro with Predictive Analytics Dashboard To Track Manufacturing Operations Download PDF Create beautiful presentations together with your team, using our easy-to-use presentation slides. Share your ideas in real-time and make changes on the fly by downloading our templates. So whether you are in the office, on the go, or in a remote location, you can stay in sync with your team and present your ideas with confidence. With Slidegeeks presentation got a whole lot easier. Grab these presentations today. This slide depicts the predictive analytics dashboard to track manufacturing operations, including production volume, order volume, active machines, sales revenue, top five products, downtime causes, production volume by top five machines, and so on.
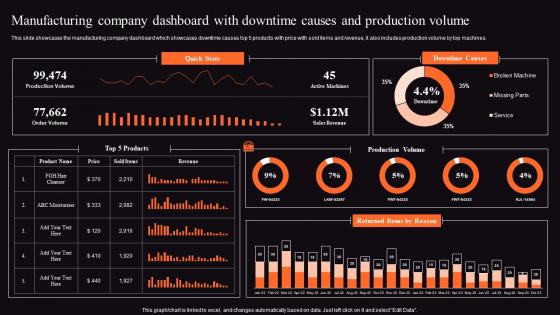
Food Processing Business Profile Manufacturing Company Dashboard Brochure Pdf
This slide showcases the manufacturing company dashboard which showcases downtime causes top 5 products with price with sold items and revenue, it also includes production volume by top machines. Do you know about Slidesgeeks Food Processing Business Profile Manufacturing Company Dashboard Brochure Pdf These are perfect for delivering any kind od presentation. Using it, create PowerPoint presentations that communicate your ideas and engage audiences. Save time and effort by using our pre designed presentation templates that are perfect for a wide range of topic. Our vast selection of designs covers a range of styles, from creative to business, and are all highly customizable and easy to edit. Download as a PowerPoint template or use them as Google Slides themes. This slide showcases the manufacturing company dashboard which showcases downtime causes top 5 products with price with sold items and revenue, it also includes production volume by top machines.


 Continue with Email

 Home
Home


