Financial Kpis
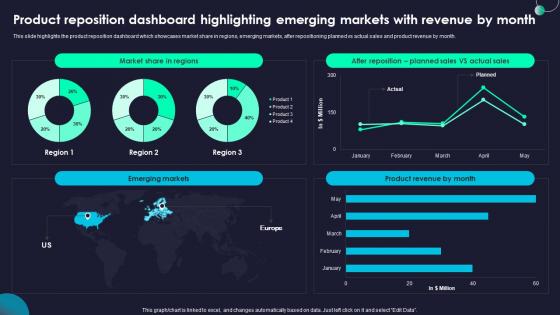
Product Reposition Dashboard Rebranding Marketing Strategies For Effective Diagrams Pdf
This slide highlights the product reposition dashboard which showcases market share in regions, emerging markets, after repositioning planned vs actual sales and product revenue by month. Welcome to our selection of the Product Reposition Dashboard Rebranding Marketing Strategies For Effective Diagrams Pdf, These are designed to help you showcase your creativity and bring your sphere to life. Planning and Innovation are essential for any business that is just starting out. This collection contains the designs that you need for your everyday presentations. All of our PowerPoints are 100 percent editable, so you can customize them to suit your needs. This multi purpose template can be used in various situations. Grab these presentation templates today This slide highlights the product reposition dashboard which showcases market share in regions, emerging markets, after repositioning planned vs actual sales and product revenue by month.
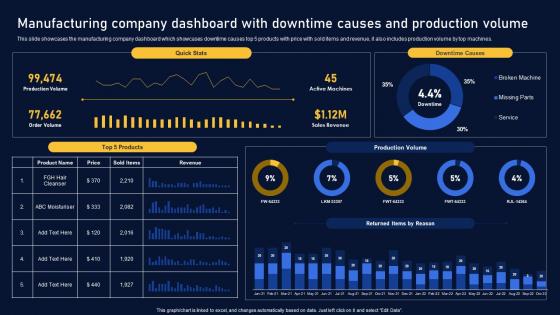
Manufacturing Company Dashboard Multinational Organization Customer Goods Diagrams Pdf
This slide showcases the manufacturing company dashboard which showcases downtime causes top 5 products with price with sold items and revenue, it also includes production volume by top machines. This modern and well arranged Manufacturing Company Dashboard Multinational Organization Customer Goods Diagrams Pdf provides lots of creative possibilities. It is very simple to customize and edit with the Powerpoint Software. Just drag and drop your pictures into the shapes. All facets of this template can be edited with Powerpoint, no extra software is necessary. Add your own material, put your images in the places assigned for them, adjust the colors, and then you can show your slides to the world, with an animated slide included. This slide showcases the manufacturing company dashboard which showcases downtime causes top 5 products with price with sold items and revenue, it also includes production volume by top machines.
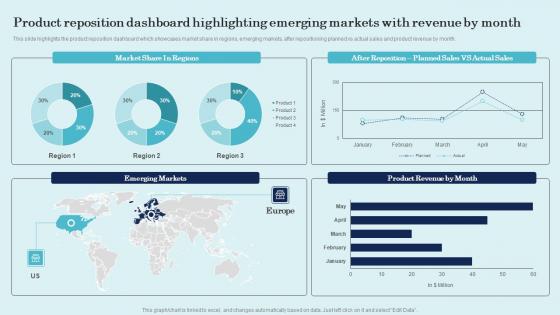
Product Reposition Dashboard Highlighting Emerging Product Repositioning Technique Pictures Pdf
This slide highlights the product reposition dashboard which showcases market share in regions, emerging markets, after repositioning planned vs actual sales and product revenue by month. Welcome to our selection of the Product Reposition Dashboard Highlighting Emerging Product Repositioning Technique Pictures Pdf. These are designed to help you showcase your creativity and bring your sphere to life. Planning and Innovation are essential for any business that is just starting out. This collection contains the designs that you need for your everyday presentations. All of our PowerPoints are 100 percent editable, so you can customize them to suit your needs. This multi-purpose template can be used in various situations. Grab these presentation templates today. This slide highlights the product reposition dashboard which showcases market share in regions, emerging markets, after repositioning planned vs actual sales and product revenue by month.
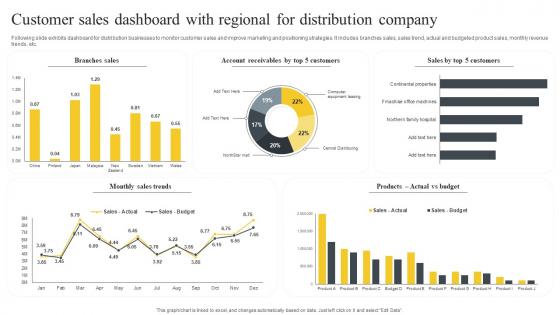
Customer Sales Dashboard With Regional For Distribution Company Brochure Pdf
Following slide exhibits dashboard for distribution businesses to monitor customer sales and improve marketing and positioning strategies. It includes branches sales, sales trend, actual and budgeted product sales, monthly revenue trends, etc. Pitch your topic with ease and precision using this Customer Sales Dashboard With Regional For Distribution Company Brochure Pdf. This layout presents information on Branches Sales, Monthly Sales Trends, Customers. It is also available for immediate download and adjustment. So, changes can be made in the color, design, graphics or any other component to create a unique layout. Following slide exhibits dashboard for distribution businesses to monitor customer sales and improve marketing and positioning strategies. It includes branches sales, sales trend, actual and budgeted product sales, monthly revenue trends, etc.
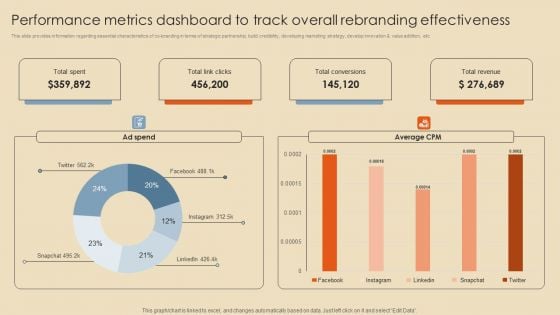
Performance Metrics Dashboard To Track Overall Rebranding Effectiveness Professional PDF
This slide provides information regarding essential characteristics of co-branding in terms of strategic partnership, build credibility, developing marketing strategy, develop innovation and value addition, etc. Make sure to capture your audiences attention in your business displays with our gratis customizable Performance Metrics Dashboard To Track Overall Rebranding Effectiveness Professional PDF. These are great for business strategies, office conferences, capital raising or task suggestions. If you desire to acquire more customers for your tech business and ensure they stay satisfied, create your own sales presentation with these plain slides.
Monthly Sales Performance Tracking And Monitoring Dashboard Diagrams PDF
This slide showcases a dashboard presenting various metrics to measure and analyze sales performance for revenue growth. It includes key components such as number of sales, revenue, profit, cost, sales revenue, sales increment, cost analysis and cross sell. Make sure to capture your audiences attention in your business displays with our gratis customizable Monthly Sales Performance Tracking And Monitoring Dashboard Diagrams PDF. These are great for business strategies, office conferences, capital raising or task suggestions. If you desire to acquire more customers for your tech business and ensure they stay satisfied, create your own sales presentation with these plain slides.
Monthly Sales Performance Tracking And Monitoring Dashboard Designs PDF
This slide showcases a dashboard presenting various metrics to measure and analyze sales performance for revenue growth. It includes key components such as number of sales, revenue, profit, cost, sales revenue, sales increment, cost analysis and cross sell. Make sure to capture your audiences attention in your business displays with our gratis customizable Monthly Sales Performance Tracking And Monitoring Dashboard Designs PDF. These are great for business strategies, office conferences, capital raising or task suggestions. If you desire to acquire more customers for your tech business and ensure they stay satisfied, create your own sales presentation with these plain slides.

Time Is Money Concept By Man Ppt PowerPoint Presentation Styles Outfit PDF
Persuade your audience using this time is money concept by man ppt powerpoint presentation styles outfit pdf. This PPT design covers three stages, thus making it a great tool to use. It also caters to a variety of topics including time is money concept by man. Download this PPT design now to present a convincing pitch that not only emphasizes the topic but also showcases your presentation skills.
Sales Dashboard With Numbers To Measure Company Performance Icons PDF
Showcasing this set of slides titled Sales Dashboard With Numbers To Measure Company Performance Icons PDF. The topics addressed in these templates are Marketing, Sales, Revenue. All the content presented in this PPT design is completely editable. Download it and make adjustments in color, background, font etc. as per your unique business setting.
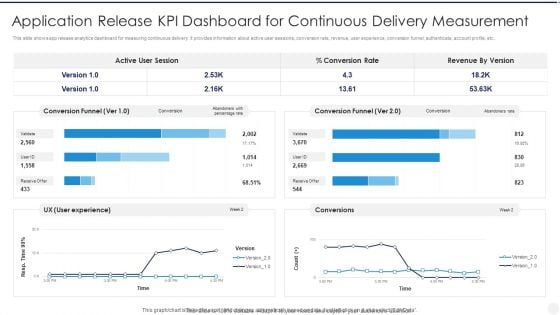
Application Release KPI Dashboard For Continuous Delivery Measurement Background PDF
Showcasing this set of slides titled Application Release KPI Dashboard For Continuous Delivery Measurement Background PDF The topics addressed in these templates are Active User Session, Conversion Rate, Revenue By Version All the content presented in this PPT design is completely editable. Download it and make adjustments in color, background, font etc. as per your unique business setting.
Efficient Administration Of Product Business And Umbrella Branding Product Branding Performance Tracking Dashboard Background PDF
This slide provides information regarding product branding performance tracking dashboard in terms of revenues, new customers, customer satisfaction rate. Make sure to capture your audiences attention in your business displays with our gratis customizable Efficient Administration Of Product Business And Umbrella Branding Product Branding Performance Tracking Dashboard Background PDF. These are great for business strategies, office conferences, capital raising or task suggestions. If you desire to acquire more customers for your tech business and ensure they stay satisfied, create your own sales presentation with these plain slides.
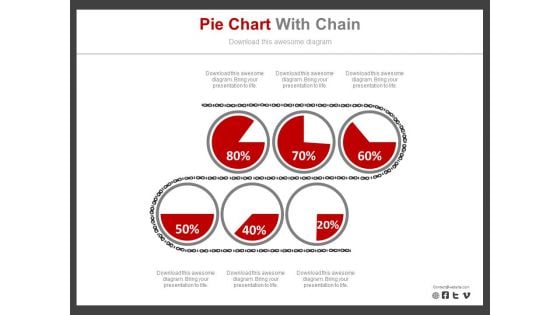
Six Pie Charts For Revenue Analysis Report Powerpoint Slides
Six pie charts have been displayed in this business slide. This business diagram helps to exhibit revenue analysis report. Download this PowerPoint template to build an exclusive presentation.
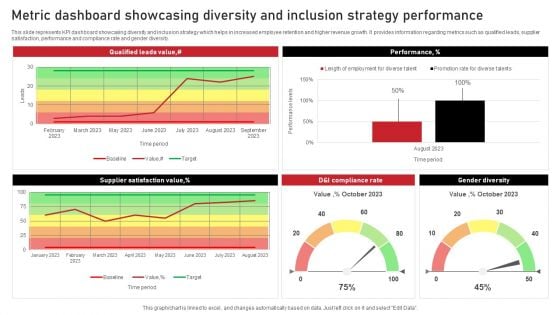
Metric Dashboard Showcasing Diversity And Inclusion Strategy Performance Background PDF
This slide represents KPI dashboard showcasing diversity and inclusion strategy which helps in increased employee retention and higher revenue growth. It provides information regarding metrics such as qualified leads, supplier satisfaction, performance and compliance rate and gender diversity. Showcasing this set of slides titled Metric Dashboard Showcasing Diversity And Inclusion Strategy Performance Background PDF. The topics addressed in these templates are Performance, Gender Diversity, Performance. All the content presented in this PPT design is completely editable. Download it and make adjustments in color, background, font etc. as per your unique business setting.
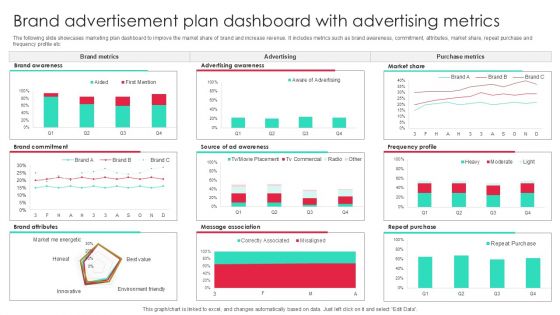
Brand Advertisement Plan Dashboard With Advertising Metrics Inspiration PDF
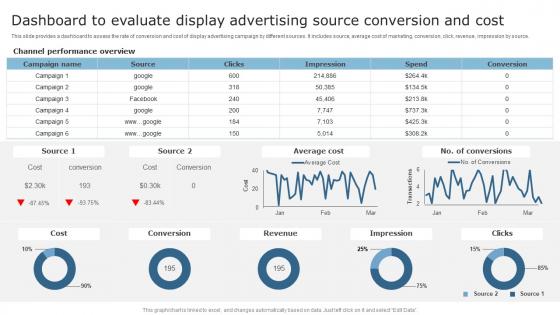
Techniques To Optimize Business Performance Dashboard To Evaluate Display Advertising Inspiration Pdf
This slide provides a dashboard to assess the rate of conversion and cost of display advertising campaign by different sources. It includes source, average cost of marketing, conversion, click, revenue, impression by source. Find highly impressive Techniques To Optimize Business Performance Dashboard To Evaluate Display Advertising Inspiration Pdf on Slidegeeks to deliver a meaningful presentation. You can save an ample amount of time using these presentation templates. No need to worry to prepare everything from scratch because Slidegeeks experts have already done a huge research and work for you. You need to download Techniques To Optimize Business Performance Dashboard To Evaluate Display Advertising Inspiration Pdf for your upcoming presentation. All the presentation templates are 100 percent editable and you can change the color and personalize the content accordingly. Download now. This slide provides a dashboard to assess the rate of conversion and cost of display advertising campaign by different sources. It includes source, average cost of marketing, conversion, click, revenue, impression by source.
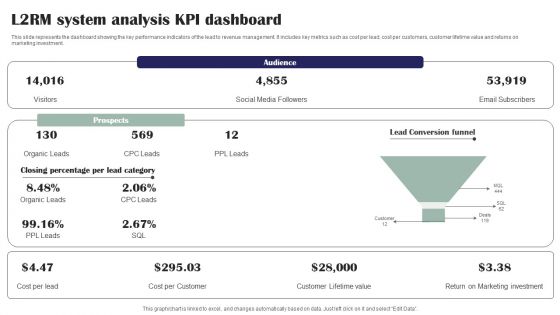
L2RM System Analysis KPI Dashboard Ppt PowerPoint Presentation File Microsoft PDF
This slide represents the dashboard showing the key performance indicators of the lead to revenue management. It includes key metrics such as cost per lead, cost per customers, customer lifetime value and returns on marketing investment. Presenting L2RM System Analysis KPI Dashboard Ppt PowerPoint Presentation File Microsoft PDF to dispense important information. This template comprises one stages. It also presents valuable insights into the topics including Audience, Prospects, Lead Conversion Funnel. This is a completely customizable PowerPoint theme that can be put to use immediately. So, download it and address the topic impactfully.
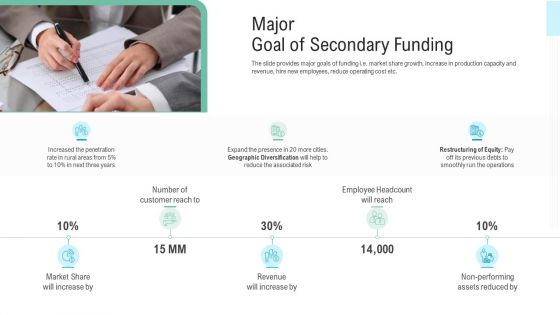
Pitch Presentation Raise Money Spot Market Major Goal Of Secondary Funding Ppt File Demonstration PDF
The slide provides major goals of funding i.e. market share growth, increase in production capacity and revenue, hire new employees, reduce operating cost etc. Presenting pitch presentation raise money spot market major goal of secondary funding ppt file demonstration pdf to provide visual cues and insights. Share and navigate important information on eight stages that need your due attention. This template can be used to pitch topics like market share, revenue, geographic diversification, performing assets. In addition, this PPT design contains high-resolution images, graphics, etc, that are easily editable and available for immediate download.
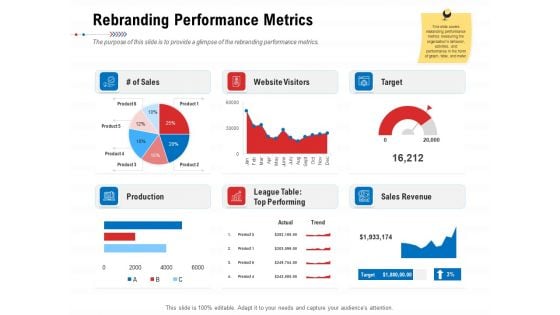
Product Relaunch And Branding Rebranding Performance Metrics Ppt Summary Outfit PDF
The purpose of this slide is to provide a glimpse of the rebranding performance metrics. Deliver an awe inspiring pitch with this creative product relaunch and branding rebranding performance metrics ppt summary outfit pdf bundle. Topics like production, sales revenue, league table top performing, target can be discussed with this completely editable template. It is available for immediate download depending on the needs and requirements of the user.
Managing It Services Spending Tracking Dashboard Playbook For Managing Us Inspiration Pdf
This slide provides information regarding the management of the digital services performance and IT spending tracking dashboard in terms of ROI, spend vs. budget, IT costs software, hardware, personnel and goals, IT spending in terms of revenues, etc. If your project calls for a presentation, then Slidegeeks is your go-to partner because we have professionally designed, easy-to-edit templates that are perfect for any presentation. After downloading, you can easily edit Managing It Services Spending Tracking Dashboard Playbook For Managing Us Inspiration Pdf and make the changes accordingly. You can rearrange slides or fill them with different images. Check out all the handy templates This slide provides information regarding the management of the digital services performance and IT spending tracking dashboard in terms of ROI, spend vs. budget, IT costs software, hardware, personnel and goals, IT spending in terms of revenues, etc.
Managing It Services Spending Tracking Dashboard Public Sector Digital Solutions Demonstration Pdf
This slide provides information regarding the management of the digital services performance and IT spending tracking dashboard in terms of ROI, spend vs. budget, IT costs software, hardware, personnel and goals, IT spending in terms of revenues, etc. The best PPT templates are a great way to save time, energy, and resources. Slidegeeks have 100 percent editable powerpoint slides making them incredibly versatile. With these quality presentation templates, you can create a captivating and memorable presentation by combining visually appealing slides and effectively communicating your message. Download Managing It Services Spending Tracking Dashboard Public Sector Digital Solutions Demonstration Pdf from Slidegeeks and deliver a wonderful presentation. This slide provides information regarding the management of the digital services performance and IT spending tracking dashboard in terms of ROI, spend vs. budget, IT costs software, hardware, personnel and goals, IT spending in terms of revenues, etc.
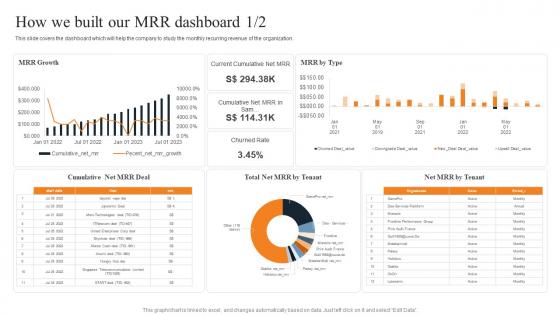
How We Built Our MRR Dashboard Layered Pricing Strategy For Managed Services Mockup Pdf
This slide covers the dashboard which will help the company to study the monthly recurring revenue of the organization. This How We Built Our MRR Dashboard Layered Pricing Strategy For Managed Services Mockup Pdf from Slidegeeks makes it easy to present information on your topic with precision. It provides customization options, so you can make changes to the colors, design, graphics, or any other component to create a unique layout. It is also available for immediate download, so you can begin using it right away. Slidegeeks has done good research to ensure that you have everything you need to make your presentation stand out. Make a name out there for a brilliant performance. This slide covers the dashboard which will help the company to study the monthly recurring revenue of the organization.
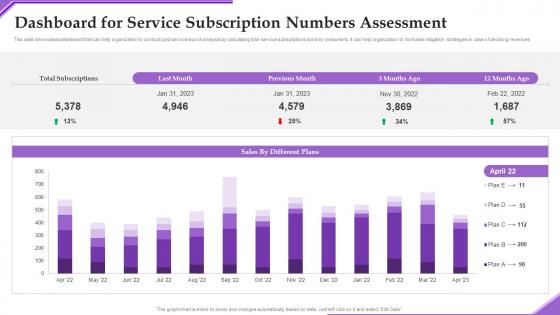
Dashboard Service Subscription Adverting New Sarvice Via Social Network Platform Inspiration Pdf
This slide showcases dashboard that can help organization to conduct post service launch analysis by calculating total service subscriptions done by consumers. It can help organization to formulate mitigation strategies in case of declining revenues Slidegeeks is one of the best resources for PowerPoint templates. You can download easily and regulate Dashboard Service Subscription Adverting New Sarvice Via Social Network Platform Inspiration Pdf for your personal presentations from our wonderful collection. A few clicks is all it takes to discover and get the most relevant and appropriate templates. Use our Templates to add a unique zing and appeal to your presentation and meetings. All the slides are easy to edit and you can use them even for advertisement purposes. This slide showcases dashboard that can help organization to conduct post service launch analysis by calculating total service subscriptions done by consumers. It can help organization to formulate mitigation strategies in case of declining revenues
Managing It Services Spending Tracking Dashboard Gen Tech Stack Playbook Inspiration Pdf
This slide provides information regarding the management of the digital services performance and IT spending tracking dashboard in terms of ROI, spend vs. budget, IT costs software, hardware, personnel and goals, IT spending in terms of revenues, etc. If your project calls for a presentation, then Slidegeeks is your go-to partner because we have professionally designed, easy-to-edit templates that are perfect for any presentation. After downloading, you can easily edit Managing It Services Spending Tracking Dashboard Gen Tech Stack Playbook Inspiration Pdf and make the changes accordingly. You can rearrange slides or fill them with different images. Check out all the handy templates This slide provides information regarding the management of the digital services performance and IT spending tracking dashboard in terms of ROI, spend vs. budget, IT costs software, hardware, personnel and goals, IT spending in terms of revenues, etc.
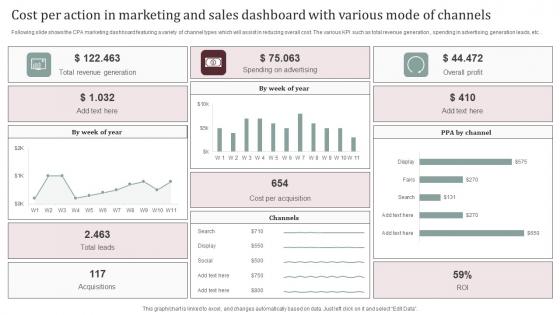
Cost Per Action In Marketing And Sales Dashboard With Various Mode Of Channels Designs Pdf
Following slide shows the CPA marketing dashboard featuring a variety of channel types which will assist in reducing overall cost. The various KPI such as total revenue generation , spending in advertising, generation leads, etc. Showcasing this set of slides titled Cost Per Action In Marketing And Sales Dashboard With Various Mode Of Channels Designs Pdf. The topics addressed in these templates are Channel, Acquisitions. All the content presented in this PPT design is completely editable. Download it and make adjustments in color, background, font etc. as per your unique business setting. Following slide shows the CPA marketing dashboard featuring a variety of channel types which will assist in reducing overall cost. The various KPI such as total revenue generation , spending in advertising, generation leads, etc.
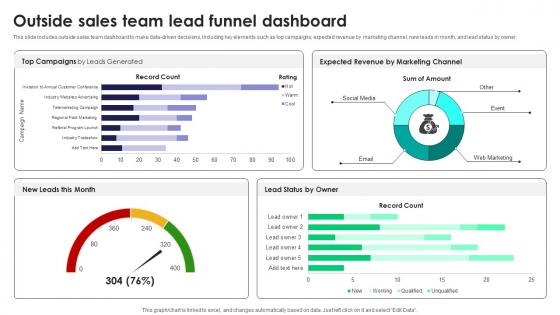
Outside Sales Team Lead Funnel Dashboard Tactics For Improving Field Sales Team SA SS V
This slide includes outside sales team dashboard to make data-driven decisions, including key elements such as top campaigns, expected revenue by marketing channel, new leads in month, and lead status by owner.Retrieve professionally designed Outside Sales Team Lead Funnel Dashboard Tactics For Improving Field Sales Team SA SS V to effectively convey your message and captivate your listeners. Save time by selecting pre-made slideshows that are appropriate for various topics, from business to educational purposes. These themes come in many different styles, from creative to corporate, and all of them are easily adjustable and can be edited quickly. Access them as PowerPoint templates or as Google Slides themes. You do not have to go on a hunt for the perfect presentation because Slidegeeks got you covered from everywhere. This slide includes outside sales team dashboard to make data-driven decisions, including key elements such as top campaigns, expected revenue by marketing channel, new leads in month, and lead status by owner.
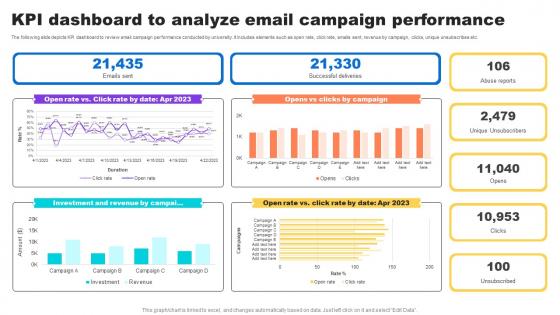
Kpi Dashboard To Analyze Email Campaign Key Step To Implementation University Strategy SS V
The following slide depicts KPI dashboard to review email campaign performance conducted by university. It includes elements such as open rate, click rate, emails sent, revenue by campaign, clicks, unique unsubscribes etc.The Kpi Dashboard To Analyze Email Campaign Key Step To Implementation University Strategy SS V is a compilation of the most recent design trends as a series of slides. It is suitable for any subject or industry presentation, containing attractive visuals and photo spots for businesses to clearly express their messages. This template contains a variety of slides for the user to input data, such as structures to contrast two elements, bullet points, and slides for written information. Slidegeeks is prepared to create an impression. The following slide depicts KPI dashboard to review email campaign performance conducted by university. It includes elements such as open rate, click rate, emails sent, revenue by campaign, clicks, unique unsubscribes etc.

KPI Dashboard To Analyze Email Campaign Performance Running Marketing Campaigns Strategy SS V
The following slide depicts KPI dashboard to review email campaign performance conducted by university. It includes elements such as open rate, click rate, emails sent, revenue by campaign, clicks, unique unsubscribes, etc. The best PPT templates are a great way to save time, energy, and resources. Slidegeeks have 100 percent editable powerpoint slides making them incredibly versatile. With these quality presentation templates, you can create a captivating and memorable presentation by combining visually appealing slides and effectively communicating your message. Download KPI Dashboard To Analyze Email Campaign Performance Running Marketing Campaigns Strategy SS V from Slidegeeks and deliver a wonderful presentation. The following slide depicts KPI dashboard to review email campaign performance conducted by university. It includes elements such as open rate, click rate, emails sent, revenue by campaign, clicks, unique unsubscribes, etc.
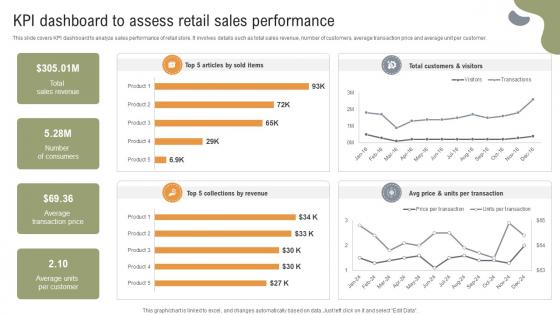
Implementing Strategies To Enhance KPI Dashboard To Assess Retail Sales Performance
This slide covers KPI dashboard to analyze sales performance of retail store. It involves details such as total sales revenue, number of customers, average transaction price and average unit per customer. The Implementing Strategies To Enhance KPI Dashboard To Assess Retail Sales Performance is a compilation of the most recent design trends as a series of slides. It is suitable for any subject or industry presentation, containing attractive visuals and photo spots for businesses to clearly express their messages. This template contains a variety of slides for the user to input data, such as structures to contrast two elements, bullet points, and slides for written information. Slidegeeks is prepared to create an impression. This slide covers KPI dashboard to analyze sales performance of retail store. It involves details such as total sales revenue, number of customers, average transaction price and average unit per customer.

KPI Dashboard To Assess Retail Sales Food And Grocery Retail Ppt Sample
This slide covers KPI dashboard to analyze sales performance of retail store. It involves details such as total sales revenue, number of customers, average transaction price and average unit per customer. From laying roadmaps to briefing everything in detail, our templates are perfect for you. You can set the stage with your presentation slides. All you have to do is download these easy-to-edit and customizable templates. KPI Dashboard To Assess Retail Sales Food And Grocery Retail Ppt Sample will help you deliver an outstanding performance that everyone would remember and praise you for. Do download this presentation today. This slide covers KPI dashboard to analyze sales performance of retail store. It involves details such as total sales revenue, number of customers, average transaction price and average unit per customer.
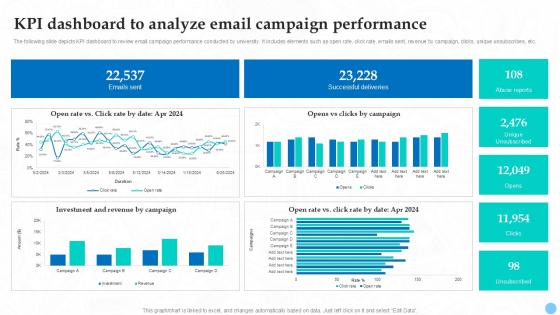
KPI Dashboard To Analyze Email Campaign Higher Education Ppt Sample Strategy SS V
The following slide depicts KPI dashboard to review email campaign performance conducted by university. It includes elements such as open rate, click rate, emails sent, revenue by campaign, clicks, unique unsubscribes, etc. The KPI Dashboard To Analyze Email Campaign Higher Education Ppt Sample Strategy SS V is a compilation of the most recent design trends as a series of slides. It is suitable for any subject or industry presentation, containing attractive visuals and photo spots for businesses to clearly express their messages. This template contains a variety of slides for the user to input data, such as structures to contrast two elements, bullet points, and slides for written information. Slidegeeks is prepared to create an impression. The following slide depicts KPI dashboard to review email campaign performance conducted by university. It includes elements such as open rate, click rate, emails sent, revenue by campaign, clicks, unique unsubscribes, etc.
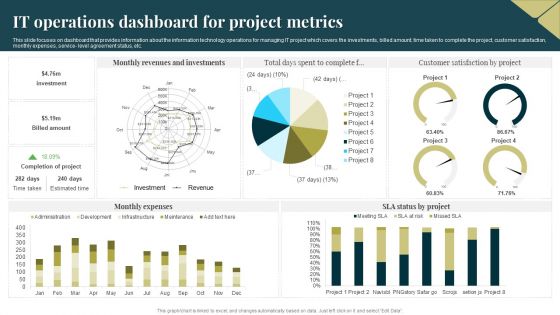
IT Operations Dashboard For Project Metrics Portrait PDF
This slide focuses on dashboard that provides information about the information technology operations for managing IT project which covers the investments, billed amount, time taken to complete the project, customer satisfaction, monthly expenses, service level agreement status, etc. Pitch your topic with ease and precision using this IT Operations Dashboard For Project Metrics Portrait PDF. This layout presents information on Revenues, Investments, Monthly Expenses. It is also available for immediate download and adjustment. So, changes can be made in the color, design, graphics or any other component to create a unique layout.
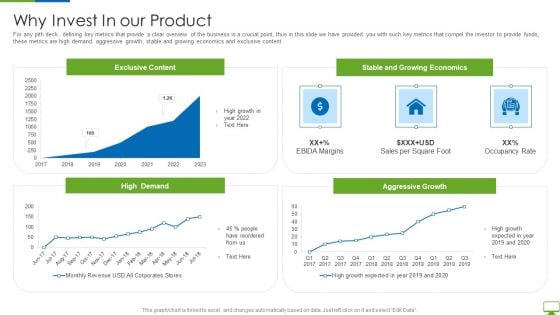
Cyber Network Simulation Platform Capital Funding Pitch Deck Why Invest In Our Product Ideas PDF
For any pith deck , defining key metrics that provide a clear overview of the business is a crucial point, thus in this slide we have provided you with such key metrics that compel the investor to provide funds, these metrics are high demand, aggressive growth, stable and growing economics and exclusive content Deliver an awe inspiring pitch with this creative cyber network simulation platform capital funding pitch deck why invest in our product ideas pdf bundle. Topics like exclusive content, stable and growing economics, aggressive growth can be discussed with this completely editable template. It is available for immediate download depending on the needs and requirements of the user.
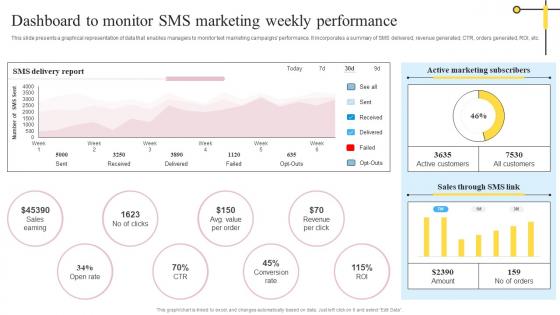
Dashboard To Monitor SMS Marketing Weekly Definitive Guide On Mass Advertising Inspiration Pdf
This slide presents a graphical representation of data that enables managers to monitor text marketing campaigns performance. It incorporates a summary of SMS delivered, revenue generated, CTR, orders generated, ROI, etc. Get a simple yet stunning designed Dashboard To Monitor SMS Marketing Weekly Definitive Guide On Mass Advertising Inspiration Pdf. It is the best one to establish the tone in your meetings. It is an excellent way to make your presentations highly effective. So, download this PPT today from Slidegeeks and see the positive impacts. Our easy-to-edit Dashboard To Monitor SMS Marketing Weekly Definitive Guide On Mass Advertising Inspiration Pdf can be your go-to option for all upcoming conferences and meetings. So, what are you waiting for Grab this template today. This slide presents a graphical representation of data that enables managers to monitor text marketing campaigns performance. It incorporates a summary of SMS delivered, revenue generated, CTR, orders generated, ROI, etc.
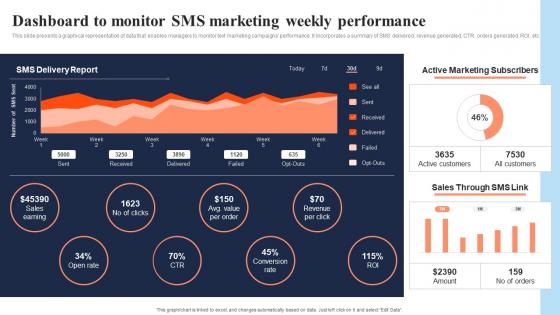
Dashboard To Monitor SMS Marketing Weekly Performance In Depth Overview Of Mass Rules Pdf
This slide presents a graphical representation of data that enables managers to monitor text marketing campaigns performance. It incorporates a summary of SMS delivered, revenue generated, CTR, orders generated, ROI, etc. Get a simple yet stunning designed Dashboard To Monitor SMS Marketing Weekly Performance In Depth Overview Of Mass Rules Pdf It is the best one to establish the tone in your meetings. It is an excellent way to make your presentations highly effective. So, download this PPT today from Slidegeeks and see the positive impacts. Our easy-to-edit Dashboard To Monitor SMS Marketing Weekly Performance In Depth Overview Of Mass Rules Pdf can be your go-to option for all upcoming conferences and meetings. So, what are you waiting for Grab this template today. This slide presents a graphical representation of data that enables managers to monitor text marketing campaigns performance. It incorporates a summary of SMS delivered, revenue generated, CTR, orders generated, ROI, etc.
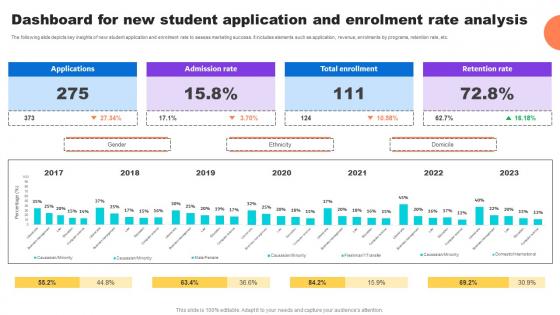
Dashboard For New Student Application And Enrolment Key Step To Implementation University Strategy SS V
The following slide depicts key insights of new student application and enrolment rate to assess marketing success. It includes elements such as application, revenue, enrolments by programs, retention rate, etc.Crafting an eye-catching presentation has never been more straightforward. Let your presentation shine with this tasteful yet straightforward Dashboard For New Student Application And Enrolment Key Step To Implementation University Strategy SS V template. It offers a minimalistic and classy look that is great for making a statement. The colors have been employed intelligently to add a bit of playfulness while still remaining professional. Construct the ideal Dashboard For New Student Application And Enrolment Key Step To Implementation University Strategy SS V that effortlessly grabs the attention of your audience Begin now and be certain to wow your customers The following slide depicts key insights of new student application and enrolment rate to assess marketing success. It includes elements such as application, revenue, enrolments by programs, retention rate, etc.
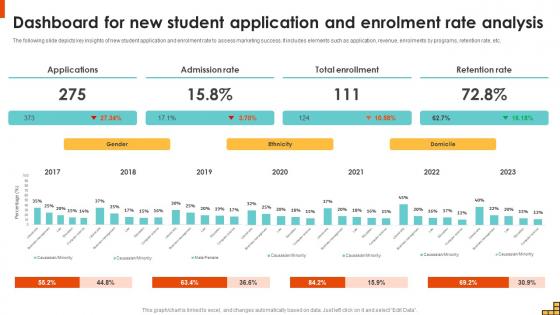
Dashboard For New Student Application And Enrolment Running Marketing Campaigns Strategy SS V
The following slide depicts key insights of new student application and enrolment rate to assess marketing success. It includes elements such as application, revenue, enrolments by programs, retention rate, etc. Crafting an eye-catching presentation has never been more straightforward. Let your presentation shine with this tasteful yet straightforward Dashboard For New Student Application And Enrolment Running Marketing Campaigns Strategy SS V template. It offers a minimalistic and classy look that is great for making a statement. The colors have been employed intelligently to add a bit of playfulness while still remaining professional. Construct the ideal Dashboard For New Student Application And Enrolment Running Marketing Campaigns Strategy SS V that effortlessly grabs the attention of your audience Begin now and be certain to wow your customers The following slide depicts key insights of new student application and enrolment rate to assess marketing success. It includes elements such as application, revenue, enrolments by programs, retention rate, etc.
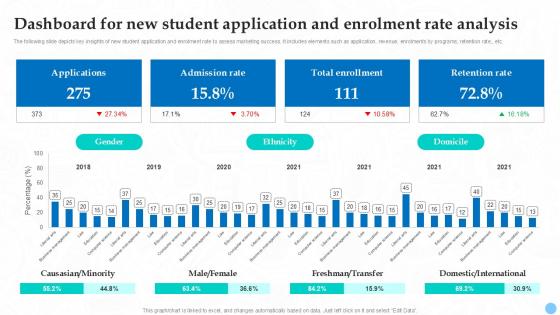
Dashboard For New Student Application Higher Education Ppt Sample Strategy SS V
The following slide depicts key insights of new student application and enrolment rate to assess marketing success. It includes elements such as application, revenue, enrolments by programs, retention rate, etc. Crafting an eye-catching presentation has never been more straightforward. Let your presentation shine with this tasteful yet straightforward Dashboard For New Student Application Higher Education Ppt Sample Strategy SS V template. It offers a minimalistic and classy look that is great for making a statement. The colors have been employed intelligently to add a bit of playfulness while still remaining professional. Construct the ideal Dashboard For New Student Application Higher Education Ppt Sample Strategy SS V that effortlessly grabs the attention of your audience Begin now and be certain to wow your customers The following slide depicts key insights of new student application and enrolment rate to assess marketing success. It includes elements such as application, revenue, enrolments by programs, retention rate, etc.
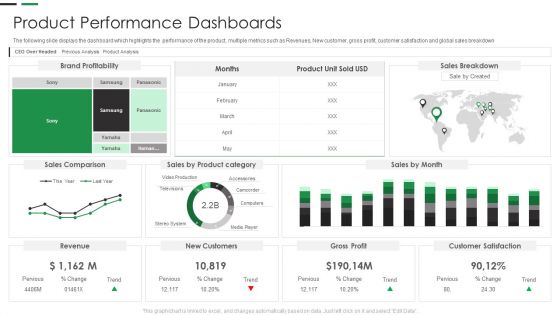
Evaluating New Commodity Impact On Market Product Performance Dashboards Template PDF
The following slide displays the dashboard which highlights the performance of the product, multiple metrics such as Revenues, New customer, gross profit, customer satisfaction and global sales breakdown Deliver and pitch your topic in the best possible manner with this Evaluating New Commodity Impact On Market Product Performance Dashboards Template PDF Use them to share invaluable insights on Brand Profitability, Customer Satisfaction, Gross Profit and impress your audience. This template can be altered and modified as per your expectations. So, grab it now.
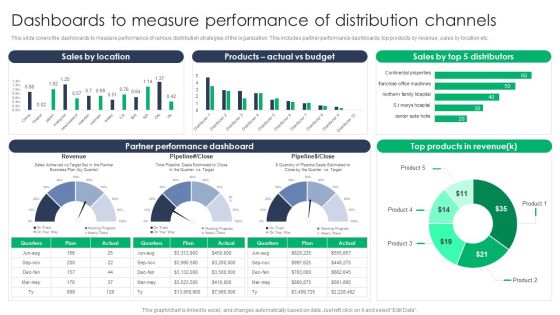
Criterion For Choosing Distribution Channel For Efficient Sales Administration Dashboards To Measure Performance Of Distribution Formats PDF
This slide covers the dashboards to measure performance of various distribution strategies of the organization. This includes partner performance dashboards, top products by revenue, sales by location etc. From laying roadmaps to briefing everything in detail, our templates are perfect for you. You can set the stage with your presentation slides. All you have to do is download these easy-to-edit and customizable templates. Criterion For Choosing Distribution Channel For Efficient Sales Administration Dashboards To Measure Performance Of Distribution Formats PDF will help you deliver an outstanding performance that everyone would remember and praise you for. Do download this presentation today.
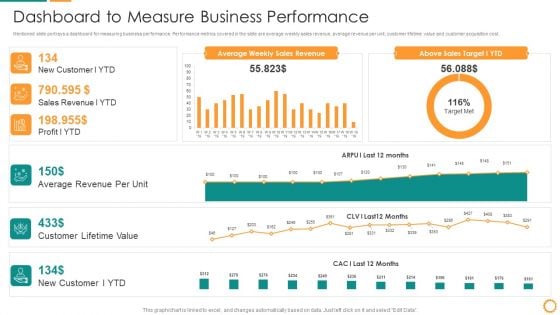
IT Consolidation Post Mergers And Acquisition Dashboard To Measure Business Performance Clipart PDF
Mentioned slide portrays a dashboard for measuring business performance. Performance metrics covered in the slide are average weekly sales revenue, average revenue per unit, customer lifetime value and customer acquisition cost. Deliver and pitch your topic in the best possible manner with this IT Consolidation Post Mergers And Acquisition Dashboard To Measure Business Performance Clipart PDF. Use them to share invaluable insights on Average Revenue, Customer Lifetime Value, Sales Revenue, Sales Target and impress your audience. This template can be altered and modified as per your expectations. So, grab it now.
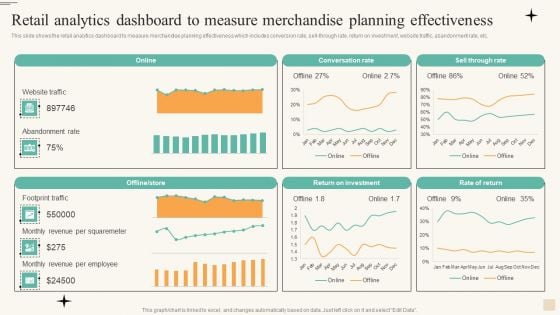
Retail Analytics Dashboard To Measure Merchandise Planning Effectiveness Microsoft PDF
This slide shows the retail analytics dashboard to measure merchandise planning effectiveness which includes conversion rate, sell through rate, return on investment, website traffic, abandonment rate, etc. Make sure to capture your audiences attention in your business displays with our gratis customizable Retail Analytics Dashboard To Measure Merchandise Planning Effectiveness Microsoft PDF. These are great for business strategies, office conferences, capital raising or task suggestions. If you desire to acquire more customers for your tech business and ensure they stay satisfied, create your own sales presentation with these plain slides.
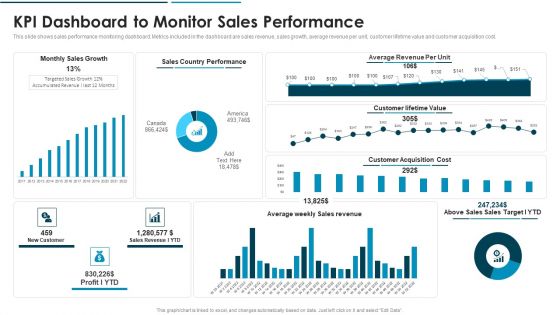
Go To Market Approach For New Product KPI Dashboard To Monitor Sales Performance Clipart PDF
This slide shows sales performance monitoring dashboard. Metrics included in the dashboard are sales revenue, sales growth, average revenue per unit, customer lifetime value and customer acquisition cost.Deliver and pitch your topic in the best possible manner with this Go To Market Approach For New Product KPI Dashboard To Monitor Sales Performance Clipart PDF Use them to share invaluable insights on Kpi Dashboard To Monitor Sales Performance and impress your audience. This template can be altered and modified as per your expectations. So, grab it now.
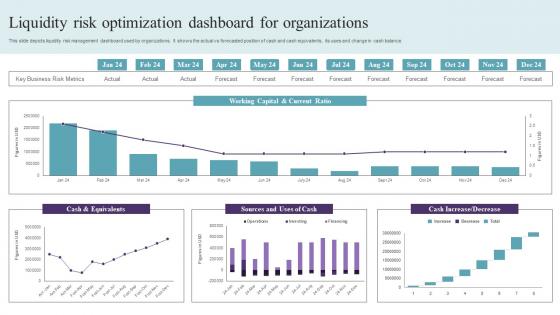
Liquidity Risk Optimization Dashboard For Organizations Graphics Pdf
This slide depicts liquidity risk management dashboard used by organizations. It shows the actual vs forecasted position of cash and cash equivalents, its uses and change in cash balance. Pitch your topic with ease and precision using this Liquidity Risk Optimization Dashboard For Organizations Graphics Pdf. This layout presents information on Cash And Equivalents, Working Capital, Current Ratio. It is also available for immediate download and adjustment. So, changes can be made in the color, design, graphics or any other component to create a unique layout. This slide depicts liquidity risk management dashboard used by organizations. It shows the actual vs forecasted position of cash and cash equivalents, its uses and change in cash balance.
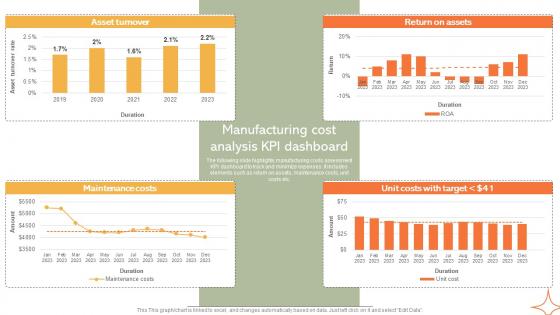
Manufacturing Cost Analysis KPI Dashboard Implementing Manufacturing Strategy SS V
The following slide highlights manufacturing costs assessment KPI dashboard to track and minimize expenses. It includes elements such as return on assets, maintenance costs, unit costs etc. Make sure to capture your audiences attention in your business displays with our gratis customizable Manufacturing Cost Analysis KPI Dashboard Implementing Manufacturing Strategy SS V. These are great for business strategies, office conferences, capital raising or task suggestions. If you desire to acquire more customers for your tech business and ensure they stay satisfied, create your own sales presentation with these plain slides. The following slide highlights manufacturing costs assessment KPI dashboard to track and minimize expenses. It includes elements such as return on assets, maintenance costs, unit costs etc.
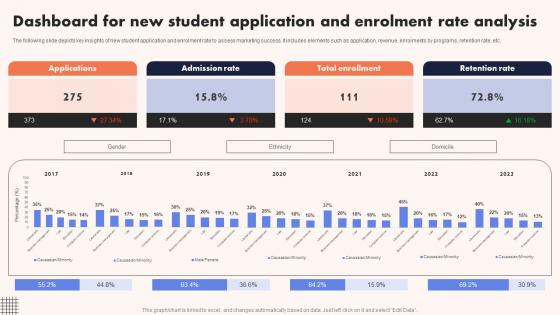
University Marketing Guide Dashboard For New Student Application And Enrolment Strategy SS V
The following slide depicts key insights of new student application and enrolment rate to assess marketing success. It includes elements such as application, revenue, enrolments by programs, retention rate, etc. Coming up with a presentation necessitates that the majority of the effort goes into the content and the message you intend to convey. The visuals of a PowerPoint presentation can only be effective if it supplements and supports the story that is being told. Keeping this in mind our experts created University Marketing Guide Dashboard For New Student Application And Enrolment Strategy SS V to reduce the time that goes into designing the presentation. This way, you can concentrate on the message while our designers take care of providing you with the right template for the situation. The following slide depicts key insights of new student application and enrolment rate to assess marketing success. It includes elements such as application, revenue, enrolments by programs, retention rate, etc.
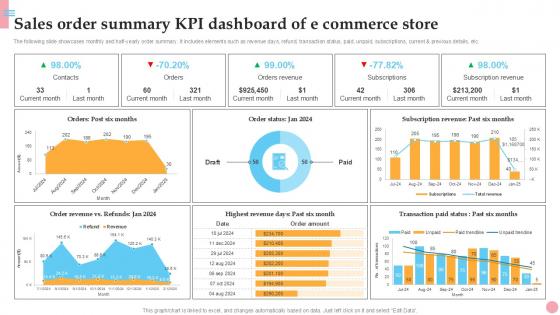
Sales Order Summary KPI Dashboard How To Improve Company PPT Sample Strategy SS V
The following slide showcases monthly and half-yearly order summary. It includes elements such as revenue days, refund, transaction status, paid, unpaid, subscriptions, current and previous details, etc. Do you know about Slidesgeeks Sales Order Summary KPI Dashboard How To Improve Company PPT Sample Strategy SS V These are perfect for delivering any kind od presentation. Using it, create PowerPoint presentations that communicate your ideas and engage audiences. Save time and effort by using our pre-designed presentation templates that are perfect for a wide range of topic. Our vast selection of designs covers a range of styles, from creative to business, and are all highly customizable and easy to edit. Download as a PowerPoint template or use them as Google Slides themes. The following slide showcases monthly and half-yearly order summary. It includes elements such as revenue days, refund, transaction status, paid, unpaid, subscriptions, current and previous details, etc.
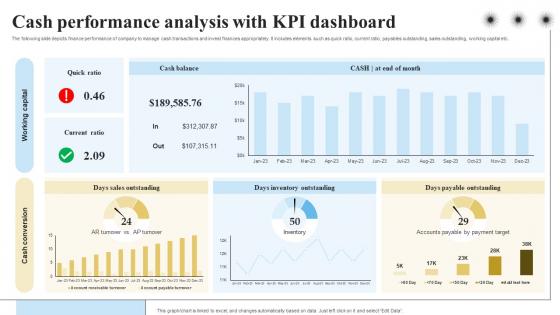
Cash Performance Analysis With KPI Dashboard Objectives And Key Result Methodology For Business
The following slide depicts finance performance of company to manage cash transactions and invest finances appropriately. It includes elements such as quick ratio, current ratio, payables outstanding, sales outstanding, working capital etc. Do you have to make sure that everyone on your team knows about any specific topic I yes, then you should give Cash Performance Analysis With KPI Dashboard Objectives And Key Result Methodology For Business a try. Our experts have put a lot of knowledge and effort into creating this impeccable Cash Performance Analysis With KPI Dashboard Objectives And Key Result Methodology For Business. You can use this template for your upcoming presentations, as the slides are perfect to represent even the tiniest detail. You can download these templates from the Slidegeeks website and these are easy to edit. So grab these today The following slide depicts finance performance of company to manage cash transactions and invest finances appropriately. It includes elements such as quick ratio, current ratio, payables outstanding, sales outstanding, working capital etc.
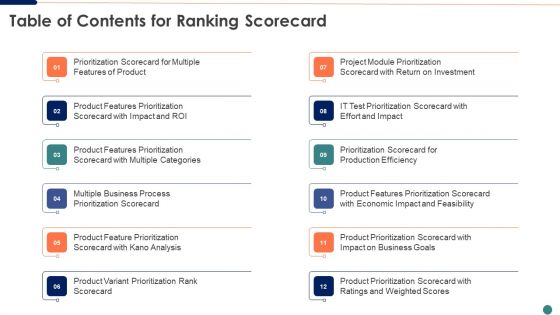
Table Of Contents For Ranking Scorecard Professional PDF
Deliver an awe inspiring pitch with this creative table of contents for ranking scorecard professional pdf bundle. Topics like product features prioritization scorecard with economic impact and feasibility, project module prioritization scorecard with return on investment, multiple business process prioritization scorecard can be discussed with this completely editable template. It is available for immediate download depending on the needs and requirements of the user.
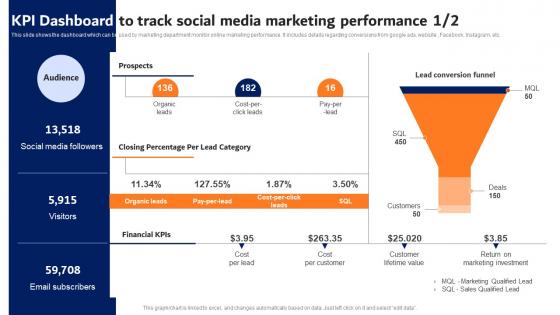
Digital Advertising Strategies KPI Dashboard To Track Social Media Infographics Pdf
This slide shows the dashboard which can be used by marketing department monitor online marketing performance. It includes details regarding conversions from google ads, website , Facebook, Instagram, etc. Make sure to capture your audiences attention in your business displays with our gratis customizable Digital Advertising Strategies KPI Dashboard To Track Social Media Infographics Pdf. These are great for business strategies, office conferences, capital raising or task suggestions. If you desire to acquire more customers for your tech business and ensure they stay satisfied, create your own sales presentation with these plain slides. This slide shows the dashboard which can be used by marketing department monitor online marketing performance. It includes details regarding conversions from google ads, website , Facebook, Instagram, etc.
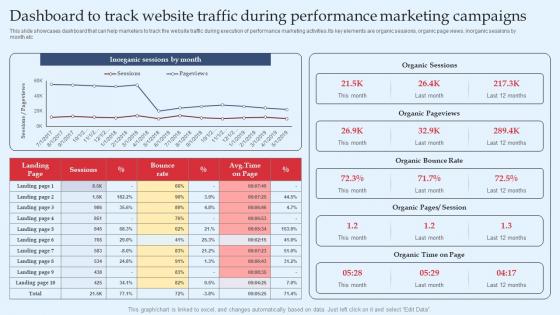
Strategic Performance Marketing Campaign Dashboard To Track Website Traffic During Clipart Pdf
This slide showcases dashboard that can help marketers to track the website traffic during execution of performance marketing activities.Its key elements are organic sessions, organic page views, inorganic sessions by month etc. Make sure to capture your audiences attention in your business displays with our gratis customizable Strategic Performance Marketing Campaign Dashboard To Track Website Traffic During Clipart Pdf. These are great for business strategies, office conferences, capital raising or task suggestions. If you desire to acquire more customers for your tech business and ensure they stay satisfied, create your own sales presentation with these plain slides. This slide showcases dashboard that can help marketers to track the website traffic during execution of performance marketing activities.Its key elements are organic sessions, organic page views, inorganic sessions by month etc.
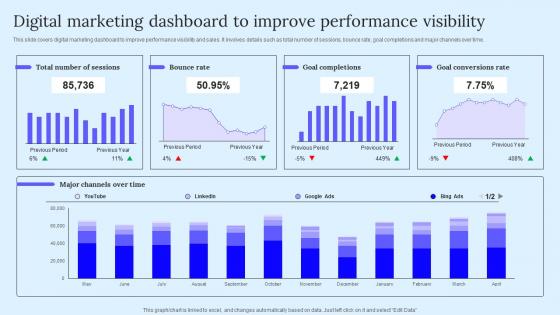
Digital Marketing Dashboard B2B Marketing Techniques To Attract Potential Background Pdf
This slide covers digital marketing dashboard to improve performance visibility and sales. It involves details such as total number of sessions, bounce rate, goal completions and major channels over time. Make sure to capture your audiences attention in your business displays with our gratis customizable Digital Marketing Dashboard B2B Marketing Techniques To Attract Potential Background Pdf. These are great for business strategies, office conferences, capital raising or task suggestions. If you desire to acquire more customers for your tech business and ensure they stay satisfied, create your own sales presentation with these plain slides. This slide covers digital marketing dashboard to improve performance visibility and sales. It involves details such as total number of sessions, bounce rate, goal completions and major channels over time.
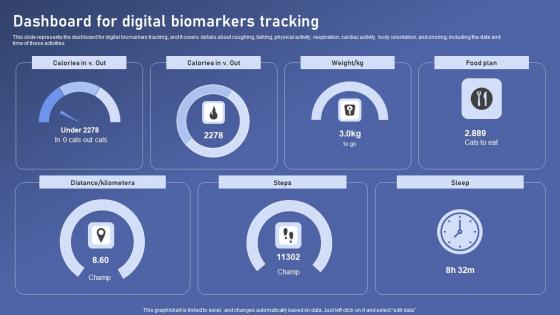
Dashboard For Digital Biomarkers Biomedical Data Science And Health Informatics Slides Pdf
This slide represents the dashboard for digital biomarkers tracking, and it covers details about coughing, talking, physical activity, respiration, cardiac activity, body orientation, and snoring, including the date and time of these activities Make sure to capture your audiences attention in your business displays with our gratis customizable Dashboard For Digital Biomarkers Biomedical Data Science And Health Informatics Slides Pdf. These are great for business strategies, office conferences, capital raising or task suggestions. If you desire to acquire more customers for your tech business and ensure they stay satisfied, create your own sales presentation with these plain slides. This slide represents the dashboard for digital biomarkers tracking, and it covers details about coughing, talking, physical activity, respiration, cardiac activity, body orientation, and snoring, including the date and time of these activities
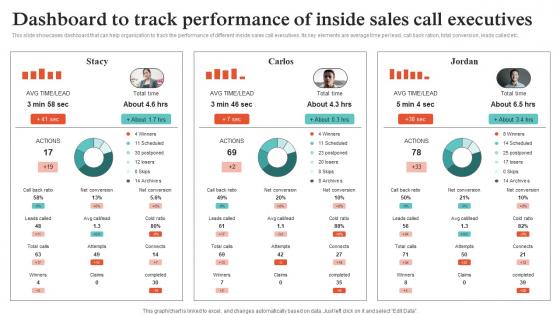
Virtual Sales Strategies For Business Dashboard To Track Performance Of Inside Strategy SS V
This slide showcases dashboard that can help organization to track the performance of different inside sales call executives. Its key elements are average time per lead, call back ration, total conversion, leads called etc. Make sure to capture your audiences attention in your business displays with our gratis customizable Virtual Sales Strategies For Business Dashboard To Track Performance Of Inside Strategy SS V. These are great for business strategies, office conferences, capital raising or task suggestions. If you desire to acquire more customers for your tech business and ensure they stay satisfied, create your own sales presentation with these plain slides. This slide showcases dashboard that can help organization to track the performance of different inside sales call executives. Its key elements are average time per lead, call back ration, total conversion, leads called etc.
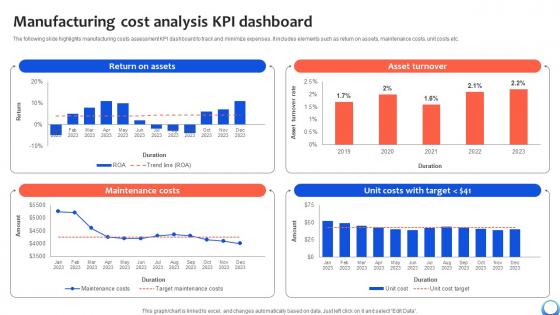
Manufacturing Cost Analysis KPI Dashboard Automating Production Process Strategy SS V
The following slide highlights manufacturing costs assessment KPI dashboard to track and minimize expenses. It includes elements such as return on assets, maintenance costs, unit costs etc. Make sure to capture your audiences attention in your business displays with our gratis customizable Manufacturing Cost Analysis KPI Dashboard Automating Production Process Strategy SS V. These are great for business strategies, office conferences, capital raising or task suggestions. If you desire to acquire more customers for your tech business and ensure they stay satisfied, create your own sales presentation with these plain slides. The following slide highlights manufacturing costs assessment KPI dashboard to track and minimize expenses. It includes elements such as return on assets, maintenance costs, unit costs etc.
Measuring Beakers Ppt 11
Measuring Beakers PPT 11-These high quality powerpoint pre-designed slides and powerpoint templates have been carefully created by our professional team to help you impress your audience. All slides have been created and are 100% editable in powerpoint. Each and every property of any graphic - color, size, orientation, shading, outline etc. can be modified to help you build an effective powerpoint presentation. Any text can be entered at any point in the powerpoint template or slide. Simply DOWNLOAD, TYPE and PRESENT!-These PowerPoint slides can be used for themes relating to--Acid, beaker, bottle, chemical, chemistry, container, equipment, experiment, flask, glass, glassware, graduated, laboratory, measurement, medical, medicine, object, pharmacy, reagent, research, science, scientific, single, test, toxic, transparent, volume, yellow Restore faith with our Measuring Beakers Ppt 11. Download without worries with our money back guaranteee.
Measuring Beakers Ppt 14
Measuring Beakers PPT 14-These high quality powerpoint pre-designed slides and powerpoint templates have been carefully created by our professional team to help you impress your audience. All slides have been created and are 100% editable in powerpoint. Each and every property of any graphic - color, size, orientation, shading, outline etc. can be modified to help you build an effective powerpoint presentation. Any text can be entered at any point in the powerpoint template or slide. Simply DOWNLOAD, TYPE and PRESENT!-These PowerPoint slides can be used for themes relating to--Acid, beaker, bottle, chemical, chemistry, container, equipment, experiment, flask, glass, glassware, graduated, laboratory, measurement, medical, medicine, object, pharmacy, reagent, research, science, scientific, single, test, toxic, transparent, volume, yellow Succeed admirably with our Measuring Beakers Ppt 14. Download without worries with our money back guaranteee.
Measuring Beakers Ppt 15
Measuring Beakers PPT 15-These high quality powerpoint pre-designed slides and powerpoint templates have been carefully created by our professional team to help you impress your audience. All slides have been created and are 100% editable in powerpoint. Each and every property of any graphic - color, size, orientation, shading, outline etc. can be modified to help you build an effective powerpoint presentation. Any text can be entered at any point in the powerpoint template or slide. Simply DOWNLOAD, TYPE and PRESENT!-These PowerPoint slides can be used for themes relating to--Acid, beaker, bottle, chemical, chemistry, container, equipment, experiment, flask, glass, glassware, graduated, laboratory, measurement, medical, medicine, object, pharmacy, reagent, research, science, scientific, single, test, toxic, transparent, volume, yellow Forge ahead with our Measuring Beakers Ppt 15. Download without worries with our money back guaranteee.
Commodity Category Analysis Product Management KPI Sales Metrics Professional PDF
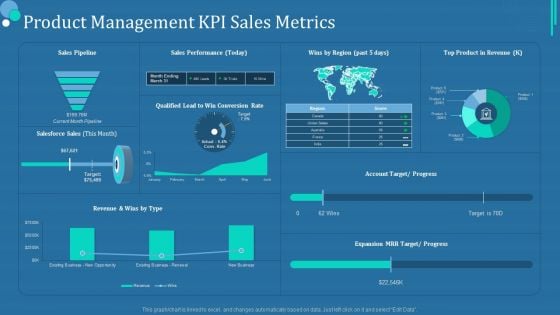
Deliver an awe inspiring pitch with this creative commodity category analysis product management kpi sales metrics professional pdf bundle. Topics like sales performance, top product in revenue, account target or progress can be discussed with this completely editable template. It is available for immediate download depending on the needs and requirements of the user.

Types Of Data Monitored In Product Analytics Product Analytics Implementation Data Analytics V
This slide outlines major categories of data tracked using product analytics aimed at improving performance to increase business revenue. It covers categories such as event tracking as well as properties Are you searching for a Types Of Data Monitored In Product Analytics Product Analytics Implementation Data Analytics V that is uncluttered, straightforward, and original Its easy to edit, and you can change the colors to suit your personal or business branding. For a presentation that expresses how much effort you have put in, this template is ideal With all of its features, including tables, diagrams, statistics, and lists, its perfect for a business plan presentation. Make your ideas more appealing with these professional slides. Download Types Of Data Monitored In Product Analytics Product Analytics Implementation Data Analytics V from Slidegeeks today. This slide outlines major categories of data tracked using product analytics aimed at improving performance to increase business revenue. It covers categories such as event tracking as well as properties
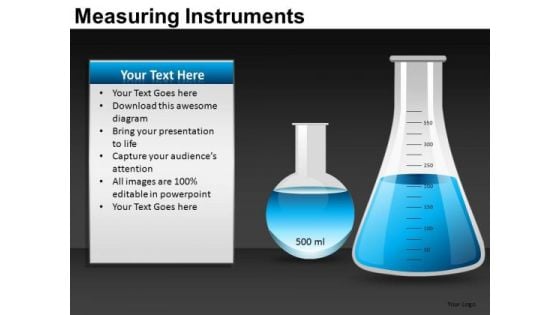
Measuring Instruments Ppt 6
Measuring Instruments PPT 6-These high quality powerpoint pre-designed slides and powerpoint templates have been carefully created by our professional team to help you impress your audience. All slides have been created and are 100% editable in powerpoint. Each and every property of any graphic - color, size, orientation, shading, outline etc. can be modified to help you build an effective powerpoint presentation. Any text can be entered at any point in the powerpoint template or slide. Simply DOWNLOAD, TYPE and PRESENT!-These PowerPoint slides can be used for themes relating to--Ampule, background, bandage, blister, blue, capsule, care, chrome, clamp, close-up, collection, emergency, equipment, forceps, glass, green, health, healthcare, healthcare and medicine, hospital, illness, instrument, mask, medical, medical instrument, medical supplies, medicament, medicine, metal, metallic, nobody, object, operation, pharmacy, pill, pincers, preparats, protective mask, rescue, scissors, stainless, steel, surgery, surgical, tablets, taking medicine, tool, tweezers, white, yellow Oversee plans with our Measuring Instruments Ppt 6. Download without worries with our money back guaranteee.


 Continue with Email

 Home
Home


