Financial Metrics
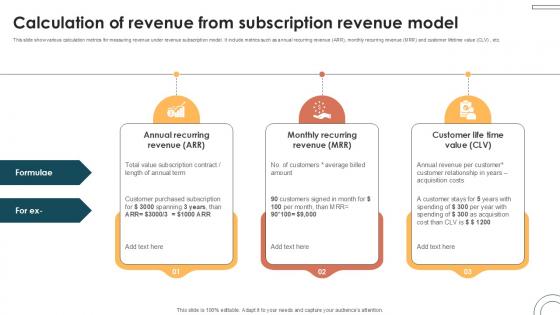
Calculation Of Revenue From Subscription Internet Based Trade Structure Ppt Example
This slide show various calculation metrics for measuring revenue under revenue subscription model. It include metrics such as annual recurring revenue ARR, monthly recurring revenue MRR and customer lifetime value CLV , etc. Get a simple yet stunning designed Calculation Of Revenue From Subscription Internet Based Trade Structure Ppt Example. It is the best one to establish the tone in your meetings. It is an excellent way to make your presentations highly effective. So, download this PPT today from Slidegeeks and see the positive impacts. Our easy-to-edit Calculation Of Revenue From Subscription Internet Based Trade Structure Ppt Example can be your go-to option for all upcoming conferences and meetings. So, what are you waiting for Grab this template today. This slide show various calculation metrics for measuring revenue under revenue subscription model. It include metrics such as annual recurring revenue ARR, monthly recurring revenue MRR and customer lifetime value CLV , etc.
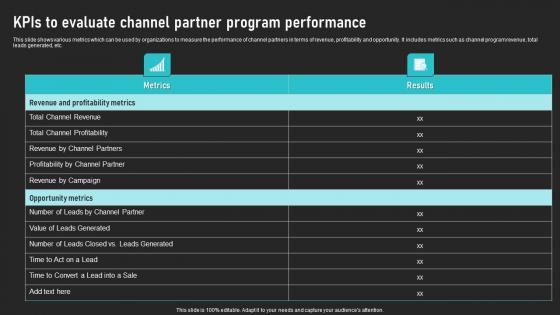
KPIS To Evaluate Channel Partner Program Performance Cooperative Sales Tactics Topics Pdf
This slide shows various metrics which can be used by organizations to measure the performance of channel partners in terms of revenue, profitability and opportunity. It includes metrics such as channel program revenue, total leads generated, etc. From laying roadmaps to briefing everything in detail, our templates are perfect for you. You can set the stage with your presentation slides. All you have to do is download these easy-to-edit and customizable templates. KPIS To Evaluate Channel Partner Program Performance Cooperative Sales Tactics Topics Pdf will help you deliver an outstanding performance that everyone would remember and praise you for. Do download this presentation today. This slide shows various metrics which can be used by organizations to measure the performance of channel partners in terms of revenue, profitability and opportunity. It includes metrics such as channel program revenue, total leads generated, etc.

Customizing The Salon Experience Examining The Current Performance Of Salon Business Kpis Strategy SS V
This slide assesses the performance of key salon metrics. It includes information about metrics such as average ticket value, sales velocity, net promoter score, occupancy rate and total revenue. Welcome to our selection of the Customizing The Salon Experience Examining The Current Performance Of Salon Business Kpis Strategy SS V. These are designed to help you showcase your creativity and bring your sphere to life. Planning and Innovation are essential for any business that is just starting out. This collection contains the designs that you need for your everyday presentations. All of our PowerPoints are 100Percent editable, so you can customize them to suit your needs. This multi-purpose template can be used in various situations. Grab these presentation templates today. This slide assesses the performance of key salon metrics. It includes information about metrics such as average ticket value, sales velocity, net promoter score, occupancy rate and total revenue.
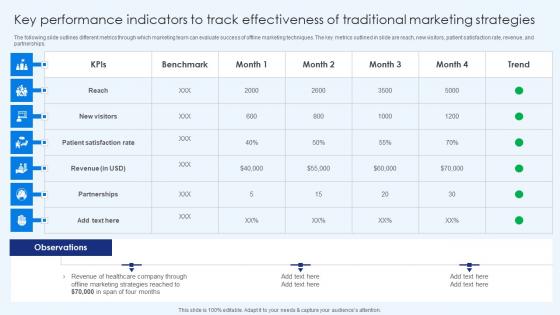
Key Performance Indicators To Track Effectivenes Healthcare Promotion Infographics Pdf
The following slide outlines different metrics through which marketing team can evaluate success of offline marketing techniques. The key metrics outlined in slide are reach, new visitors, patient satisfaction rate, revenue, and partnerships. The Key Performance Indicators To Track Effectivenes Healthcare Promotion Infographics Pdf is a compilation of the most recent design trends as a series of slides. It is suitable for any subject or industry presentation, containing attractive visuals and photo spots for businesses to clearly express their messages. This template contains a variety of slides for the user to input data, such as structures to contrast two elements, bullet points, and slides for written information. Slidegeeks is prepared to create an impression. The following slide outlines different metrics through which marketing team can evaluate success of offline marketing techniques. The key metrics outlined in slide are reach, new visitors, patient satisfaction rate, revenue, and partnerships.
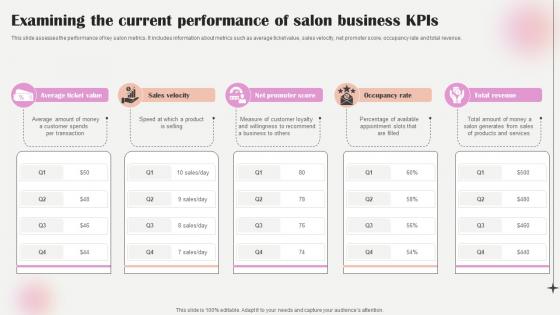
Salon Marketing Plan To Optimize Examining The Current Performance Of Salon Strategy SS V
This slide assesses the performance of key salon metrics. It includes information about metrics such as average ticket value, sales velocity, net promoter score, occupancy rate and total revenue. Are you searching for a Salon Marketing Plan To Optimize Examining The Current Performance Of Salon Strategy SS V that is uncluttered, straightforward, and original Its easy to edit, and you can change the colors to suit your personal or business branding. For a presentation that expresses how much effort you have put in, this template is ideal With all of its features, including tables, diagrams, statistics, and lists, its perfect for a business plan presentation. Make your ideas more appealing with these professional slides. Download Salon Marketing Plan To Optimize Examining The Current Performance Of Salon Strategy SS V from Slidegeeks today. This slide assesses the performance of key salon metrics. It includes information about metrics such as average ticket value, sales velocity, net promoter score, occupancy rate and total revenue.
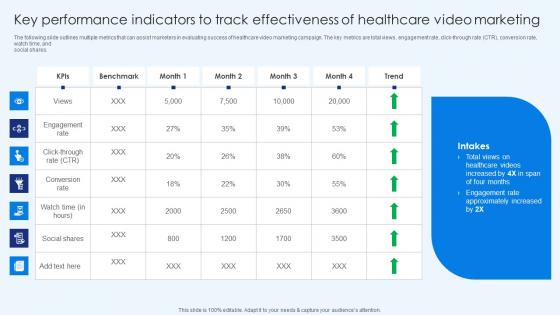
Healthcare Promotion Key Performance Indicators To Track Effectiveness Formats Pdf
The following slide outlines multiple metrics that can assist marketers in evaluating success of healthcare video marketing campaign. The key metrics are total views, engagement rate, click-through rate CTR, conversion rate, watch time, and social shares. Make sure to capture your audiences attention in your business displays with our gratis customizable Healthcare Promotion Key Performance Indicators To Track Effectiveness Formats Pdf. These are great for business strategies, office conferences, capital raising or task suggestions. If you desire to acquire more customers for your tech business and ensure they stay satisfied, create your own sales presentation with these plain slides. The following slide outlines multiple metrics that can assist marketers in evaluating success of healthcare video marketing campaign. The key metrics are total views, engagement rate, click-through rate CTR, conversion rate, watch time, and social shares.
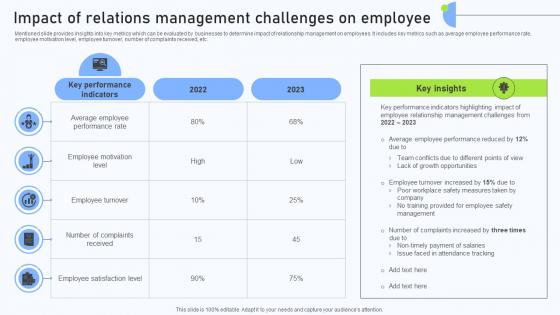
Relationship Management Automation Impact Of Relations Management Challenges
Mentioned slide provides insights into key metrics which can be evaluated by businesses to determine impact of relationship management on employees. It includes key metrics such as average employee performance rate, employee motivation level, employee turnover, number of complaints received, etc. Make sure to capture your audiences attention in your business displays with our gratis customizable Relationship Management Automation Impact Of Relations Management Challenges. These are great for business strategies, office conferences, capital raising or task suggestions. If you desire to acquire more customers for your tech business and ensure they stay satisfied, create your own sales presentation with these plain slides. Mentioned slide provides insights into key metrics which can be evaluated by businesses to determine impact of relationship management on employees. It includes key metrics such as average employee performance rate, employee motivation level, employee turnover, number of complaints received, etc.
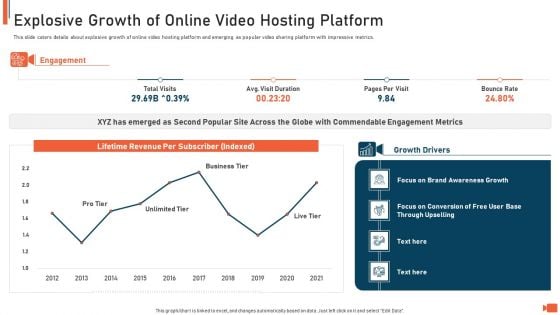
Online Video Streaming Site Capital Raising Elevator Explosive Growth Of Online Video Hosting Platform Topics PDF
This slide caters details about explosive growth of online video hosting platform and emerging as popular video sharing platform with impressive metrics. Deliver an awe inspiring pitch with this creative online video streaming site capital raising elevator explosive growth of online video hosting platform topics pdf bundle. Topics like awareness, growth, revenue, metrics can be discussed with this completely editable template. It is available for immediate download depending on the needs and requirements of the user.
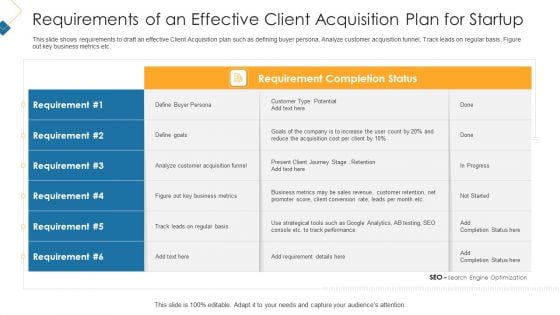
Requirements Of An Effective Client Acquisition Plan For Startup Inspiration PDF
This slide shows requirements to draft an effective Client Acquisition plan such as defining buyer persona, Analyze customer acquisition funnel, Track leads on regular basis, Figure out key business metrics etc. Deliver an awe inspiring pitch with this creative requirements of an effective client acquisition plan for startup inspiration pdf bundle. Topics like sales, revenue, business, metrics, customer can be discussed with this completely editable template. It is available for immediate download depending on the needs and requirements of the user.
Professional Scrum Master Training IT Risk Monitoring Dashboard For Software Development Projects Icons PDF
Following slide displays risk monitoring KPI dashboard that can be used by a firm to track multiple risk events. Metrics covered in the dashboard are residual risk by period and category by total risk rating. Deliver an awe inspiring pitch with this creative professional scrum master training it risk monitoring dashboard for software development projects icons pdf bundle. Topics like financial risk, people risk, governance risk, competitive risk, system or technology can be discussed with this completely editable template. It is available for immediate download depending on the needs and requirements of the user.
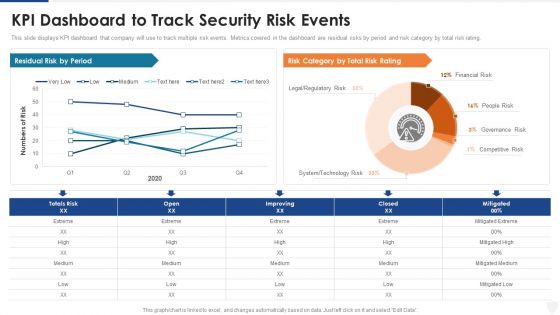
KPI Dashboard To Track Security Risk Events Ppt Pictures Deck PDF
This slide displays KPI dashboard that company will use to track multiple risk events. Metrics covered in the dashboard are residual risks by period and risk category by total risk rating. Deliver and pitch your topic in the best possible manner with this kpi dashboard to track security risk events ppt pictures deck pdf. Use them to share invaluable insights on technology risk, system, financial risk and impress your audience. This template can be altered and modified as per your expectations. So, grab it now.
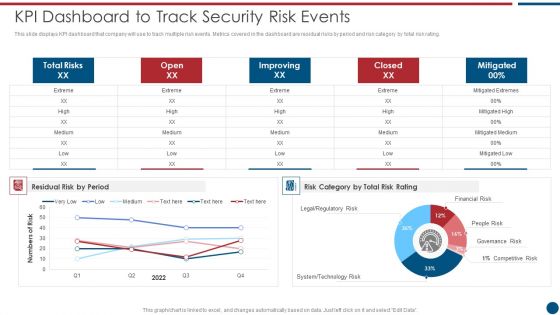
Risk Based Procedures To IT Security KPI Dashboard To Track Security Risk Events Designs PDF
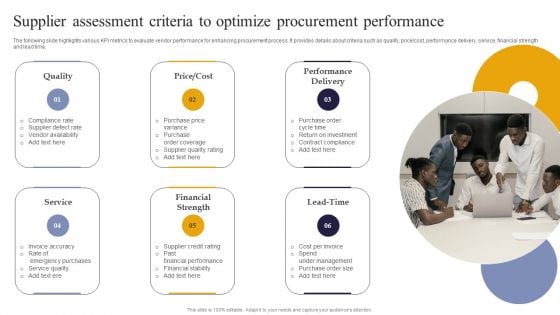
Vendor Performance Analysis And Administration Supplier Assessment Criteria To Optimize Procurement Performance Themes PDF
The following slide highlights various KPI metrics to evaluate vendor performance for enhancing procurement process. It provides details about criteria such as quality, price cost, performance delivery, service, financial strength and lead time. From laying roadmaps to briefing everything in detail, our templates are perfect for you. You can set the stage with your presentation slides. All you have to do is download these easy to edit and customizable templates. Vendor Performance Analysis And Administration Supplier Assessment Criteria To Optimize Procurement Performance Themes PDF will help you deliver an outstanding performance that everyone would remember and praise you for. Do download this presentation today.
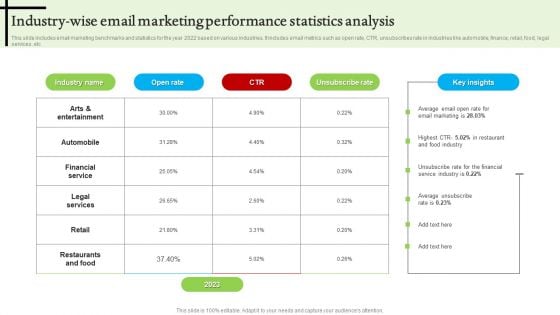
Industry Wise Email Marketing Performance Statistics Analysis Graphics PDF
This slide includes email marketing benchmarks and statistics for the year 2022 based on various industries. It includes email metrics such as open rate, CTR, unsubscribes rate in industries like automobile, finance, retail, food, legal services, etc. Pitch your topic with ease and precision using this Industry Wise Email Marketing Performance Statistics Analysis Graphics PDF. This layout presents information on Automobile, Financial Service, Legal Services. It is also available for immediate download and adjustment. So, changes can be made in the color, design, graphics or any other component to create a unique layout.
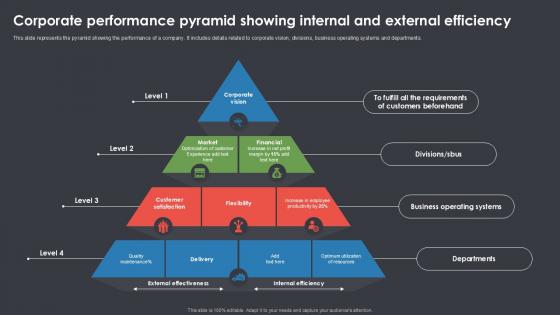
Corporate Performance Pyramid Showing Internal And External Efficiency Ppt Template SS
This slide highlights dashboard for evaluating financial performance using power bi tool. The purpose of this template is to provide managers with an efficient tool for comparing profit metrics across the quarters. It allows users to select different quarters and estimate sales of various products. Present like a pro with Corporate Performance Pyramid Showing Internal And External Efficiency Ppt Template SS Create beautiful presentations together with your team, using our easy-to-use presentation slides. Share your ideas in real-time and make changes on the fly by downloading our templates. So whether you are in the office, on the go, or in a remote location, you can stay in sync with your team and present your ideas with confidence. With Slidegeeks presentation got a whole lot easier. Grab these presentations today. This slide highlights dashboard for evaluating financial performance using power bi tool. The purpose of this template is to provide managers with an efficient tool for comparing profit metrics across the quarters. It allows users to select different quarters and estimate sales of various products.
Consumer Lead Generation Process Enhanced Lead Performance Tracking Dashboard Portrait PDF
This slide covers the KPI dashboard for tracking improved lead management system performance. It includes metrics such as visitors, social media followers, email subscribers, organic leads, etc. Slidegeeks is here to make your presentations a breeze with Consumer Lead Generation Process Enhanced Lead Performance Tracking Dashboard Portrait PDF With our easy-to-use and customizable templates, you can focus on delivering your ideas rather than worrying about formatting. With a variety of designs to choose from, youre sure to find one that suits your needs. And with animations and unique photos, illustrations, and fonts, you can make your presentation pop. So whether youre giving a sales pitch or presenting to the board, make sure to check out Slidegeeks first.
Performance Measures Ppt PowerPoint Presentation Inspiration Skills
This is a performance measures ppt powerpoint presentation inspiration skills. This is a two stage process. The stages in this process are non financial measures, financial measures, growth, business, marketing.
Performance Measures Ppt PowerPoint Presentation Slides Sample
This is a performance measures ppt powerpoint presentation slides sample. This is a two stage process. The stages in this process are financial measures, non financial measures, business, strategy.
Performance Measures Ppt PowerPoint Presentation Layouts Clipart Images
This is a performance measures ppt powerpoint presentation layouts clipart images. This is a two stage process. The stages in this process are non financial measures, financial measures, business, icons, marketing.
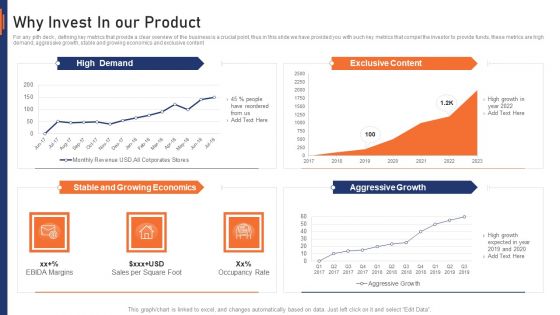
VR Market Capital Raising Elevator Pitch Deck Why Invest In Our Product Rules PDF
For any pith deck , defining key metrics that provide a clear overview of the business is a crucial point, thus in this slide we have provided you with such key metrics that compel the investor to provide funds, these metrics are high demand, aggressive growth, stable and growing economics and exclusive content. Deliver and pitch your topic in the best possible manner with this vr market capital raising elevator pitch deck why invest in our product rules pdf. Use them to share invaluable insights on high demand, stable and growing economics, aggressive growth, exclusive content and impress your audience. This template can be altered and modified as per your expectations. So, grab it now.
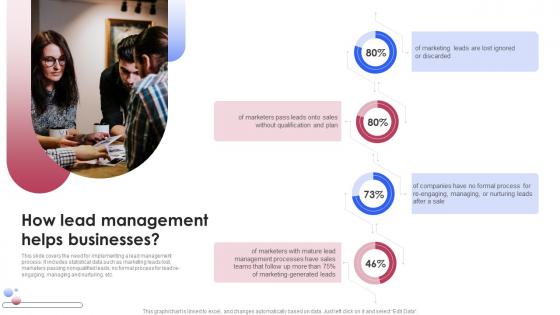
How Lead Management Helps Businesses Various Techniques For Managing Mockup PDF
This slide covers the KPI dashboard for tracking improved lead management system performance. It includes metrics such as visitors, social media followers, email subscribers, organic leads, etc. This slide covers the KPI dashboard for tracking improved lead management system performance. It includes metrics such as visitors, social media followers, email subscribers, organic leads, etc. Make sure to capture your audiences attention in your business displays with our gratis customizable How Lead Management Helps Businesses Various Techniques For Managing Mockup PDF. These are great for business strategies, office conferences, capital raising or task suggestions. If you desire to acquire more customers for your tech business and ensure they stay satisfied, create your own sales presentation with these plain slides. This slide covers the KPI dashboard for tracking improved lead management system performance. It includes metrics such as visitors, social media followers, email subscribers, organic leads, etc.
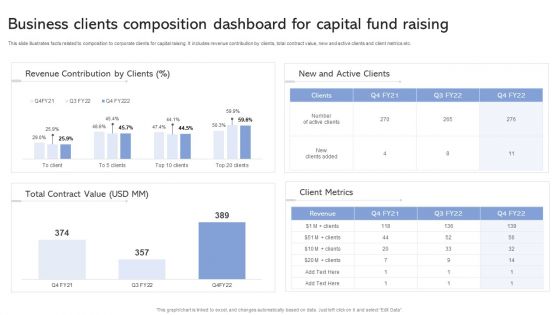
Business Clients Composition Dashboard For Capital Fund Raising Ppt Infographic Template Microsoft PDF
This slide illustrates facts related to composition to corporate clients for capital raising. It includes revenue contribution by clients, total contract value, new and active clients and client metrics etc. Showcasing this set of slides titled Business Clients Composition Dashboard For Capital Fund Raising Ppt Infographic Template Microsoft PDF. The topics addressed in these templates are Revenue Contribution Clients, Client Metrics, Total Contract Value. All the content presented in this PPT design is completely editable. Download it and make adjustments in color, background, font etc. as per your unique business setting.
Tracking Performance Through Sales Cycle Optimization KPIS Best Practices Ppt Example SA SS V
Following slide represents metrics to measure and track performance of optimization implemented by company for high revenue growth. From laying roadmaps to briefing everything in detail, our templates are perfect for you. You can set the stage with your presentation slides. All you have to do is download these easy-to-edit and customizable templates. Tracking Performance Through Sales Cycle Optimization KPIS Best Practices Ppt Example SA SS V will help you deliver an outstanding performance that everyone would remember and praise you for. Do download this presentation today. Following slide represents metrics to measure and track performance of optimization implemented by company for high revenue growth.
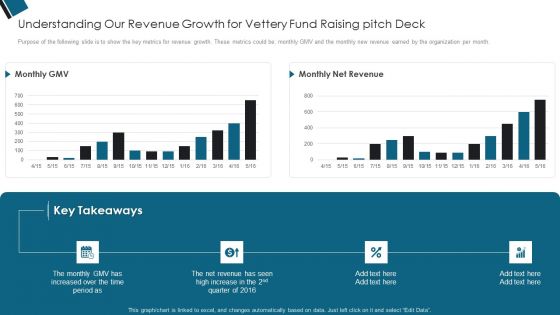
Understanding Our Revenue Growth For Vettery Fund Raising Pitch Deck Ppt PowerPoint Presentation Layouts Brochure PDF
Purpose of the following slide is to show the key metrics for revenue growth. These metrics could be monthly GMV and the monthly new revenue earned by the organization per month.Deliver and pitch your topic in the best possible manner with this Understanding Our Revenue Growth For Vettery Fund Raising Pitch Deck Ppt PowerPoint Presentation Layouts Brochure PDF Use them to share invaluable insights on Key Takeaways, Time Period, Increased Over and impress your audience. This template can be altered and modified as per your expectations. So, grab it now.
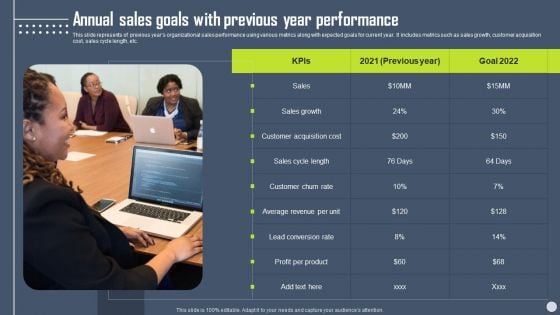
Boosting Yearly Business Revenue Annual Sales Goals With Previous Year Performance Ideas PDF
This slide represents of previous years organizational sales performance using various metrics along with expected goals for current year. It includes metrics such as sales growth, customer acquisition cost, sales cycle length, etc. If your project calls for a presentation, then Slidegeeks is your go-to partner because we have professionally designed, easy-to-edit templates that are perfect for any presentation. After downloading, you can easily edit Boosting Yearly Business Revenue Annual Sales Goals With Previous Year Performance Ideas PDF and make the changes accordingly. You can rearrange slides or fill them with different images. Check out all the handy templates.
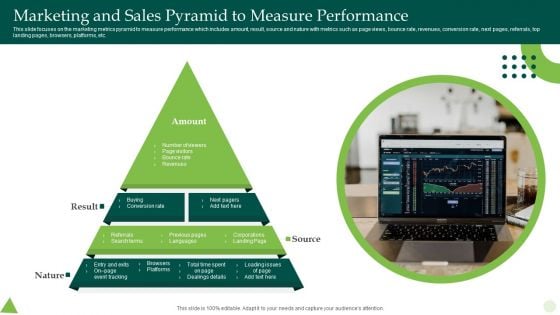
Marketing And Sales Pyramid To Measure Performance Ppt Portfolio Structure PDF
This slide focuses on the marketing metrics pyramid to measure performance which includes amount, result, source and nature with metrics such as page views, bounce rate, revenues, conversion rate, next pages, referrals, top landing pages, browsers, platforms, etc. Presenting Marketing And Sales Pyramid To Measure Performance Ppt Portfolio Structure PDF to dispense important information. This template comprises one stages. It also presents valuable insights into the topics including Amount, Bounce Rate, Revenues, Corporations. This is a completely customizable PowerPoint theme that can be put to use immediately. So, download it and address the topic impactfully.

Playbook For Sales Growth Strategies How To Measure Organic Growth Clipart PDF
Purpose of the following slide is to show multiple metrics that the organization can use to track performance of their organic growth strategies, these can be revenues generated, market penetration, increase in referral rate etc. Presenting Playbook For Sales Growth Strategies How To Measure Organic Growth Clipart PDF to provide visual cues and insights. Share and navigate important information on four stages that need your due attention. This template can be used to pitch topics like Metrics, Expected Increase, Revenues, Market Penetration. In addtion, this PPT design contains high resolution images, graphics, etc, that are easily editable and available for immediate download.
Organic Business Growth Strategies How To Measure Organic Growth Icons PDF
Purpose of the following slide is to show multiple metrics that the organization can use to track the performance of their organic growth strategies, and these can be revenues generated, market penetration, increase in referral rate etc. Deliver and pitch your topic in the best possible manner with this Organic Business Growth Strategies How To Measure Organic Growth Icons PDF. Use them to share invaluable insights on Revenues, Metrics, Market Share and impress your audience. This template can be altered and modified as per your expectations. So, grab it now.

E Mail Marketing Campaign Performance Report Analysis Designs PDF
The purpose of this slide is to showcase a measurement of e-mail marketing success rate based on certain metrics that help to improve the overall performance. Key metrics include no. of sends, delivered, opens, total clicks etc. Pitch your topic with ease and precision using this E Mail Marketing Campaign Performance Report Analysis Designs PDF. This layout presents information on Campaign Revenue, Product Launch, Performance Report Analysis. It is also available for immediate download and adjustment. So, changes can be made in the color, design, graphics or any other component to create a unique layout.
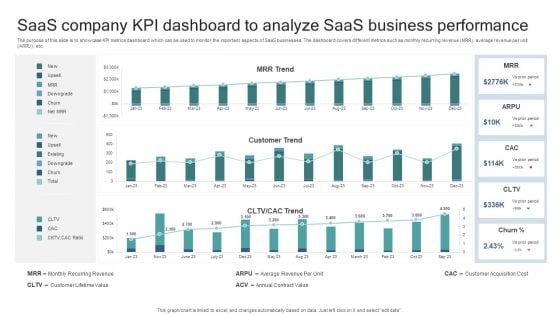
Saas Company KPI Dashboard To Analyze Saas Business Performance Elements PDF
The purpose of this slide is to showcase KPI metrics dashboard which can be used to monitor the important aspects of SaaS businesses. The dashboard covers different metrics such as monthly recurring revenue MRR, average revenue per unit ARPU, etc. Pitch your topic with ease and precision using this Saas Company KPI Dashboard To Analyze Saas Business Performance Elements PDF. This layout presents information on Monthly Recurring Revenue, Customer Lifetime Value, Average Revenue Per Unit, Annual Contract Value, Customer Acquisition Cost. It is also available for immediate download and adjustment. So, changes can be made in the color, design, graphics or any other component to create a unique layout.
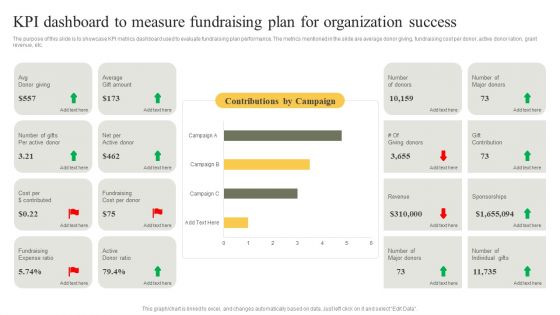
KPI Dashboard To Measure Fundraising Plan For Organization Success Infographics PDF
The purpose of this slide is to showcase KPI metrics dashboard used to evaluate fundraising plan performance. The metrics mentioned in the slide are average donor giving, fundraising cost per donor, active donor ration, grant revenue, etc. Showcasing this set of slides titled KPI Dashboard To Measure Fundraising Plan For Organization Success Infographics PDF. The topics addressed in these templates are Fundraising Cost, Average, Ratio. All the content presented in this PPT design is completely editable. Download it and make adjustments in color, background, font etc. as per your unique business setting.
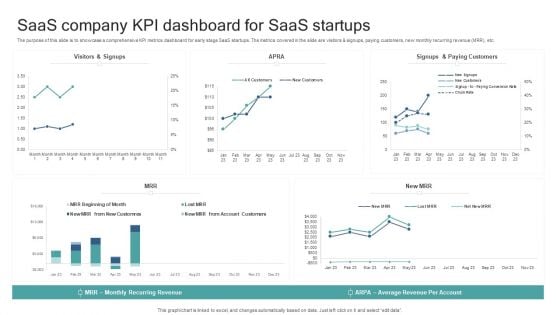
Saas Company KPI Dashboard For Saas Startups Background PDF
The purpose of this slide is to showcase a comprehensive KPI metrics dashboard for early stage SaaS startups. The metrics covered in the slide are visitors and signups, paying customers, new monthly recurring revenue MRR, etc. Showcasing this set of slides titled Saas Company KPI Dashboard For Saas Startups Background PDF. The topics addressed in these templates are Average Revenue Per Account, Monthly Recurring Revenue. All the content presented in this PPT design is completely editable. Download it and make adjustments in color, background, font etc. as per your unique business setting.
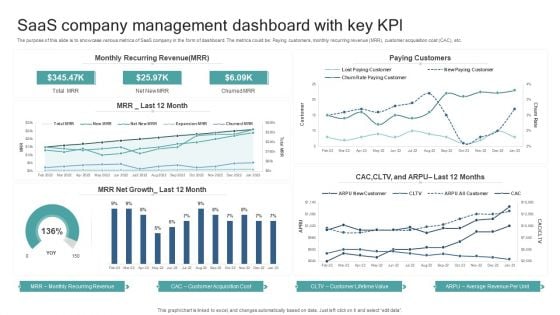
Saas Company Management Dashboard With Key Kpl Template PDF
The purpose of this slide is to showcase various metrics of SaaS company in the form of dashboard. The metrics could be, Paying customers, monthly recurring revenue MRR, customer acquisition cost CAC, etc. Showcasing this set of slides titled Saas Company Management Dashboard With Key Kpl Template PDF. The topics addressed in these templates are Monthly Recurring Revenue, Customer Acquisition Cost, Customer Lifetime Value, Average Revenue Per Unit. All the content presented in this PPT design is completely editable. Download it and make adjustments in color, background, font etc. as per your unique business setting.
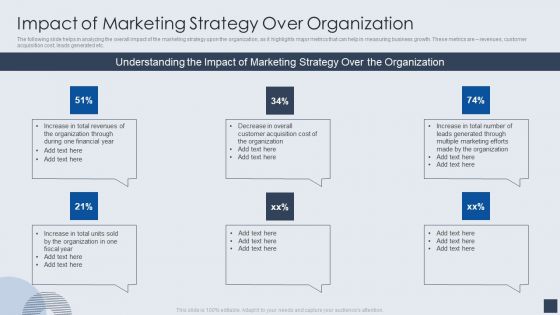
Implementing Marketing Mix Strategy To Enhance Overall Performance Impact Of Marketing Strategy Over Organization Demonstration PDF
The following slide helps in analyzing the overall impact of the marketing strategy upon the organization, as it highlights major metrics that can help in measuring business growth. These metrics are revenues, customer acquisition cost, leads generated etc. This is a Implementing Marketing Mix Strategy To Enhance Overall Performance Impact Of Marketing Strategy Over Organization Demonstration PDF template with various stages. Focus and dispense information on six stages using this creative set, that comes with editable features. It contains large content boxes to add your information on topics like Organization, Revenues, Customer Acquisition. You can also showcase facts, figures, and other relevant content using this PPT layout. Grab it now.
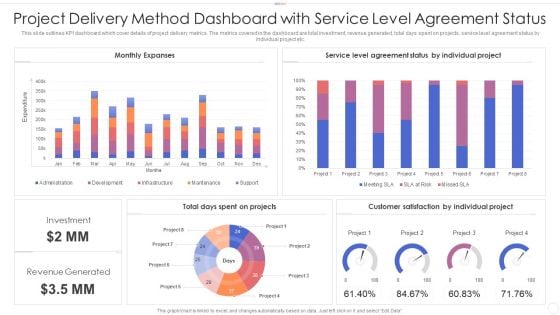
Project Delivery Method Dashboard With Service Level Agreement Status Clipart PDF
This slide outlines KPI dashboard which cover details of project delivery metrics. The metrics covered in the dashboard are total investment, revenue generated, total days spent on projects, service level agreement status by individual project etc. Pitch your topic with ease and precision using this project delivery method dashboard with service level agreement status clipart pdf. This layout presents information on project delivery method dashboard with service level agreement status. It is also available for immediate download and adjustment. So, changes can be made in the color, design, graphics or any other component to create a unique layout.
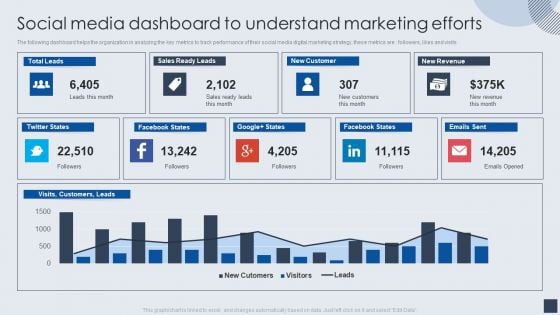
Implementing Marketing Mix Strategy To Enhance Overall Performance Social Media Dashboard To Understand Marketing Efforts Guidelines PDF
The following dashboard helps the organization in analyzing the key metrics to track performance of their social media digital marketing strategy, these metrics are followers, likes and visits. Deliver and pitch your topic in the best possible manner with this Implementing Marketing Mix Strategy To Enhance Overall Performance Social Media Dashboard To Understand Marketing Efforts Guidelines PDF. Use them to share invaluable insights on Sales, New Customer, New Revenue and impress your audience. This template can be altered and modified as per your expectations. So, grab it now.
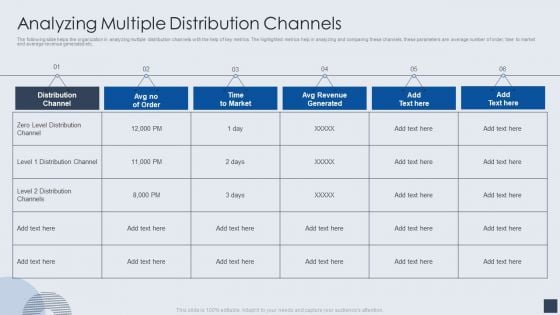
Implementing Marketing Mix Strategy To Enhance Overall Performance Analyzing Multiple Distribution Channels Brochure PDF
The following slide helps the organization in analyzing multiple distribution channels with the help of key metrics. The highlighted metrics help in analyzing and comparing these channels, these parameters are average number of order, time to market and average revenue generated etc. Deliver and pitch your topic in the best possible manner with this Implementing Marketing Mix Strategy To Enhance Overall Performance Analyzing Multiple Distribution Channels Brochure PDF. Use them to share invaluable insights on Analyzing Multiple, Distribution Channels and impress your audience. This template can be altered and modified as per your expectations. So, grab it now.
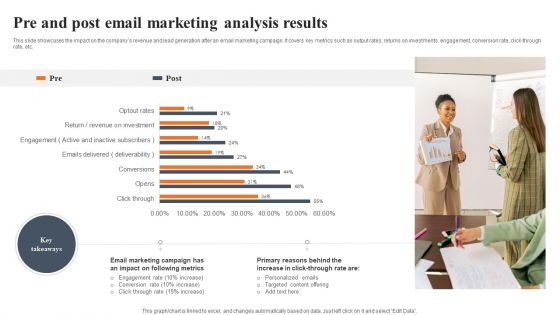
Pre And Post Email Marketing Analysis Results Slides PDF
This slide showcases the impact on the companys revenue and lead generation after an email marketing campaign. It covers key metrics such as output rates, returns on investments, engagement, conversion rate, click through rate, etc. Pitch your topic with ease and precision using this Pre And Post Email Marketing Analysis Results Slides PDF. This layout presents information on Email Marketing Campaign, Following Metrics, Targeted Content Offering. It is also available for immediate download and adjustment. So, changes can be made in the color, design, graphics or any other component to create a unique layout.
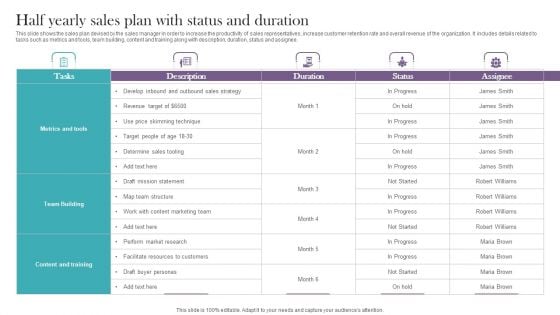
Half Yearly Sales Plan With Status And Duration Download PDF
This slide shows the sales plan devised by the sales manager in order to increase the productivity of sales representatives, increase customer retention rate and overall revenue of the organization. It includes details related to tasks such as metrics and tools, team building, content and training along with description, duration, status and assignee. Showcasing this set of slides titled Half Yearly Sales Plan With Status And Duration Download PDF. The topics addressed in these templates are Metrics And Tools, Team Building, Content And Training. All the content presented in this PPT design is completely editable. Download it and make adjustments in color, background, font etc. as per your unique business setting.
Benchmark Criteria For Various Saas Company KPI Guidelines PDF
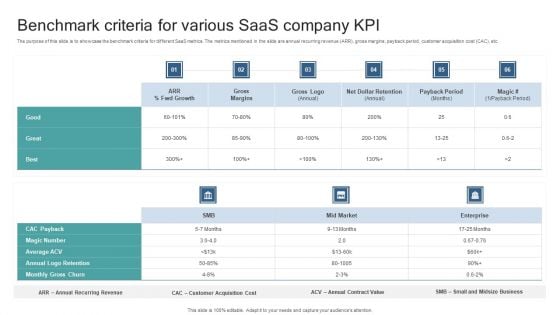
The purpose of this slide is to showcase the benchmark criteria for different SaaS metrics. The metrics mentioned in the slide are annual recurring revenue ARR, gross margins, payback period, customer acquisition cost CAC, etc. Showcasing this set of slides titled Benchmark Criteria For Various Saas Company KPI Guidelines PDF. The topics addressed in these templates are Net Dollar Retention, Payback Period, Gross Logo, Gross Margins. All the content presented in this PPT design is completely editable. Download it and make adjustments in color, background, font etc. as per your unique business setting.
Comparative Analysis Of Sales And Income Enablement Elements PDF
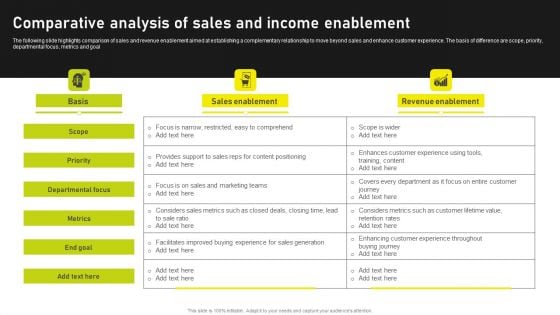
The following slide highlights comparison of sales and revenue enablement aimed at establishing a complementary relationship to move beyond sales and enhance customer experience. The basis of difference are scope, priority, departmental focus, metrics and goal. Showcasing this set of slides titled Comparative Analysis Of Sales And Income Enablement Elements PDF. The topics addressed in these templates are Metrics, Goal, Sales Enablement. All the content presented in this PPT design is completely editable. Download it and make adjustments in color, background, font etc. as per your unique business setting.
Working Capital Cycle Diagram Presentation Examples
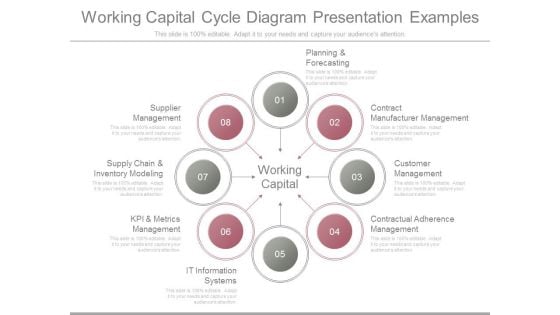
This is a working capital cycle diagram presentation examples. This is a eight stage process. The stages in this process are planning and forecasting, contract manufacturer management, customer management, contractual adherence management, it information systems, kpi and metrics management, supply chain and inventory modeling, supplier management.
Customer Success Model With Organizational Capabilities Ppt PowerPoint Presentation Icon Elements PDF
Pitch your topic with ease and precision using this customer success model with organizational capabilities ppt powerpoint presentation icon elements pdf. This layout presents information on effective adoption, prescriptive engagement, economics metrics and scalable funding. It is also available for immediate download and adjustment. So, changes can be made in the color, design, graphics or any other component to create a unique layout.
Business Activities Assessment Examples Content Professional PDF
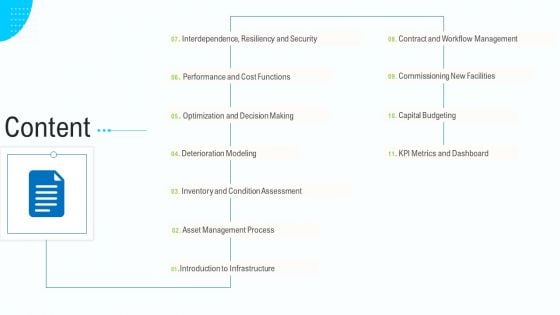
Deliver an awe inspiring pitch with this creative business activities assessment examples content professional pdf bundle. Topics like contract and workflow management, commissioning new facilities, capital budgeting, kpi metrics and dashboard, asset management process can be discussed with this completely editable template. It is available for immediate download depending on the needs and requirements of the user.
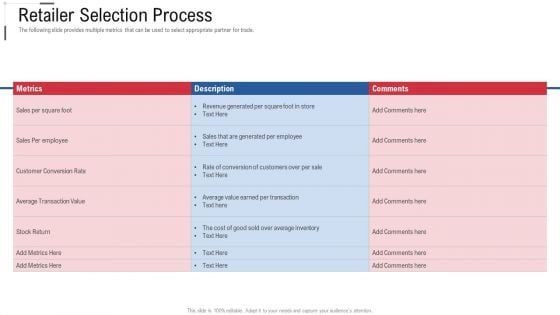
Retailer Selection Process Online Trade Marketing And Promotion Graphics PDF
The following slide provides multiple metrics that can be used to select appropriate partner for trade. Deliver an awe inspiring pitch with this creative retailer selection process online trade marketing and promotion graphics pdf bundle. Topics like sales, square, revenue can be discussed with this completely editable template. It is available for immediate download depending on the needs and requirements of the user.
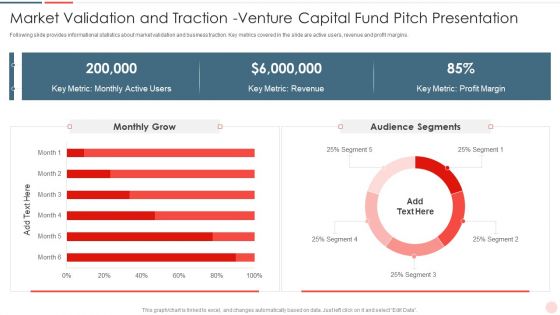
Market Validation And Traction Venture Capital Fund Pitch Presentation Template PDF
Following slide provides informational statistics about market validation and business traction. Key metrics covered in the slide are active users, revenue and profit margins. Deliver an awe inspiring pitch with this creative Market Validation And Traction Venture Capital Fund Pitch Presentation Template PDF bundle. Topics like Monthly Grow, Audience Segments, Key Metric, Profit Margin can be discussed with this completely editable template. It is available for immediate download depending on the needs and requirements of the user.
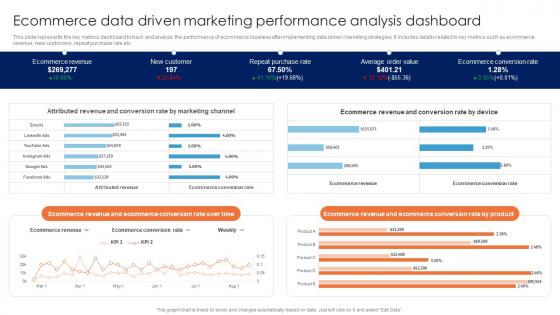
Ecommerce Data Driven Marketing Performance Guide For Data Driven Advertising Brochure Pdf
This slide represents the key metrics dashboard to track and analyze the performance of ecommerce business after implementing data driven marketing strategies. It includes details related to key metrics such as ecommerce revenue, new customers, repeat purchase rate etc.Here you can discover an assortment of the finest PowerPoint and Google Slides templates. With these templates, you can create presentations for a variety of purposes while simultaneously providing your audience with an eye-catching visual experience. Download Ecommerce Data Driven Marketing Performance Guide For Data Driven Advertising Brochure Pdf to deliver an impeccable presentation. These templates will make your job of preparing presentations much quicker, yet still, maintain a high level of quality. Slidegeeks has experienced researchers who prepare these templates and write high-quality content for you. Later on, you can personalize the content by editing the Ecommerce Data Driven Marketing Performance Guide For Data Driven Advertising Brochure Pdf. This slide represents the key metrics dashboard to track and analyze the performance of ecommerce business after implementing data driven marketing strategies. It includes details related to key metrics such as ecommerce revenue, new customers, repeat purchase rate etc.
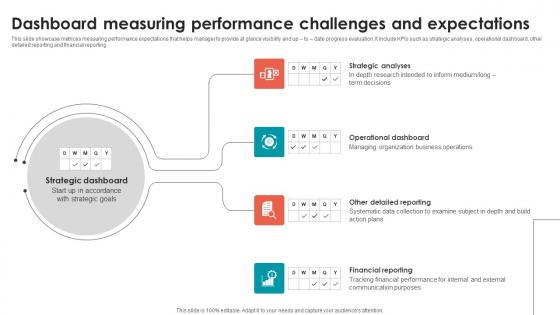
Dashboard Measuring Performance Challenges And Expectations Portrait Pdf
This slide showcase metrices measuring performance expectations that helps manager to provide at glance visibility and up to date progress evaluation. It include KPIs such as strategic analyses, operational dashboard, other detailed reporting and financial reporting. Showcasing this set of slides titled Dashboard Measuring Performance Challenges And Expectations Portrait Pdf. The topics addressed in these templates are Operational Dashboard, Strategic Analyses, Financial Reporting. All the content presented in this PPT design is completely editable. Download it and make adjustments in color, background, font etc. as per your unique business setting. This slide showcase metrices measuring performance expectations that helps manager to provide at glance visibility and up to date progress evaluation. It include KPIs such as strategic analyses, operational dashboard, other detailed reporting and financial reporting.
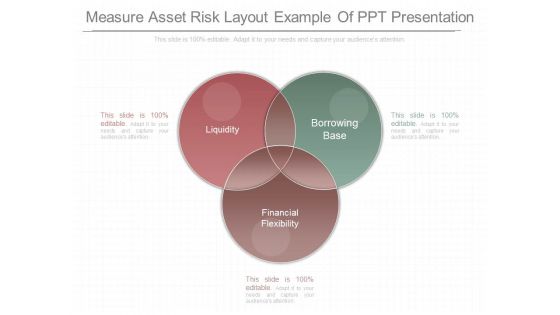
Measure Asset Risk Layout Example Of Ppt Presentation
This is a measure asset risk layout example of ppt presentation. This is a three stage process. The stages in this process are liquidity, borrowing base, financial flexibility.
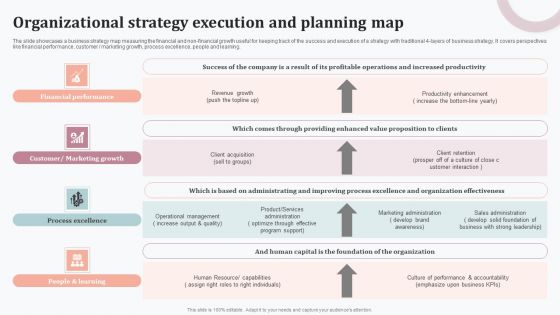
Organizational Strategy Execution And Planning Map Sample PDF
The slide showcases a business strategy map measuring the financial and non-financial growth useful for keeping track of the success and execution of a strategy with traditional 4 layers of business strategy. It covers perspectives like financial performance, customer marketing growth, process excellence, people and learning. Persuade your audience using this Organizational Strategy Execution And Planning Map Sample PDF. This PPT design covers four stages, thus making it a great tool to use. It also caters to a variety of topics including Financial Performance, Customer Marketing Growth, Process Excellence. Download this PPT design now to present a convincing pitch that not only emphasizes the topic but also showcases your presentation skills.
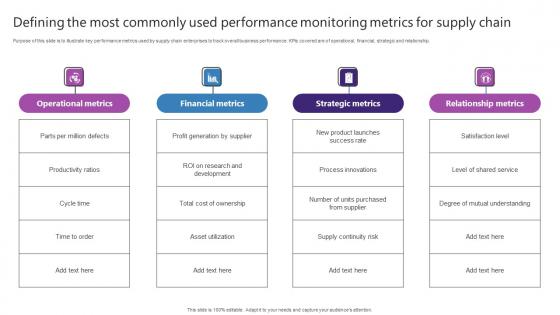
Defining The Most Commonly Used Performance Strategic Plan For Enhancing Elements Pdf
Purpose of this slide is to illustrate key performance metrics used by supply chain enterprises to track overall business performance. KPIs covered are of operational, financial, strategic and relationship. If your project calls for a presentation, then Slidegeeks is your go-to partner because we have professionally designed, easy-to-edit templates that are perfect for any presentation. After downloading, you can easily edit Defining The Most Commonly Used Performance Strategic Plan For Enhancing Elements Pdf and make the changes accordingly. You can rearrange slides or fill them with different images. Check out all the handy templates Purpose of this slide is to illustrate key performance metrics used by supply chain enterprises to track overall business performance. KPIs covered are of operational, financial, strategic and relationship.
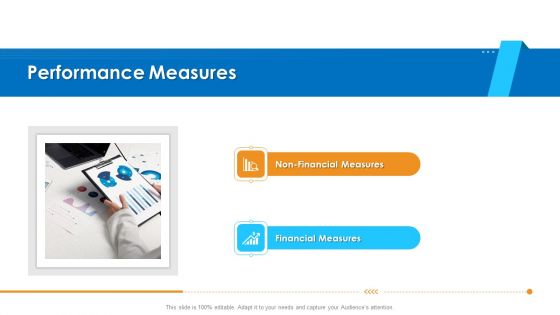
Logistics Management Framework Performance Measures Sample PDF
Presenting logistics management framework performance measures sample pdf to provide visual cues and insights. Share and navigate important information on two stages that need your due attention. This template can be used to pitch topics like non financial measures, financial measures. In addtion, this PPT design contains high resolution images, graphics, etc, that are easily editable and available for immediate download.
Logistics Management Services Performance Measures Designs PDF
Presenting logistics management services performance measures designs pdf to provide visual cues and insights. Share and navigate important information on two stages that need your due attention. This template can be used to pitch topics like non financial measures, financial measures. In addtion, this PPT design contains high resolution images, graphics, etc, that are easily editable and available for immediate download.
SCM Growth Performance Measures Ppt Diagram Templates PDF
Presenting scm growth performance measures ppt diagram templates pdf to provide visual cues and insights. Share and navigate important information on two stages that need your due attention. This template can be used to pitch topics like non financial measures, financial measures. In addtion, this PPT design contains high resolution images, graphics, etc, that are easily editable and available for immediate download.
KPIS To Track Brand Performance After Launch Maximizing Revenue Using Demonstration Pdf
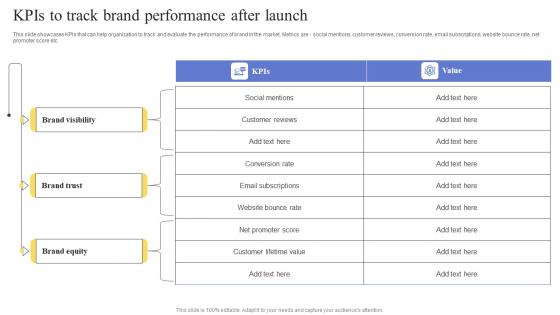
This slide showcases KPIs that can help organization to track and evaluate the performance of brand in the market. Metrics are - social mentions, customer reviews, conversion rate, email subscriptions, website bounce rate, net promoter score etc. The KPIS To Track Brand Performance After Launch Maximizing Revenue Using Demonstration Pdf is a compilation of the most recent design trends as a series of slides. It is suitable for any subject or industry presentation, containing attractive visuals and photo spots for businesses to clearly express their messages. This template contains a variety of slides for the user to input data, such as structures to contrast two elements, bullet points, and slides for written information. Slidegeeks is prepared to create an impression. This slide showcases KPIs that can help organization to track and evaluate the performance of brand in the market. Metrics are - social mentions, customer reviews, conversion rate, email subscriptions, website bounce rate, net promoter score etc.
Revenue From Sales Forecasting Dashboard For Startup Businesses Graphics Pdf
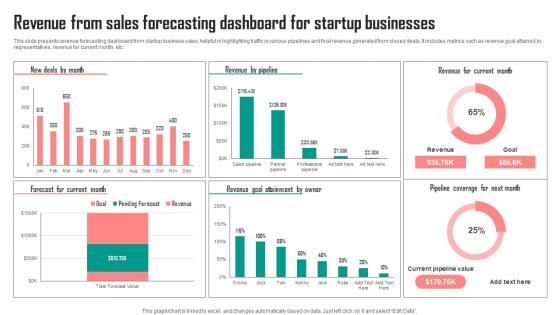
This slide presents revenue forecasting dashboard from startup business sales, helpful in highlighting traffic in various pipelines and final revenue generated from closed deals. It includes metrics such as revenue goal attained by representatives, revenue for current month, etc. Showcasing this set of slides titled Revenue From Sales Forecasting Dashboard For Startup Businesses Graphics Pdf. The topics addressed in these templates are Owner, Current Month, Businesses. All the content presented in this PPT design is completely editable. Download it and make adjustments in color, background, font etc. as per your unique business setting. This slide presents revenue forecasting dashboard from startup business sales, helpful in highlighting traffic in various pipelines and final revenue generated from closed deals. It includes metrics such as revenue goal attained by representatives, revenue for current month, etc.
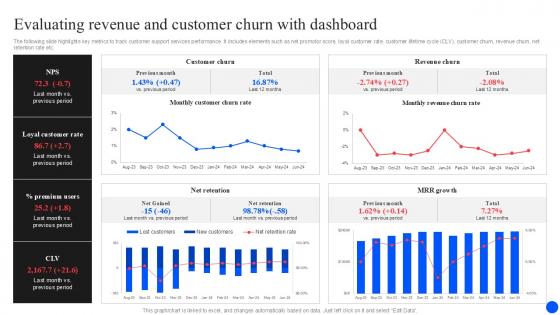
Evaluating Revenue And Customer Churn Improving Customer Retention PPT Sample
The following slide highlights key metrics to track customer support services performance. It includes elements such as net promotor score, loyal customer rate, customer lifetime cycle CLV, customer churn, revenue churn, net retention rate etc. Find highly impressive Evaluating Revenue And Customer Churn Improving Customer Retention PPT Sample on Slidegeeks to deliver a meaningful presentation. You can save an ample amount of time using these presentation templates. No need to worry to prepare everything from scratch because Slidegeeks experts have already done a huge research and work for you. You need to download Evaluating Revenue And Customer Churn Improving Customer Retention PPT Sample for your upcoming presentation. All the presentation templates are 100 percent editable and you can change the color and personalize the content accordingly. Download now The following slide highlights key metrics to track customer support services performance. It includes elements such as net promotor score, loyal customer rate, customer lifetime cycle CLV, customer churn, revenue churn, net retention rate etc.
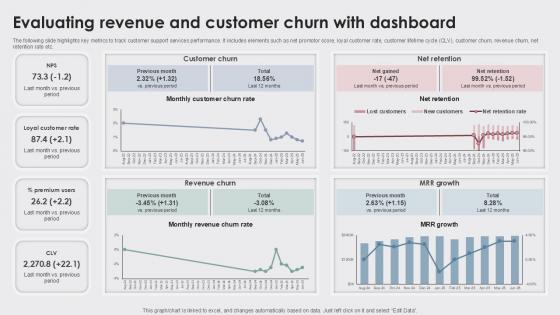
Evaluating Revenue And Customer Churn Enhancing Customer Experience Ppt Template
The following slide highlights key metrics to track customer support services performance. It includes elements such as net promotor score, loyal customer rate, customer lifetime cycle CLV, customer churn, revenue churn, net retention rate etc. Find highly impressive Evaluating Revenue And Customer Churn Enhancing Customer Experience Ppt Template on Slidegeeks to deliver a meaningful presentation. You can save an ample amount of time using these presentation templates. No need to worry to prepare everything from scratch because Slidegeeks experts have already done a huge research and work for you. You need to download Evaluating Revenue And Customer Churn Enhancing Customer Experience Ppt Template for your upcoming presentation. All the presentation templates are 100 percent editable and you can change the color and personalize the content accordingly. Download now The following slide highlights key metrics to track customer support services performance. It includes elements such as net promotor score, loyal customer rate, customer lifetime cycle CLV, customer churn, revenue churn, net retention rate etc.
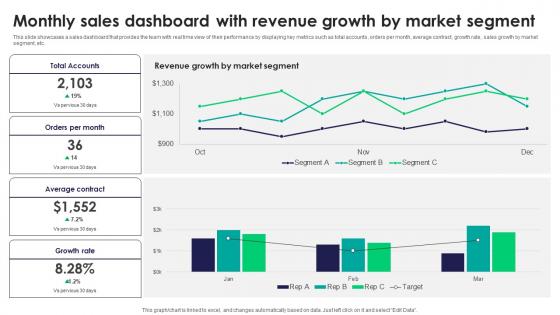
Monthly Sales Dashboard With Revenue Growth By Tactics For Improving Field Sales Team SA SS V
This slide showcases a sales dashboard that provides the team with real time view of their performance by displaying key metrics such as total accounts, orders per month, average contract, growth rate, sales growth by market segment, etc. The Monthly Sales Dashboard With Revenue Growth By Tactics For Improving Field Sales Team SA SS V is a compilation of the most recent design trends as a series of slides. It is suitable for any subject or industry presentation, containing attractive visuals and photo spots for businesses to clearly express their messages. This template contains a variety of slides for the user to input data, such as structures to contrast two elements, bullet points, and slides for written information. Slidegeeks is prepared to create an impression. This slide showcases a sales dashboard that provides the team with real time view of their performance by displaying key metrics such as total accounts, orders per month, average contract, growth rate, sales growth by market segment, etc.

Monthly Sales Dashboard With Revenue Efficient Sales Territory Management To Build SA SS V
This slide showcases a sales dashboard that provides the team with real time view of their performance by displaying key metrics such as total accounts, orders per month, average contract, growth rate, sales growth by market segment, etc. The Monthly Sales Dashboard With Revenue Efficient Sales Territory Management To Build SA SS V is a compilation of the most recent design trends as a series of slides. It is suitable for any subject or industry presentation, containing attractive visuals and photo spots for businesses to clearly express their messages. This template contains a variety of slides for the user to input data, such as structures to contrast two elements, bullet points, and slides for written information. Slidegeeks is prepared to create an impression. This slide showcases a sales dashboard that provides the team with real time view of their performance by displaying key metrics such as total accounts, orders per month, average contract, growth rate, sales growth by market segment, etc.


 Continue with Email

 Home
Home


