Financial Metrics
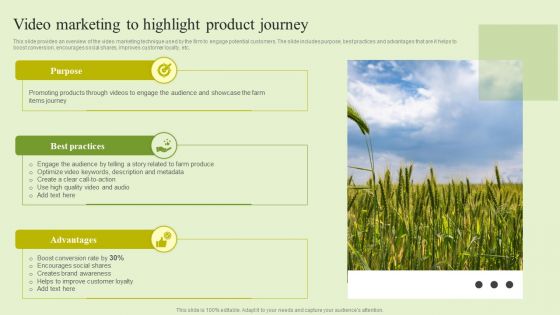
Agriculture Marketing Strategy To Improve Revenue Performance Video Marketing To Highlight Product Journey Summary PDF
This slide provides an overview of the video marketing technique used by the firm to engage potential customers. The slide includes purpose, best practices and advantages that are it helps to boost conversion, encourages social shares, improves customer loyalty, etc. Explore a selection of the finest Agriculture Marketing Strategy To Improve Revenue Performance Video Marketing To Highlight Product Journey Summary PDF here. With a plethora of professionally designed and pre made slide templates, you can quickly and easily find the right one for your upcoming presentation. You can use our Agriculture Marketing Strategy To Improve Revenue Performance Video Marketing To Highlight Product Journey Summary PDF to effectively convey your message to a wider audience. Slidegeeks has done a lot of research before preparing these presentation templates. The content can be personalized and the slides are highly editable. Grab templates today from Slidegeeks.
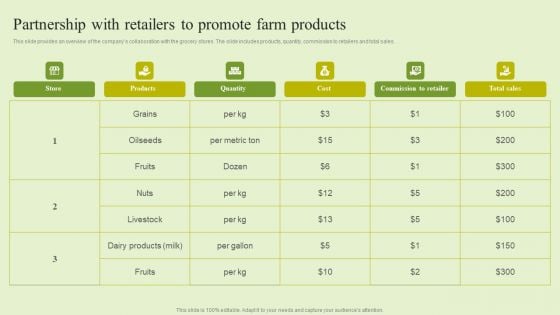
Agriculture Marketing Strategy To Improve Revenue Performance Partnership With Retailers To Promote Farm Products Inspiration PDF
This slide provides an overview of the companys collaboration with the grocery stores. The slide includes products, quantity, commission to retailers and total sales. This Agriculture Marketing Strategy To Improve Revenue Performance Partnership With Retailers To Promote Farm Products Inspiration PDF from Slidegeeks makes it easy to present information on your topic with precision. It provides customization options, so you can make changes to the colors, design, graphics, or any other component to create a unique layout. It is also available for immediate download, so you can begin using it right away. Slidegeeks has done good research to ensure that you have everything you need to make your presentation stand out. Make a name out there for a brilliant performance.
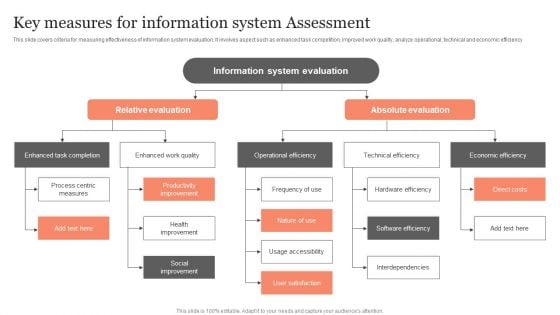
Key Measures For Information System Assessment Ppt Show Graphics PDF
This slide covers criteria for measuring effectiveness of information system evaluation. It involves aspect such as enhanced task competition, improved work quality, analyze operational, technical and economic efficiency. Persuade your audience using this Key Measures For Information System Assessment Ppt Show Graphics PDF. This PPT design covers six stages, thus making it a great tool to use. It also caters to a variety of topics including Information System Evaluation, Absolute Evaluation, Economic Efficiency. Download this PPT design now to present a convincing pitch that not only emphasizes the topic but also showcases your presentation skills.
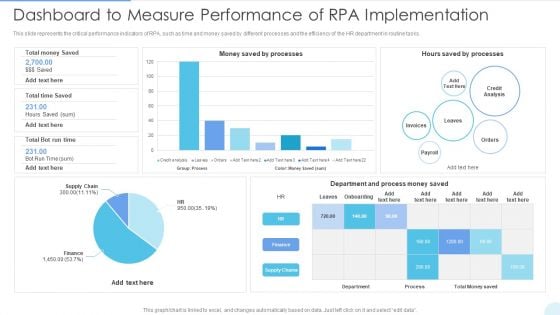
Dashboard To Measure Performance Of RPA Implementation Mockup PDF
This slide represents the critical performance indicators of RPA, such as time and money saved by different processes and the efficiency of the HR department in routine tasks. Deliver and pitch your topic in the best possible manner with this Dashboard To Measure Performance Of RPA Implementation Mockup PDF. Use them to share invaluable insights on Credit Analysis, Department And Process and impress your audience. This template can be altered and modified as per your expectations. So, grab it now.
Developing Significant Business Product And Customer Performance Tracking Clipart PDF
This slide provides information regarding dashboard utilized by firm to monitor performance of products offered and customer associated. The performance is tracked through revenues generated, new customer acquired, customer satisfaction, sales comparison, etc. Deliver and pitch your topic in the best possible manner with this Developing Significant Business Product And Customer Performance Tracking Clipart PDF. Use them to share invaluable insights on Revenue, New Customer, Revenue and impress your audience. This template can be altered and modified as per your expectations. So, grab it now.
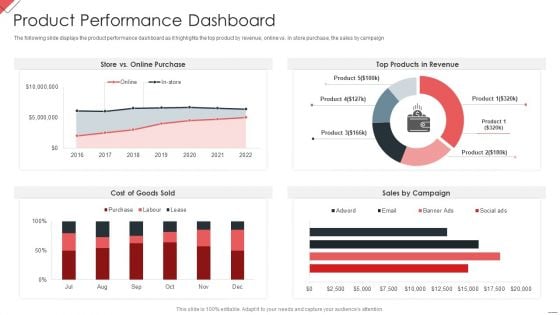
New Commodity Market Viability Review Product Performance Dashboard Infographics PDF
The following slide displays the product performance dashboard as it highlights the top product by revenue, online vs. in store purchase, the sales by campaign Deliver an awe inspiring pitch with this creative New Commodity Market Viability Review Product Performance Dashboard Infographics PDF bundle. Topics like Online Purchase, Products Revenue, Sales Campaign can be discussed with this completely editable template. It is available for immediate download depending on the needs and requirements of the user.
Revenue Generation Model For Fast Food Start Up Business Small Fast Food Business Plan Icons Pdf
This slide presents revenue model of fast food business. The purpose of this slide is to provide a brief about the revenue, business will be generating in the forecasting period. The slide provides a revenue earned by different products and the growth percentage for the further five years. This Revenue Generation Model For Fast Food Start Up Business Small Fast Food Business Plan Icons Pdf from Slidegeeks makes it easy to present information on your topic with precision. It provides customization options, so you can make changes to the colors, design, graphics, or any other component to create a unique layout. It is also available for immediate download, so you can begin using it right away. Slidegeeks has done good research to ensure that you have everything you need to make your presentation stand out. Make a name out there for a brilliant performance. This slide presents revenue model of fast food business. The purpose of this slide is to provide a brief about the revenue, business will be generating in the forecasting period. The slide provides a revenue earned by different products and the growth percentage for the further five years.
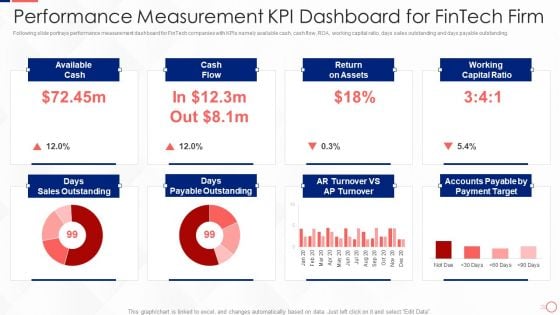
Investing In Tech Innovation Performance Measurement Kpi Dashboard For Fintech Firm Mockup PDF
Following slide portrays performance measurement dashboard for FinTech companies with KPIs namely available cash, cash flow, ROA, working capital ratio, days sales outstanding and days payable outstanding. Deliver and pitch your topic in the best possible manner with this Investing In Tech Innovation Performance Measurement Kpi Dashboard For Fintech Firm Mockup PDF. Use them to share invaluable insights on Available Cash, Cash Flow, Return on Assets, Working Capital Ratio and impress your audience. This template can be altered and modified as per your expectations. So, grab it now.
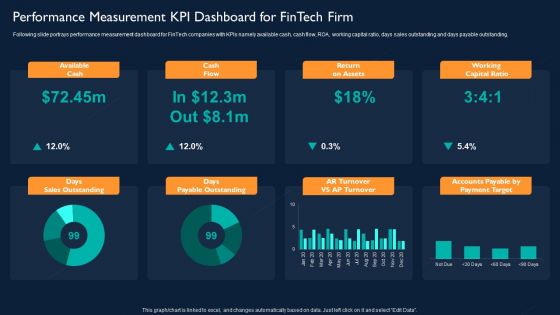
Technology Investment To Enhance Business Growth Performance Measurement KPI Dashboard For Fintech Firm Slides PDF
Following slide portrays performance measurement dashboard for FinTech companies with KPIs namely available cash, cash flow, ROA, working capital ratio, days sales outstanding and days payable outstanding. Deliver an awe inspiring pitch with this creative Technology Investment To Enhance Business Growth Performance Measurement KPI Dashboard For Fintech Firm Slides PDF bundle. Topics like Available Cash, Cash Flow, Return On Assets, Working Capital Ratio can be discussed with this completely editable template. It is available for immediate download depending on the needs and requirements of the user.
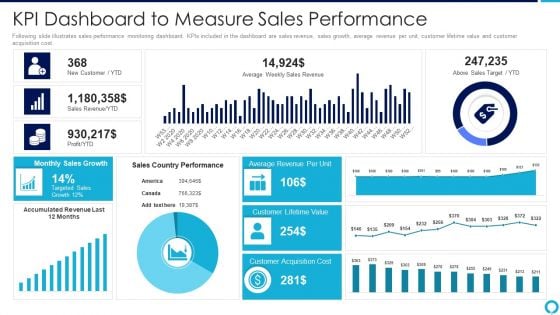
Partnership Management Strategies Kpi Dashboard To Measure Sales Performance Introduction PDF
Following slide illustrates sales performance monitoring dashboard. KPIs included in the dashboard are sales revenue, sales growth, average revenue per unit, customer lifetime value and customer acquisition cost.Deliver and pitch your topic in the best possible manner with this partnership management strategies kpi dashboard to measure sales performance introduction pdf Use them to share invaluable insights on average revenue, monthly sales growth, customer acquisition cost and impress your audience. This template can be altered and modified as per your expectations. So, grab it now.
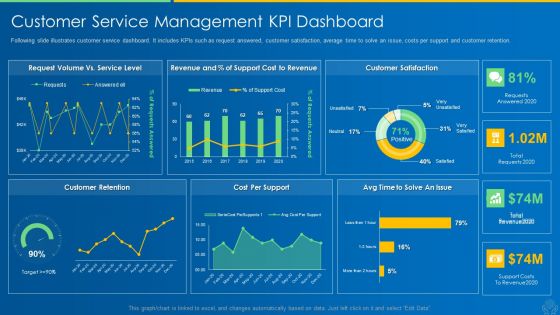
AI And ML Driving Monetary Value For Organization Customer Service Management Kpi Dashboard Formats PDF
Following slide illustrates customer service dashboard. It includes KPIs such as request answered, customer satisfaction, average time to solve an issue, costs per support and customer retention. Deliver and pitch your topic in the best possible manner with this ai and ml driving monetary value for organization customer service management kpi dashboard formats pdf. Use them to share invaluable insights on customer retention, cost per support, customer satisfaction, cost to revenue and impress your audience. This template can be altered and modified as per your expectations. So, grab it now.
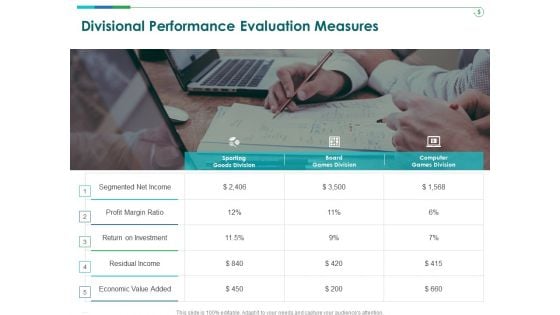
TCM Divisional Performance Evaluation Measures Ppt Professional Graphics Example PDF
Presenting this set of slides with name tcm divisional performance evaluation measures ppt professional graphics example pdf. This is a three stage process. The stages in this process are segmented, investment, economic, value, margin. This is a completely editable PowerPoint presentation and is available for immediate download. Download now and impress your audience.
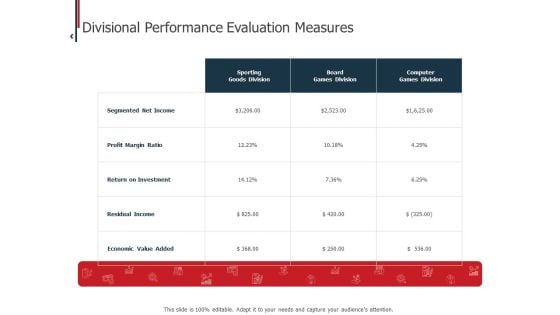
Expenditure Administration Divisional Performance Evaluation Measures Ppt Outline Diagrams PDF
Presenting this set of slides with name expenditure administration divisional performance evaluation measures ppt outline diagrams pdf. The topics discussed in these slides are segmented, investment, economic, value, margin. This is a completely editable PowerPoint presentation and is available for immediate download. Download now and impress your audience.
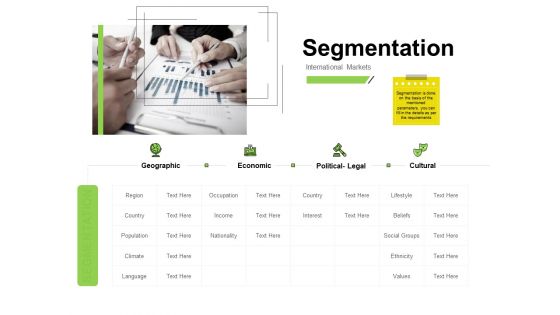
Marketing Performance Measurement Segmentation Beliefs Ppt Inspiration Sample PDF
Presenting this set of slides with name marketing performance measurement segmentation beliefs ppt inspiration sample pdf. This is a four stage process. The stages in this process are geographic, economic, political legal, cultural. This is a completely editable PowerPoint presentation and is available for immediate download. Download now and impress your audience.
Efficient Administration Of Product Business And Umbrella Branding Product Branding Performance Tracking Dashboard Background PDF
This slide provides information regarding product branding performance tracking dashboard in terms of revenues, new customers, customer satisfaction rate. Make sure to capture your audiences attention in your business displays with our gratis customizable Efficient Administration Of Product Business And Umbrella Branding Product Branding Performance Tracking Dashboard Background PDF. These are great for business strategies, office conferences, capital raising or task suggestions. If you desire to acquire more customers for your tech business and ensure they stay satisfied, create your own sales presentation with these plain slides.
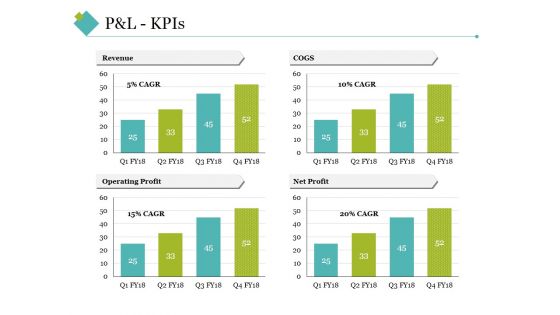
P And L Kpis Template 2 Ppt PowerPoint Presentation Inspiration Grid
This is a p and l kpis template 2 ppt powerpoint presentation inspiration grid. This is a four stage process. The stages in this process are revenue, cogs, operating profit, net profit.
Retail Trading Platform Dashboard Tracking Essential Kpis For Ecommerce Performance Diagrams PDF
This slide provides information regarding essential KPIs for ecommerce performance dashboard tracking average bounce rate, new vs. old customers, channel revenue vs. channel acquisitions costs, channel revenue vs. sales, average conversion rate, etc. Deliver an awe inspiring pitch with this creative retail trading platform dashboard tracking essential kpis for ecommerce performance diagrams pdf bundle. Topics like average bounce rate, average conversion rate, bounce rate, channel revenue sales can be discussed with this completely editable template. It is available for immediate download depending on the needs and requirements of the user.
Strategy Playbook For Ecommerce Business Dashboard Tracking Essential Kpis For Ecommerce Performance Rules PDF
This slide provides information regarding essential KPIs for ecommerce performance dashboard tracking average bounce rate, new vs. old customers, channel revenue vs. channel acquisitions costs, channel revenue vs. sales, average conversion rate, etc. Deliver an awe inspiring pitch with this creative Strategy Playbook For Ecommerce Business Dashboard Tracking Essential Kpis For Ecommerce Performance Rules PDF bundle. Topics like Returning Customers, Acquisition Cost, Channel Revenue can be discussed with this completely editable template. It is available for immediate download depending on the needs and requirements of the user.
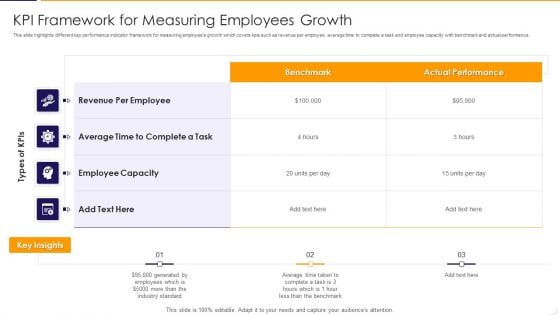
KPI Framework For Measuring Employees Growth Ppt PowerPoint Presentation File Files PDF
This slide highlights different key performance indicator framework for measuring employees growth which covers kpis such as revenue per employee, average time to complete a task and employee capacity with benchmark and actual performance. Showcasing this set of slides titled kpi framework for measuring employees growth ppt powerpoint presentation file files pdf The topics addressed in these templates are average, revenue, industry. All the content presented in this PPT design is completely editable. Download it and make adjustments in color, background, font etc. as per your unique business setting.
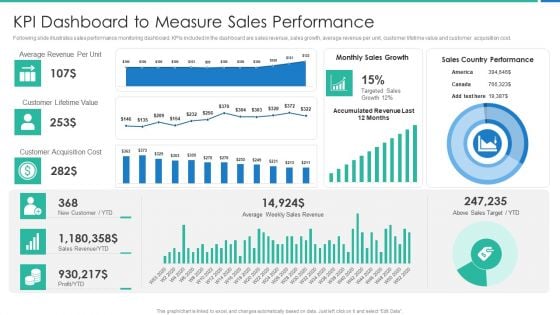
Strong Business Partnership To Ensure Company Success KPI Dashboard To Measure Sales Performance Slides PDF
Following slide illustrates sales performance monitoring dashboard. KPIs included in the dashboard are sales revenue, sales growth, average revenue per unit, customer lifetime value and customer acquisition cost.Deliver and pitch your topic in the best possible manner with this strong business partnership to ensure company success kpi dashboard to measure sales performance slides pdf Use them to share invaluable insights on kpi dashboard to measure sales performance and impress your audience. This template can be altered and modified as per your expectations. So, grab it now.
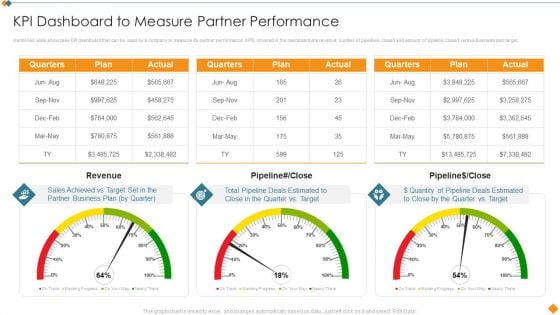
Maintaining Partner Relationships KPI Dashboard To Measure Partner Performance Structure PDF
Mentioned slide showcase KPI dashboard that can be used by a company to measure its partner performance. KPIS covered in the dashboard are revenue, number of pipelines closed and amount of pipeline closed versus business plan target. Deliver an awe inspiring pitch with this creative Maintaining Partner Relationships KPI Dashboard To Measure Partner Performance Structure PDF bundle. Topics like Quarters, Plan, Actual, Revenue, Pipeline can be discussed with this completely editable template. It is available for immediate download depending on the needs and requirements of the user.
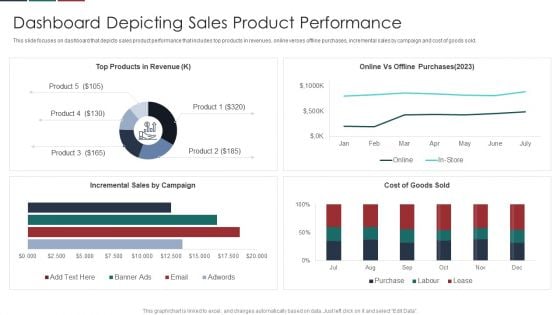
Deliver Efficiency Innovation Dashboard Depicting Sales Product Performance Themes PDF
This slide focuses on dashboard that depicts sales product performance that includes top products in revenues, online verses offline purchases, incremental sales by campaign and cost of goods sold. Deliver an awe inspiring pitch with this creative Deliver Efficiency Innovation Dashboard Depicting Sales Product Performance Themes PDF bundle. Topics like Top Products Revenue, Online Vs Offline Purchases, Incremental Sales Campaign, Cost Goods Sold can be discussed with this completely editable template. It is available for immediate download depending on the needs and requirements of the user.
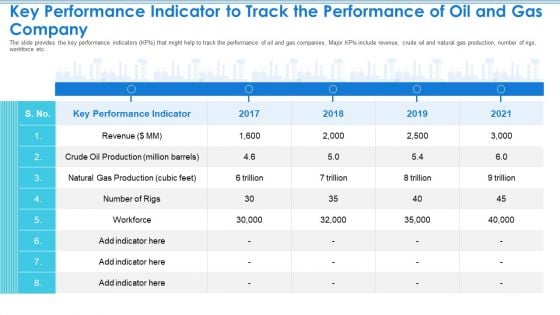
Case Competition Petroleum Sector Issues Key Performance Indicator To Track The Performance Of Oil And Gas Company Diagrams PDF
The slide provides the key performance indicators KPIs that might help to track the performance of oil and gas companies. Major KPIs include revenue, crude oil and natural gas production, number of rigs, workforce etc. Deliver and pitch your topic in the best possible manner with this case competition petroleum sector issues key performance indicator to track the performance of oil and gas company diagrams pdf. Use them to share invaluable insights on key performance indicator, revenue, 2017 to 2021 and impress your audience. This template can be altered and modified as per your expectations. So, grab it now.
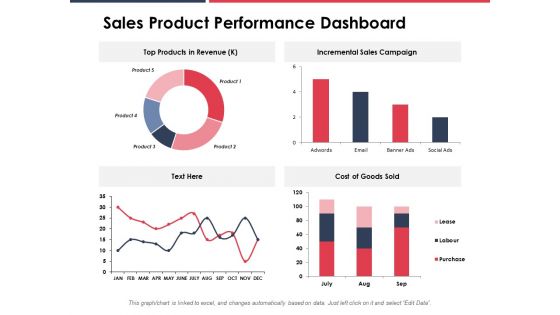
Sales Product Performance Dashboard Ppt PowerPoint Presentation Gallery Background
Presenting this set of slides with name sales product performance dashboard ppt powerpoint presentation gallery background. The topics discussed in these slides are sales, performance, revenue, incremental, social. This is a completely editable PowerPoint presentation and is available for immediate download. Download now and impress your audience.
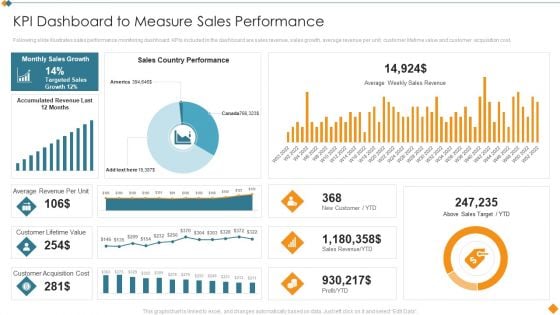
Maintaining Partner Relationships KPI Dashboard To Measure Sales Performance Rules PDF
Following slide illustrates sales performance monitoring dashboard. KPIs included in the dashboard are sales revenue, sales growth, average revenue per unit, customer lifetime value and customer acquisition cost. Deliver and pitch your topic in the best possible manner with this Maintaining Partner Relationships KPI Dashboard To Measure Sales Performance Rules PDF. Use them to share invaluable insights on Sales Country Performance, Above Sales Target, YTD, Customer Lifetime Value, Customer Acquisition Cost and impress your audience. This template can be altered and modified as per your expectations. So, grab it now.
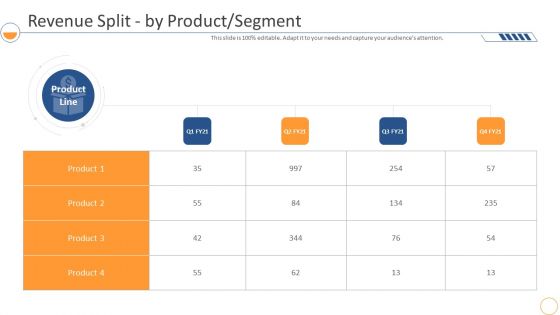
Monthly Company Performance Analysisrevenue Split By Product Segment Demonstration PDF
Deliver and pitch your topic in the best possible manner with this monthly company performance analysisrevenue split by product segment demonstration pdf. Use them to share invaluable insights on revenue split by product or segment and impress your audience. This template can be altered and modified as per your expectations. So, grab it now.
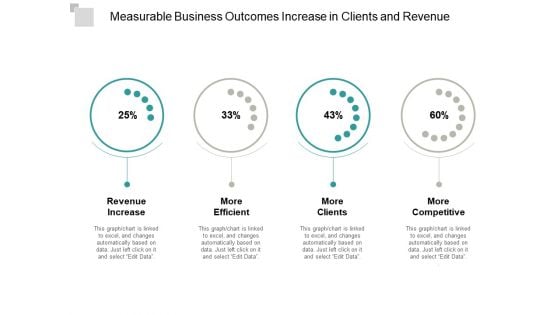
Measurable Business Outcomes Increase In Clients And Revenue Ppt Powerpoint Presentation Portfolio Ideas
This is a measurable business outcomes increase in clients and revenue ppt powerpoint presentation portfolio ideas. This is a four stage process. The stages in this process are business outcomes, business results, business output.
Revenue Generating Measures Retail Banking Ppt PowerPoint Presentation Infographic Template Slide Download Cpb
Presenting this set of slides with name revenue generating measures retail banking ppt powerpoint presentation infographic template slide download cpb. This is an editable Powerpoint six stages graphic that deals with topics like revenue generating measures retail banking to help convey your message better graphically. This product is a premium product available for immediate download and is 100 percent editable in Powerpoint. Download this now and use it in your presentations to impress your audience.
Revenue Generating Measures Retail Banking Ppt PowerPoint Presentation Show Microsoft Cpb Pdf
Presenting this set of slides with name revenue generating measures retail banking ppt powerpoint presentation show microsoft cpb pdf. This is an editable Powerpoint five stages graphic that deals with topics like revenue generating measures retail banking to help convey your message better graphically. This product is a premium product available for immediate download and is 100 percent editable in Powerpoint. Download this now and use it in your presentations to impress your audience.
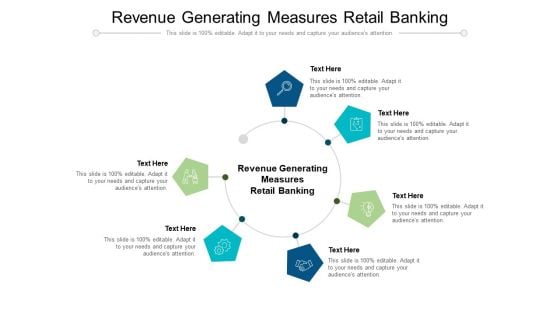
Revenue Generating Measures Retail Banking Ppt PowerPoint Presentation Gallery Show Cpb Pdf
Presenting this set of slides with name revenue generating measures retail banking ppt powerpoint presentation gallery show cpb pdf. This is an editable Powerpoint six stages graphic that deals with topics like revenue generating measures retail banking to help convey your message better graphically. This product is a premium product available for immediate download and is 100 percent editable in Powerpoint. Download this now and use it in your presentations to impress your audience.
Business Diversity Communication Plan Integration Icon To Measure Revenue Growth Portrait PDF
Persuade your audience using this Business Diversity Communication Plan Integration Icon To Measure Revenue Growth Portrait PDF. This PPT design covers four stages, thus making it a great tool to use. It also caters to a variety of topics including Business Diversity, Communication Plan Integration,Measure Revenue Growth . Download this PPT design now to present a convincing pitch that not only emphasizes the topic but also showcases your presentation skills.
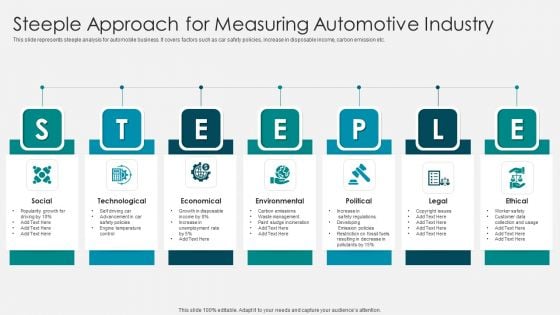
Steeple Approach For Measuring Automotive Industry Diagrams PDF
This slide represents steeple analysis for automobile business. It covers factors such as car safety policies, increase in disposable income, carbon emission etc. Presenting steeple approach for measuring automotive industry diagrams pdf to dispense important information. This template comprises seven stages. It also presents valuable insights into the topics including technological, economical, environmental. This is a completely customizable PowerPoint theme that can be put to use immediately. So, download it and address the topic impactfully.

Targeted Marketing Strategic Plan For Audience Engagement Kpis To Track Personalized Email Marketing Campaign Results Rules PDF
This slide showcases KPIs that can help organization to measure the results of personalized email marketing campaigns. KPIs include conversion rate, click through rate, click to open rate, revenue per subscriber and revenue per email. Here you can discover an assortment of the finest PowerPoint and Google Slides templates. With these templates, you can create presentations for a variety of purposes while simultaneously providing your audience with an eye catching visual experience. Download Targeted Marketing Strategic Plan For Audience Engagement Kpis To Track Personalized Email Marketing Campaign Results Rules PDF to deliver an impeccable presentation. These templates will make your job of preparing presentations much quicker, yet still, maintain a high level of quality. Slidegeeks has experienced researchers who prepare these templates and write high quality content for you. Later on, you can personalize the content by editing the Targeted Marketing Strategic Plan For Audience Engagement Kpis To Track Personalized Email Marketing Campaign Results Rules PDF.
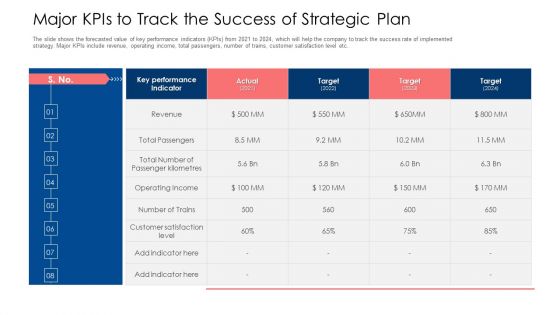
Major Kpis To Track The Success Of Strategic Plan Ppt Summary Influencers PDF
The slide shows the forecasted value of key performance indicators KPIs from 2021 to 2024, which will help the company to track the success rate of implemented strategy. Major KPIs include revenue, operating income, total passengers, number of trains, customer satisfaction level etc. Deliver an awe inspiring pitch with this creative major kpis to track the success of strategic plan ppt summary influencers pdf bundle. Topics like revenue, key performance indicator, target can be discussed with this completely editable template. It is available for immediate download depending on the needs and requirements of the user.
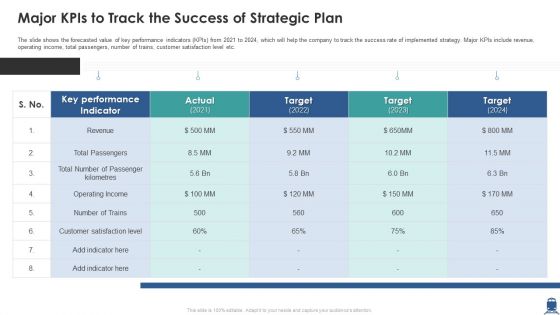
Major Kpis To Track The Success Of Strategic Plan Download PDF
The slide shows the forecasted value of key performance indicators KPIs from 2021 to 2024, which will help the company to track the success rate of implemented strategy. Major KPIs include revenue, operating income, total passengers, number of trains, customer satisfaction level etc. Deliver and pitch your topic in the best possible manner with this major kpis to track the success of strategic plan download pdf. Use them to share invaluable insights on revenue, key performance indicator, customer satisfaction level and impress your audience. This template can be altered and modified as per your expectations. So, grab it now.
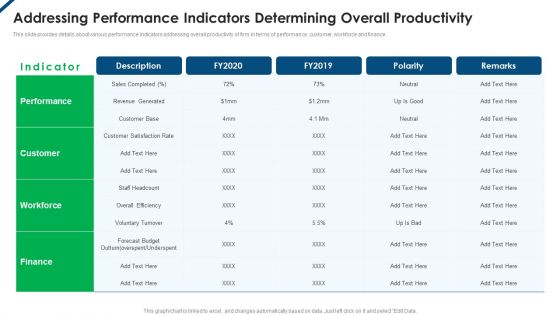
Contents Employee Productivity Management Addressing Performance Indicators Determining Professional PDF
This slide provides details about various performance indicators addressing overall productivity of firm in terms of performance, customer, workforce and finance. Deliver and pitch your topic in the best possible manner with this Contents Employee Productivity Management Addressing Performance Indicators Determining Professional PDF Use them to share invaluable insights on Revenue Generated, Voluntary Turnover, Forecast Budget and impress your audience. This template can be altered and modified as per your expectations. So, grab it now.
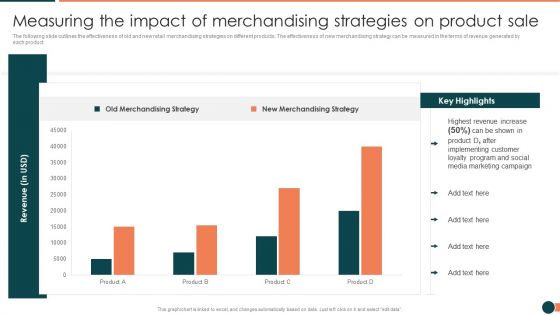
Developing Retail Marketing Strategies To Increase Revenue Measuring The Impact Background PDF
The following slide outlines the effectiveness of old and new retail merchandising strategies on different products. The effectiveness of new merchandising strategy can be measured in the terms of revenue generated by each product.Deliver and pitch your topic in the best possible manner with this Developing Retail Marketing Strategies To Increase Revenue Measuring The Impact Background PDF Use them to share invaluable insights on Revenue Increase, Implementing Customer, Marketing Campaign and impress your audience. This template can be altered and modified as per your expectations. So, grab it now.
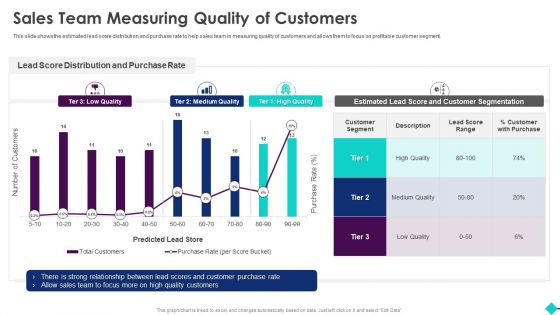
Sales Process Automation For Revenue Growth Sales Team Measuring Quality Of Customers Rules PDF
This slide shows the estimated lead score distribution and purchase rate to help sales team in measuring quality of customers and allows them to focus on profitable customer segment.Deliver an awe inspiring pitch with this creative Sales Process Automation For Revenue Growth Sales Team Measuring Quality Of Customers Rules PDF bundle. Topics like Distribution And Purchase, Customer Segmentation, Quality Customers can be discussed with this completely editable template. It is available for immediate download depending on the needs and requirements of the user.
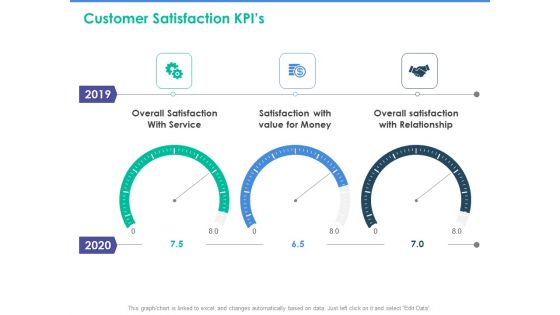
Client Specific Progress Assessment Customer Satisfaction Kpis Ppt Layouts Clipart Images PDF
Presenting this set of slides with name client specific progress assessment customer satisfaction kpis ppt layouts clipart images pdf. The topics discussed in these slides are service, relationship, money. This is a completely editable PowerPoint presentation and is available for immediate download. Download now and impress your audience.
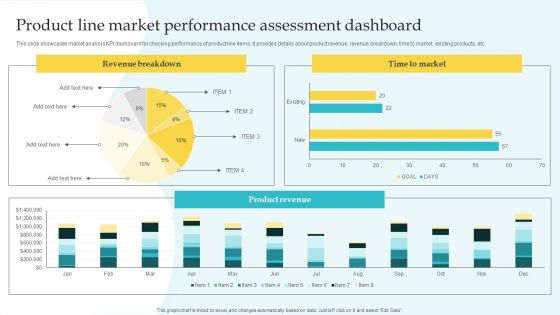
Commodity Line Expansion Product Line Market Performance Assessment Download PDF
This slide showcases market analysis KPI dashboard for checking performance of product line items. It provides details about product revenue, revenue breakdown, time to market, existing products, etc. Explore a selection of the finest Commodity Line Expansion Product Line Market Performance Assessment Download PDF here. With a plethora of professionally designed and pre-made slide templates, you can quickly and easily find the right one for your upcoming presentation. You can use our Commodity Line Expansion Product Line Market Performance Assessment Download PDF to effectively convey your message to a wider audience. Slidegeeks has done a lot of research before preparing these presentation templates. The content can be personalized and the slides are highly editable. Grab templates today from Slidegeeks.
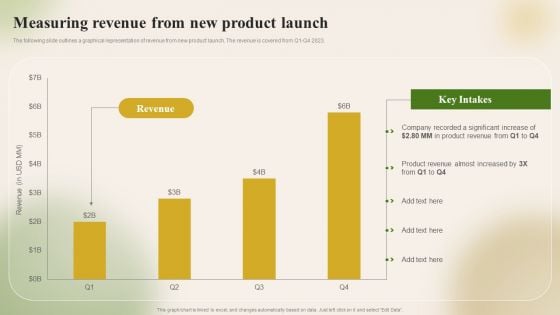
Introducing New Food Commodity Measuring Revenue From New Product Launch Download PDF
The following slide outlines a graphical representation of revenue from new product launch. The revenue is covered from Q1-Q4 2023. If you are looking for a format to display your unique thoughts, then the professionally designed Introducing New Food Commodity Measuring Revenue From New Product Launch Download PDF is the one for you. You can use it as a Google Slides template or a PowerPoint template. Incorporate impressive visuals, symbols, images, and other charts. Modify or reorganize the text boxes as you desire. Experiment with shade schemes and font pairings. Alter, share or cooperate with other people on your work. Download Introducing New Food Commodity Measuring Revenue From New Product Launch Download PDF and find out how to give a successful presentation. Present a perfect display to your team and make your presentation unforgettable.
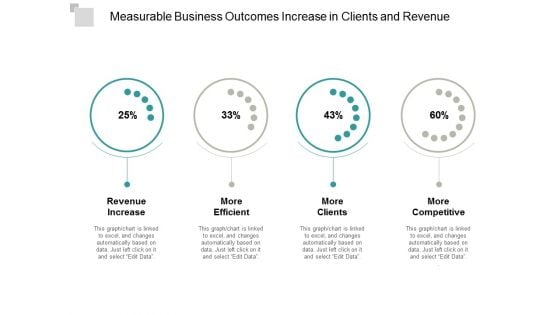
Measurable Business Outcomes Increase In Clients And Revenue Ppt PowerPoint Presentation Layouts Format Ideas
Presenting this set of slides with name measurable business outcomes increase in clients and revenue ppt powerpoint presentation layouts format ideas. The topics discussed in these slides are business outcomes, business results, business output. This is a completely editable PowerPoint presentation and is available for immediate download. Download now and impress your audience.
Dashboard For Tracking And Measuring Business Sales And Revenue Ppt PowerPoint Presentation Slides Introduction PDF
Showcasing this set of slides titled dashboard for tracking and measuring business sales and revenue ppt powerpoint presentation slides introduction pdf. The topics addressed in these templates are revenue by pipeline jun 2020, new deals by month this year 2020, forecast june 2020, revenue goal attainment by owner jun 2020, revenue goal attainment jun 2020, pipeline coverage jul 2020. All the content presented in this PPT design is completely editable. Download it and make adjustments in color, background, font etc. as per your unique business setting.
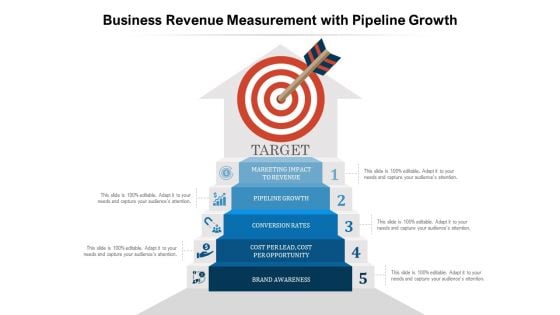
Business Revenue Measurement With Pipeline Growth Ppt PowerPoint Presentation Infographics Visual Aids PDF
Presenting this set of slides with name business revenue measurement with pipeline growth ppt powerpoint presentation infographics visual aids pdf. This is a five stage process. The stages in this process are target, marketing impact to revenue, pipeline growth, conversion rates, cost per lead, cost per opportunity, brand awareness. This is a completely editable PowerPoint presentation and is available for immediate download. Download now and impress your audience.
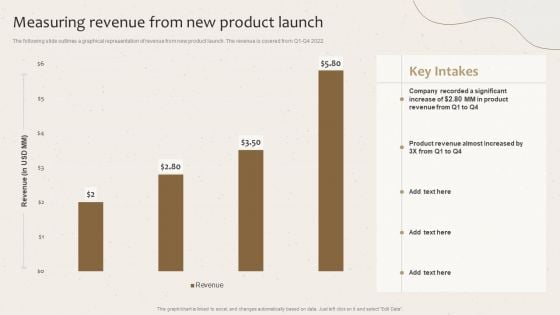
Measuring Revenue From New Product Launch Launching New Beverage Product Slides PDF
The following slide outlines a graphical representation of revenue from new product launch. The revenue is covered from Q1-Q4 2022. Want to ace your presentation in front of a live audience Our Measuring Revenue From New Product Launch Launching New Beverage Product Slides PDF can help you do that by engaging all the users towards you.. Slidegeeks experts have put their efforts and expertise into creating these impeccable powerpoint presentations so that you can communicate your ideas clearly. Moreover, all the templates are customizable, and easy-to-edit and downloadable. Use these for both personal and commercial use.
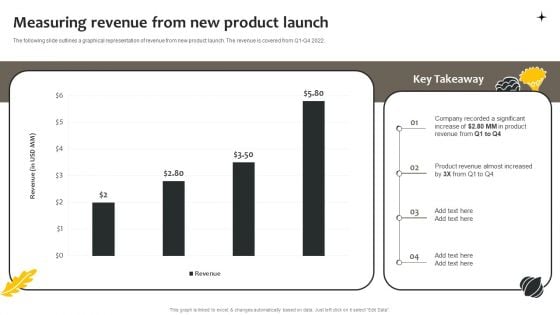
Effective Online And Offline Promotional Measuring Revenue From New Product Launch Template PDF
The following slide outlines a graphical representation of revenue from new product launch. The revenue is covered from Q1-Q4 2022. Present like a pro with Effective Online And Offline Promotional Measuring Revenue From New Product Launch Template PDF Create beautiful presentations together with your team, using our easy-to-use presentation slides. Share your ideas in real-time and make changes on the fly by downloading our templates. So whether youre in the office, on the go, or in a remote location, you can stay in sync with your team and present your ideas with confidence. With Slidegeeks presentation got a whole lot easier. Grab these presentations today.
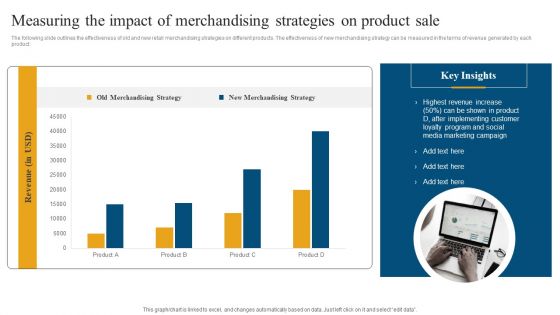
Retail Ecommerce Merchandising Tactics For Boosting Revenue Measuring The Impact Of Merchandising Strategies Slides PDF
The following slide outlines the effectiveness of old and new retail merchandising strategies on different products. The effectiveness of new merchandising strategy can be measured in the terms of revenue generated by each product. Coming up with a presentation necessitates that the majority of the effort goes into the content and the message you intend to convey. The visuals of a PowerPoint presentation can only be effective if it supplements and supports the story that is being told. Keeping this in mind our experts created Retail Ecommerce Merchandising Tactics For Boosting Revenue Measuring The Impact Of Merchandising Strategies Slides PDF to reduce the time that goes into designing the presentation. This way, you can concentrate on the message while our designers take care of providing you with the right template for the situation.
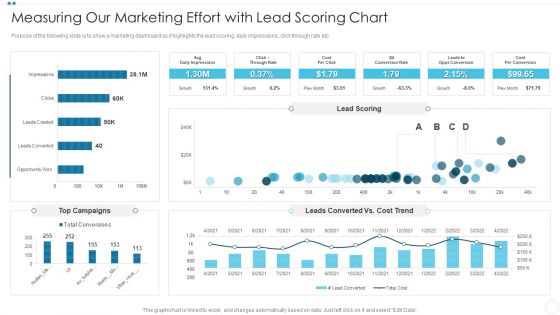
Company Sales Lead Qualification Procedure To Enhance Revenue Measuring Our Marketing Effort Rules PDF
Purpose of the following slide is to show a marketing dashboard as it highlights the lead scoring, daily impressions , click through rate etc. Deliver an awe inspiring pitch with this creative Company Sales Lead Qualification Procedure To Enhance Revenue Measuring Our Marketing Effort Rules PDF bundle. Topics like Top Campaigns, Leads Converted, Lead Scoring can be discussed with this completely editable template. It is available for immediate download depending on the needs and requirements of the user.
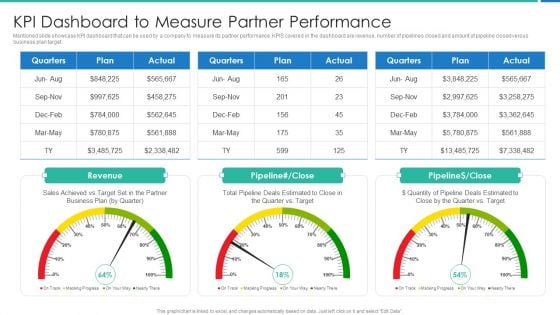
Strong Business Partnership To Ensure Company Success KPI Dashboard To Measure Partner Performance Sample PDF
Mentioned slide showcase KPI dashboard that can be used by a company to measure its partner performance. KPIS covered in the dashboard are revenue, number of pipelines closed and amount of pipeline closed versus business plan target.Deliver an awe inspiring pitch with this creative strong business partnership to ensure company success kpi dashboard to measure partner performance sample pdf bundle. Topics like kpi dashboard to measure partner performance can be discussed with this completely editable template. It is available for immediate download depending on the needs and requirements of the user.
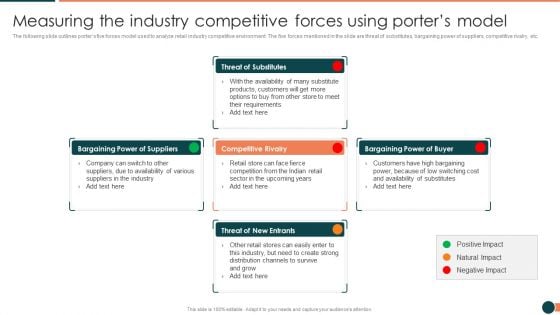
Developing Retail Marketing Strategies To Increase Revenue Measuring The Industry Introduction PDF
The following slide outlines porters five forces model used to analyze retail industry competitive environment. The five forces mentioned in the slide are threat of substitutes, bargaining power of suppliers, competitive rivalry, etc. Deliver an awe inspiring pitch with this creative Developing Retail Marketing Strategies To Increase Revenue Measuring The Industry Introduction PDF bundle. Topics like Competitive Rivalry, Threat Of Substitutes, Positive Impact can be discussed with this completely editable template. It is available for immediate download depending on the needs and requirements of the user.
Developing Retail Marketing Strategies To Increase Revenue Survey Form To Measure Icons PDF
The following slide outlines a questionnaire which can be used to evaluate the retail sales training effectiveness. The questions covered in the slide are related to training content, delivery speed, trainer knowledge, training quality and training relevance in building new sales skill.This is a Developing Retail Marketing Strategies To Increase Revenue Survey Form To Measure Icons PDF template with various stages. Focus and dispense information on one stage using this creative set, that comes with editable features. It contains large content boxes to add your information on topics like Content Matched, Trainer Possesses, Persuade Customers You can also showcase facts, figures, and other relevant content using this PPT layout. Grab it now.
Product Management Team Performance Tracking KPI Dashboard Pictures PDF
This slide provides performance tracking dashboard for product development project team. It provides information regarding hours spent on project, deadlines, employee responsible, new leads and revenue generated. Pitch your topic with ease and precision using this Product Management Team Performance Tracking KPI Dashboard Pictures PDF. This layout presents information on Tracking KPI Dashboard, Product Management Team Performance. It is also available for immediate download and adjustment. So, changes can be made in the color, design, graphics or any other component to create a unique layout.
Optimize Brand Valuation Product Branding Performance Tracking Dashboard Background PDF
This slide provides information regarding product branding performance tracking dashboard in terms of revenues, new customers, customer satisfaction rate. Create an editable Optimize Brand Valuation Product Branding Performance Tracking Dashboard Background PDF that communicates your idea and engages your audience. Whether you are presenting a business or an educational presentation, pre-designed presentation templates help save time. Optimize Brand Valuation Product Branding Performance Tracking Dashboard Background PDF is highly customizable and very easy to edit, covering many different styles from creative to business presentations. Slidegeeks has creative team members who have crafted amazing templates. So, go and get them without any delay.
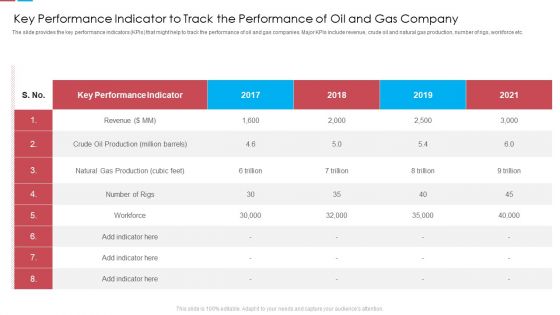
Key Performance Indicator To Track The Performance Of Oil And Gas Company Ppt Ideas Graphics Design PDF
The slide provides the key performance indicators KPIs that might help to track the performance of oil and gas companies. Major KPIs include revenue, crude oil and natural gas production, number of rigs, workforce etc. Deliver an awe inspiring pitch with this creative key performance indicator to track the performance of oil and gas company ppt ideas graphics design pdf bundle. Topics like key performance indicator to track the performance of oil and gas company can be discussed with this completely editable template. It is available for immediate download depending on the needs and requirements of the user.
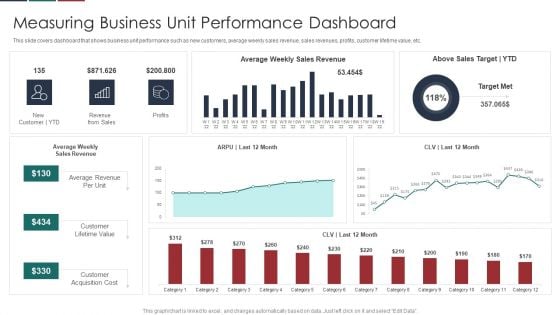
Deliver Efficiency Innovation Measuring Business Unit Performance Dashboard Background PDF
This slide covers dashboard that shows business unit performance such as new customers, average weekly sales revenue, sales revenues, profits, customer lifetime value, etc. Deliver an awe inspiring pitch with this creative Deliver Efficiency Innovation Measuring Business Unit Performance Dashboard Background PDF bundle. Topics like Customer Lifetime Value, Customer Acquisition Cost, Average Revenue Per Unit, Above Sales Target YTD can be discussed with this completely editable template. It is available for immediate download depending on the needs and requirements of the user.
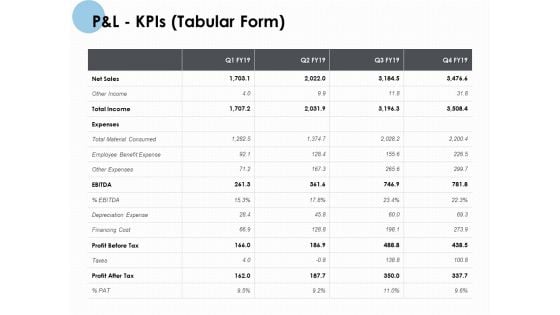
P And L Kpis Tabular Form Ppt PowerPoint Presentation Pictures Introduction
Presenting this set of slides with name p and l kpis tabular form ppt powerpoint presentation pictures introduction. The topics discussed in these slides are revenue, operating profit, net increase cash. This is a completely editable PowerPoint presentation and is available for immediate download. Download now and impress your audience.
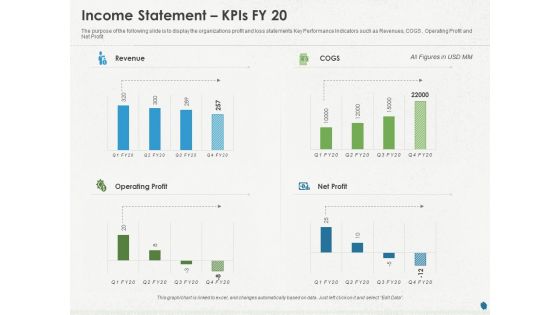
Distressed Debt Refinancing For Organizaton Income Statement Kpis FY 20 Ppt PowerPoint Presentation Model Guide PDF
Presenting this set of slides with name distressed debt refinancing for organizaton income statement kpis fy 20 ppt powerpoint presentation model guide pdf. The topics discussed in these slides are revenue, cogs, operating profit, net profit. This is a completely editable PowerPoint presentation and is available for immediate download. Download now and impress your audience.

Distressed Debt Refinancing For Organizaton Income Statement Kpis FY20 Ppt PowerPoint Presentation File Images PDF
Presenting this set of slides with name distressed debt refinancing for organizaton income statement kpis fy20 ppt powerpoint presentation file images pdf. The topics discussed in these slides are revenue, cost profit, gross profit, research and development, sales, marketing. This is a completely editable PowerPoint presentation and is available for immediate download. Download now and impress your audience.
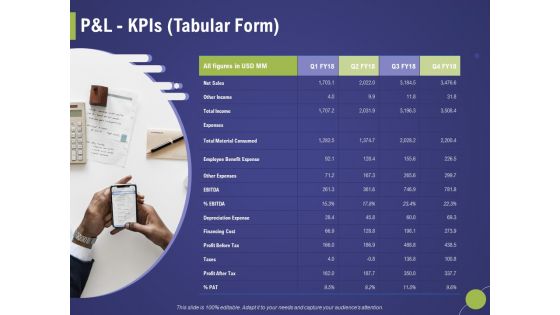
Firm Capability Assessment Pandl Kpis Tabular Form Ppt Infographic Template Inspiration PDF
Presenting this set of slides with name firm capability assessment pandl kpis tabular form ppt infographic template inspiration pdf. The topics discussed in these slides are revenue, net profit, operating profit, cogs. This is a completely editable PowerPoint presentation and is available for immediate download. Download now and impress your audience.
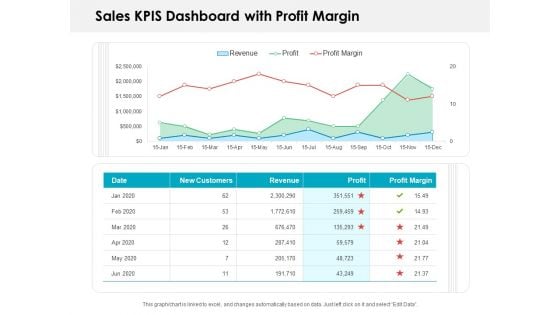
Sales KPIS Dashboard With Profit Margin Ppt PowerPoint Presentation Slides Show PDF
Presenting this set of slides with name sales kpis dashboard with profit margin ppt powerpoint presentation slides show pdf. The topics discussed in these slides are new customers, revenue, profit, profit margin. This is a completely editable PowerPoint presentation and is available for immediate download. Download now and impress your audience.


 Continue with Email

 Home
Home


