Financial Metrics
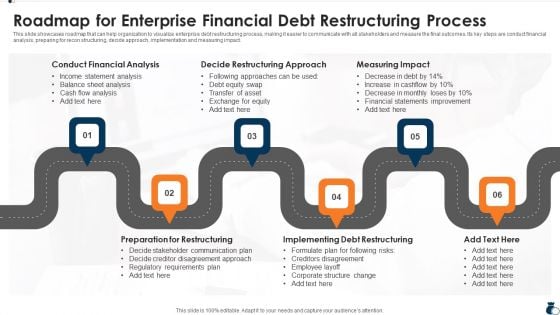
Roadmap For Enterprise Financial Debt Restructuring Process Slides PDF
This slide showcases roadmap that can help organization to visualize enterprise debt restructuring process, making it easier to communicate with all stakeholders and measure the final outcomes. Its key steps are conduct financial analysis, preparing for recon structuring, decide approach, implementation and measuring impact. Presenting Roadmap For Enterprise Financial Debt Restructuring Process Slides PDF to provide visual cues and insights. Share and navigate important information on six stages that need your due attention. This template can be used to pitch topics like Communication Plan, Requirements Plan, Measuring Impact. In addtion, this PPT design contains high resolution images, graphics, etc, that are easily editable and available for immediate download.
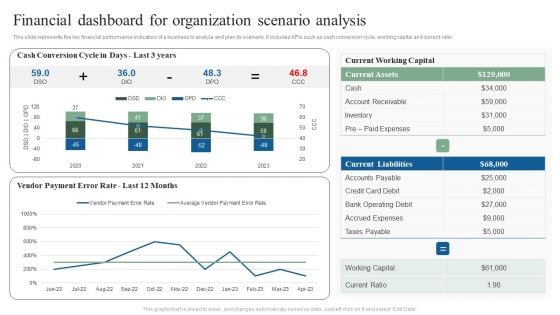
Financial Dashboard For Organization Scenario Analysis Ppt Show Ideas PDF
This slide represents the key financial performance indicators of a business to analyze and plan its scenario. It includes KPIs such as cash conversion cycle, working capital and current ratio. Showcasing this set of slides titled Financial Dashboard For Organization Scenario Analysis Ppt Show Ideas PDF. The topics addressed in these templates are Current Working Capital, Current Liabilities, Current Assets. All the content presented in this PPT design is completely editable. Download it and make adjustments in color, background, font etc. as per your unique business setting.
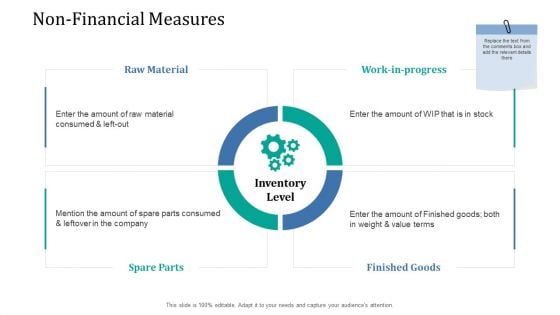
Supply Network Management Growth Non Financial Measures Material Designs PDF
Presenting supply network management growth non financial measures material designs pdf to provide visual cues and insights. Share and navigate important information on four stages that need your due attention. This template can be used to pitch topics like raw material, spare parts, finished goods, work in progress. In addtion, this PPT design contains high resolution images, graphics, etc, that are easily editable and available for immediate download.
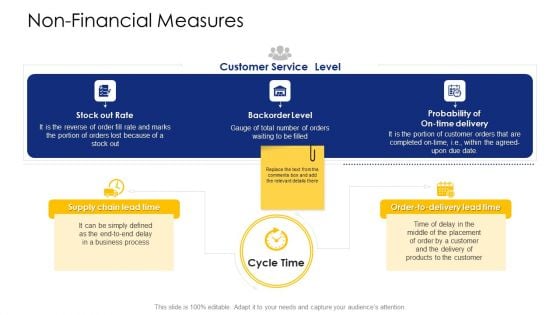
Logistic Network Administration Solutions Non Financial Measures Cycle Clipart PDF
This is a logistic network administration solutions non financial measures cycle clipart pdf template with various stages. Focus and dispense information on three stages using this creative set, that comes with editable features. It contains large content boxes to add your information on topics like stock out rate, backorder level, probability of on time delivery. You can also showcase facts, figures, and other relevant content using this PPT layout. Grab it now.
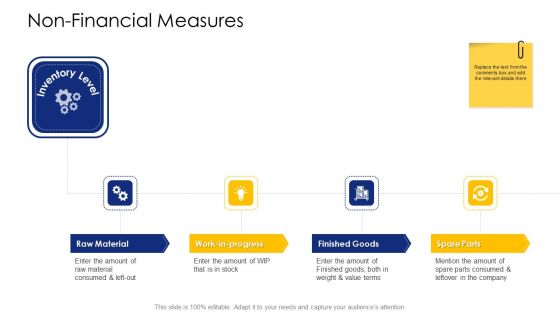
Logistic Network Administration Solutions Non Financial Measures Material Slides PDF
Presenting logistic network administration solutions non financial measures material slides pdf to provide visual cues and insights. Share and navigate important information on four stages that need your due attention. This template can be used to pitch topics like raw material, spare parts, finished goods, work in progress. In addtion, this PPT design contains high resolution images, graphics, etc, that are easily editable and available for immediate download.
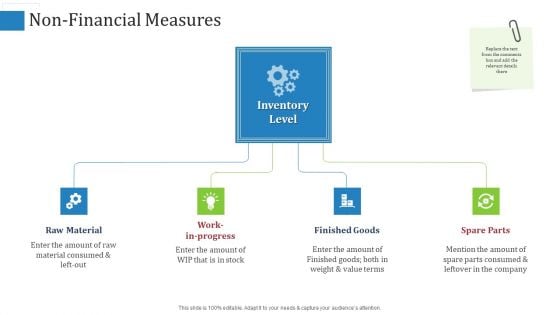
Non Financial Measures Amount Ppt Infographics Tips PDF
This is a NON financial measures amount ppt infographics tips pdf. template with various stages. Focus and dispense information on four stages using this creative set, that comes with editable features. It contains large content boxes to add your information on topics like raw material, work in progress, finished goods, spare parts. You can also showcase facts, figures, and other relevant content using this PPT layout. Grab it now.
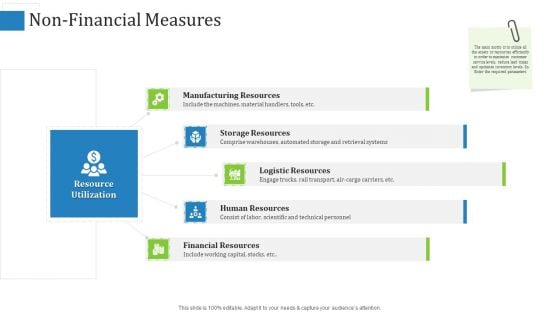
Non Financial Measures Resources Ppt Show Styles PDF
Presenting NON financial measures resources ppt show styles pdf. to provide visual cues and insights. Share and navigate important information on five stages that need your due attention. This template can be used to pitch topics like manufacturing resources, storage resources, logistic resources, human resources. In addtion, this PPT design contains high resolution images, graphics, etc, that are easily editable and available for immediate download.
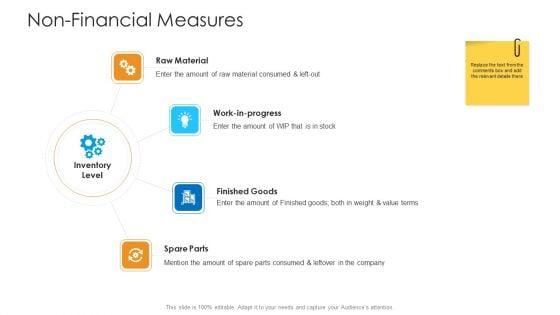
Logistics Management Framework Non Financial Measures Material Professional PDF
Presenting logistics management framework non financial measures material professional pdf to provide visual cues and insights. Share and navigate important information on four stages that need your due attention. This template can be used to pitch topics like raw material, work in progress, finished goods, spare parts. In addtion, this PPT design contains high resolution images, graphics, etc, that are easily editable and available for immediate download.
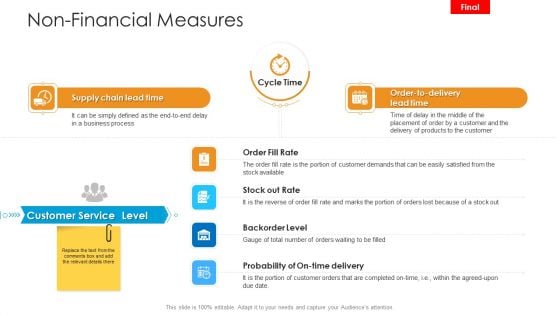
Logistics Management Framework Non Financial Measures Professional PDF
Presenting logistics management framework non financial measures professional pdf to provide visual cues and insights. Share and navigate important information on five stages that need your due attention. This template can be used to pitch topics like manufacturing resources, storage resources, logistic resources, human resources. In addtion, this PPT design contains high resolution images, graphics, etc, that are easily editable and available for immediate download.

Logistics Management Services Non Financial Measures Gride Inspiration PDF
Presenting logistics management services non financial measures gride inspiration pdf to provide visual cues and insights. Share and navigate important information on five stages that need your due attention. This template can be used to pitch topics like manufacturing resources, storage resources, logistic resources, human resources. In addtion, this PPT design contains high resolution images, graphics, etc, that are easily editable and available for immediate download.
Logistics Management Services Non Financial Measures Icon Pictures PDF
Presenting logistics management services non financial measures icon pictures pdf to provide visual cues and insights. Share and navigate important information on four stages that need your due attention. This template can be used to pitch topics like raw material, work in progress, finished goods, spare parts. In addtion, this PPT design contains high resolution images, graphics, etc, that are easily editable and available for immediate download.
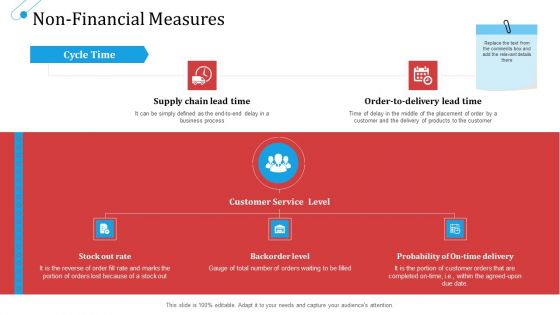
SCM Growth Non Financial Measures Cycle Ppt Layouts Example PDF
This is a scm growth non financial measures cycle ppt layouts example pdf template with various stages. Focus and dispense information on three stages using this creative set, that comes with editable features. It contains large content boxes to add your information on topics like business, process, probability, supply chain. You can also showcase facts, figures, and other relevant content using this PPT layout. Grab it now.
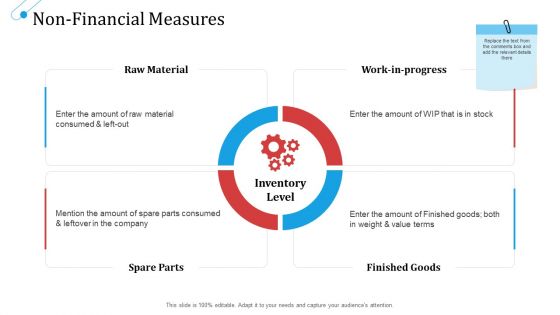
SCM Growth Non Financial Measures Material Ppt Ideas Smartart PDF
Presenting scm growth non financial measures material ppt ideas smartart pdf to provide visual cues and insights. Share and navigate important information on four stages that need your due attention. This template can be used to pitch topics like raw material, work in progress, spare parts, finished goods. In addtion, this PPT design contains high resolution images, graphics, etc, that are easily editable and available for immediate download.
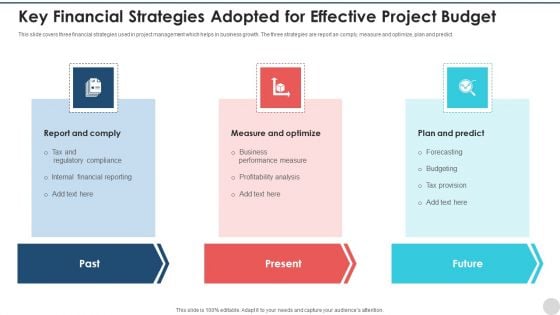
Key Financial Strategies Adopted For Effective Project Budget Rules PDF
This slide covers three financial strategies used in project management which helps in business growth. The three strategies are report an comply, measure and optimize, plan and predict. Persuade your audience using this key financial strategies adopted for effective project budget rules pdf. This PPT design covers three stages, thus making it a great tool to use. It also caters to a variety of topics including past, present, future. Download this PPT design now to present a convincing pitch that not only emphasizes the topic but also showcases your presentation skills.
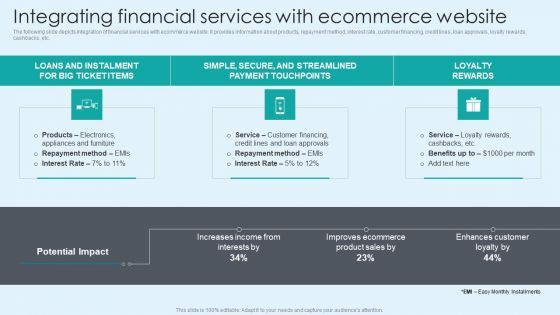
Integrating Financial Services With Ecommerce Website Sample PDF
The following slide depicts integration of financial services with ecommerce website. It provides information about products, repayment method, interest rate, customer financing, credit lines, loan approvals, loyalty rewards, cashbacks, etc. From laying roadmaps to briefing everything in detail, our templates are perfect for you. You can set the stage with your presentation slides. All you have to do is download these easy to edit and customizable templates. Integrating Financial Services With Ecommerce Website Sample PDF will help you deliver an outstanding performance that everyone would remember and praise you for. Do download this presentation today.
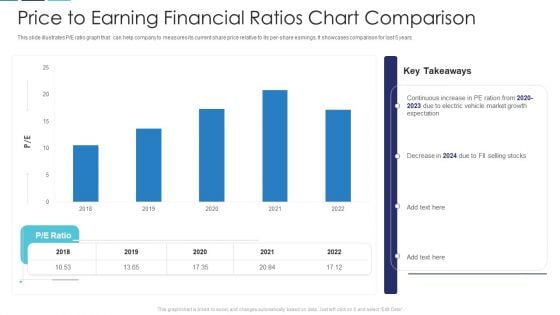
Price To Earning Financial Ratios Chart Comparison Slides PDF
This slide illustrates P or E ratio graph that can help company to measures its current share price relative to its per-share earnings. It showcases comparison for last 5 years Showcasing this set of slides titled price to earning financial ratios chart comparison slides pdf. The topics addressed in these templates are price to earning financial ratios chart comparison. All the content presented in this PPT design is completely editable. Download it and make adjustments in color, background, font etc. as per your unique business setting.
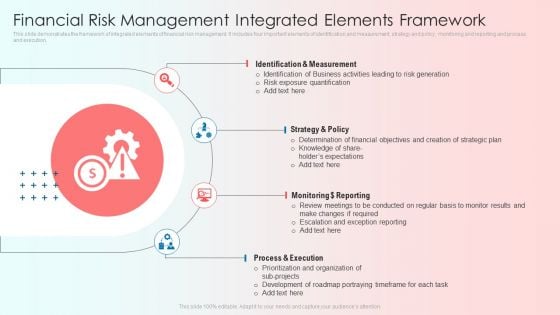
Financial Risk Management Integrated Elements Framework Clipart PDF
This slide demonstrates the framework of integrated elements of financial risk management. It includes four important elements of identification and measurement, strategy and policy, monitoring and reporting and process and execution. Persuade your audience using this Financial Risk Management Integrated Elements Framework Clipart PDF. This PPT design covers four stages, thus making it a great tool to use. It also caters to a variety of topics including Organization, Development, Required. Download this PPT design now to present a convincing pitch that not only emphasizes the topic but also showcases your presentation skills.
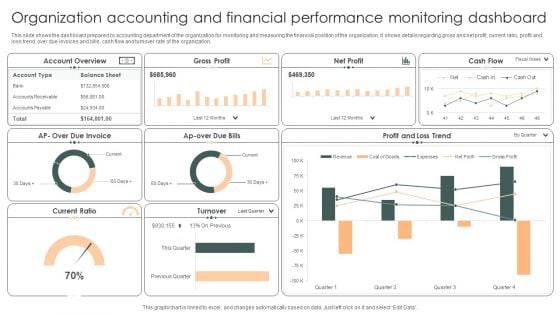
Organization Accounting And Financial Performance Monitoring Dashboard Pictures PDF
This slide shows the dashboard prepared by accounting department of the organization for monitoring and measuring the financial position of the organization. It shows details regarding gross and net profit, current ratio, profit and loss trend, over due invoices and bills, cash flow and turnover rate of the organization.Showcasing this set of slides titled Organization Accounting And Financial Performance Monitoring Dashboard Pictures PDF. The topics addressed in these templates are Account Overview, Due Invoice, Loss Trend. All the content presented in this PPT design is completely editable. Download it and make adjustments in color, background, font etc. as per your unique business setting.
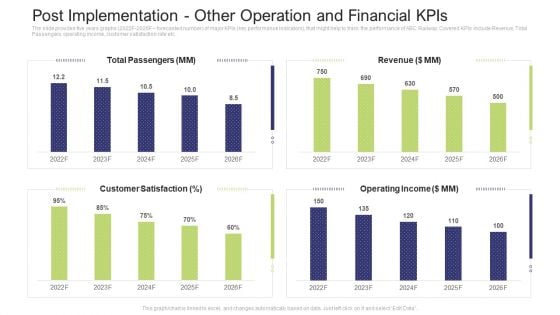
Post Implementation Other Operation And Financial Kpis Summary PDF
The slide provides five years graphs 2022F to 2026F forecasted number of major KPIs key performance indicators, that might help to track the performance of ABC Railway. Covered KPIs include Revenue, Total Passengers, operating income, customer satisfaction rate etc.Deliver and pitch your topic in the best possible manner with this post implementation other operation and financial KPIs summary pdf. Use them to share invaluable insights on total passengers, operating income, revenue, 2022 to 2026 and impress your audience. This template can be altered and modified as per your expectations. So, grab it now.
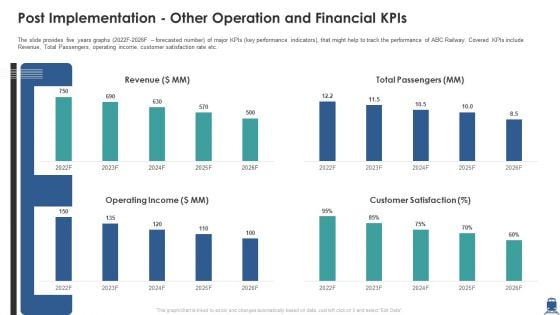
Post Implementation Other Operation And Financial Kpis Inspiration PDF
The slide provides five years graphs 2022F-2026F forecasted number of major KPIs key performance indicators, that might help to track the performance of ABC Railway. Covered KPIs include Revenue, Total Passengers, operating income, customer satisfaction rate etc. Deliver and pitch your topic in the best possible manner with this post implementation other operation and financial kpis inspiration pdf. Use them to share invaluable insights on revenue, operating income, customer satisfaction and impress your audience. This template can be altered and modified as per your expectations. So, grab it now.
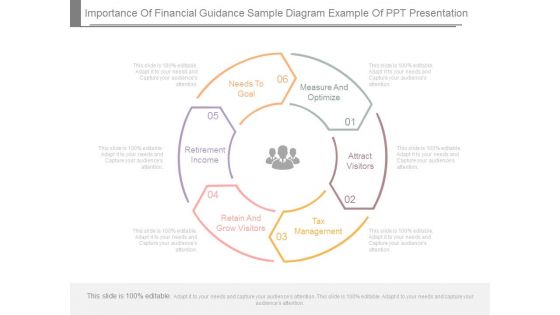
Importance Of Financial Guidance Sample Diagram Example Of Ppt Presentation
This is a importance of financial guidance sample diagram example of ppt presentation. This is a six stage process. The stages in this process are needs to goal, measure and optimize, attract visitors, tax management, retain and grow visitors, retirement income.
Financial Report Vector Icon Ppt PowerPoint Presentation Professional Mockup
Presenting this set of slides with name Financial Report Vector Icon Ppt PowerPoint Presentation Professional Mockup. This is a one process. The stages in this process are marketing, management, measuring results. This is a completely editable PowerPoint presentation and is available for immediate download. Download now and impress your audience.
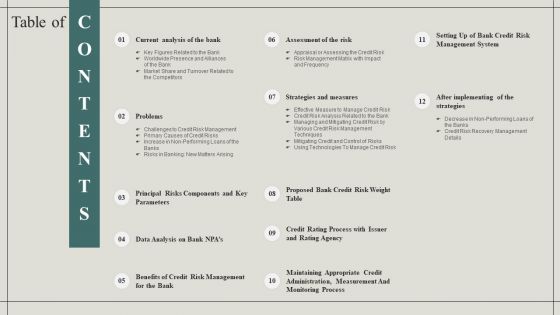
Table Of Contents Effective Financial Risk Management Strategies Download PDF
Deliver and pitch your topic in the best possible manner with this Table Of Contents Effective Financial Risk Management Strategies Download PDF. Use them to share invaluable insights on Strategies And Measures, Principal Risks Components, Data Analysis and impress your audience. This template can be altered and modified as per your expectations. So, grab it now.
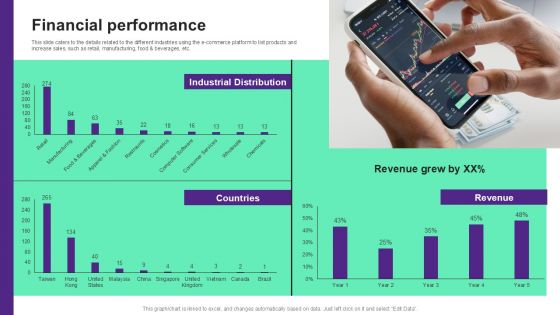
Online Store Investment Pitch Deck Financial Performance Topics PDF
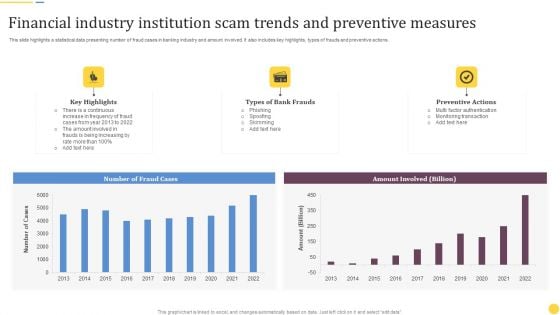
Financial Industry Institution Scam Trends And Preventive Measures Ideas PDF
This slide highlights a statistical data presenting number of fraud cases in banking industry and amount involved. It also includes key highlights, types of frauds and preventive actions. Pitch your topic with ease and precision using this Financial Industry Institution Scam Trends And Preventive Measures Ideas PDF. This layout presents information on Key Highlights, Types Bank Frauds, Preventive Actions. It is also available for immediate download and adjustment. So, changes can be made in the color, design, graphics or any other component to create a unique layout.
Time Saving Financial Service Ppt PowerPoint Presentation Complete Deck
Share a great deal of information on the topic by deploying this time saving financial service ppt powerpoint presentation complete deck. Support your ideas and thought process with this prefabricated set. It includes a set of twelve slides, all fully modifiable and editable. Each slide can be restructured and induced with the information and content of your choice. You can add or remove large content boxes as well, to make this PPT slideshow more personalized. Its high-quality graphics and visuals help in presenting a well-coordinated pitch. This PPT template is also a resourceful tool to take visual cues from and implement the best ideas to help your business grow and expand. The main attraction of this well-formulated deck is that everything is editable, giving you the freedom to adjust it to your liking and choice. Changes can be made in the background and theme as well to deliver an outstanding pitch. Therefore, click on the download button now to gain full access to this multifunctional set.
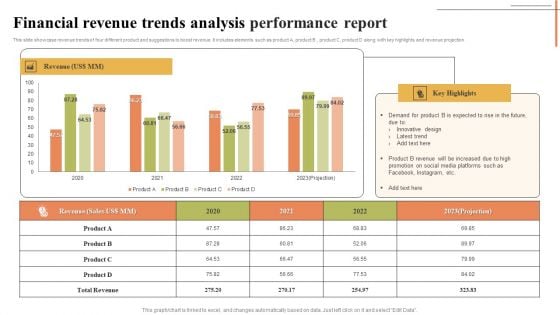
Financial Revenue Trends Analysis Performance Report Designs PDF
This slide showcase revenue trends of four different product and suggestions to boost revenue. It includes elements such as product A, product B , product C, product D along with key highlights and revenue projection. Showcasing this set of slides titled Financial Revenue Trends Analysis Performance Report Designs PDF. The topics addressed in these templates are Revenue, Innovative Design, Latest Trend. All the content presented in this PPT design is completely editable. Download it and make adjustments in color, background, font etc. as per your unique business setting.
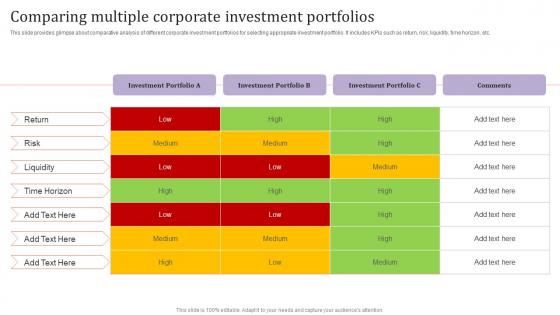
Comparing Multiple Corporate Investment Assessing Corporate Financial Techniques Introduction Pdf
This slide provides glimpse about comparative analysis of different corporate investment portfolios for selecting appropriate investment portfolio. It includes KPIs such as return, risk, liquidity, time horizon, etc. Crafting an eye catching presentation has never been more straightforward. Let your presentation shine with this tasteful yet straightforward Comparing Multiple Corporate Investment Assessing Corporate Financial Techniques Introduction Pdf template. It offers a minimalistic and classy look that is great for making a statement. The colors have been employed intelligently to add a bit of playfulness while still remaining professional. Construct the ideal Comparing Multiple Corporate Investment Assessing Corporate Financial Techniques Introduction Pdf that effortlessly grabs the attention of your audience Begin now and be certain to wow your customers This slide provides glimpse about comparative analysis of different corporate investment portfolios for selecting appropriate investment portfolio. It includes KPIs such as return, risk, liquidity, time horizon, etc.
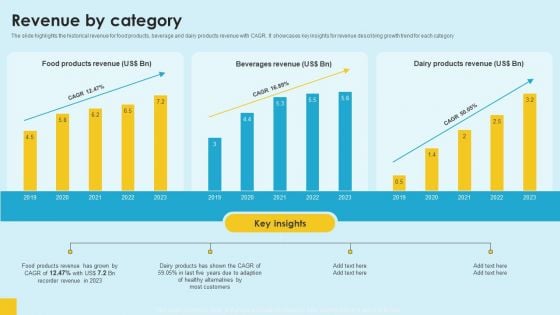
Food Company Financial Performance Summary Revenue By Category Introduction PDF
The slide highlights the historical revenue for food products, beverage and dairy products revenue with CAGR. It showcases key insights for revenue describing growth trend for each category. Boost your pitch with our creative Food Company Financial Performance Summary Revenue By Category Introduction PDF. Deliver an awe-inspiring pitch that will mesmerize everyone. Using these presentation templates you will surely catch everyones attention. You can browse the ppts collection on our website. We have researchers who are experts at creating the right content for the templates. So you do not have to invest time in any additional work. Just grab the template now and use them.
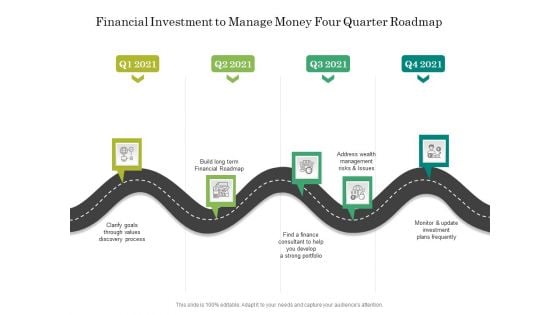
Financial Investment To Manage Money Four Quarter Roadmap Formats
Presenting our innovatively-structured financial investment to manage money four quarter roadmap formats Template. Showcase your roadmap process in different formats like PDF, PNG, and JPG by clicking the download button below. This PPT design is available in both Standard Screen and Widescreen aspect ratios. It can also be easily personalized and presented with modified font size, font type, color, and shapes to measure your progress in a clear way.
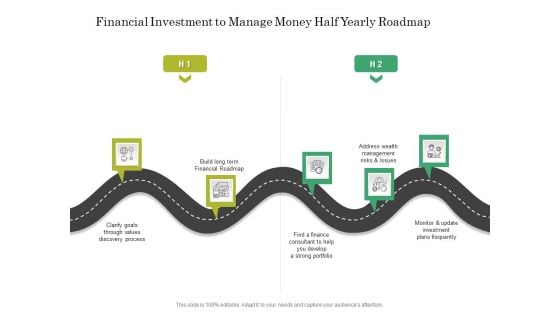
Financial Investment To Manage Money Half Yearly Roadmap Structure
Introducing our financial investment to manage money half yearly roadmap structure. This PPT presentation is Google Slides compatible, therefore, you can share it easily with the collaborators for measuring the progress. Also, the presentation is available in both standard screen and widescreen aspect ratios. So edit the template design by modifying the font size, font type, color, and shapes as per your requirements. As this PPT design is fully editable it can be presented in PDF, JPG and PNG formats.
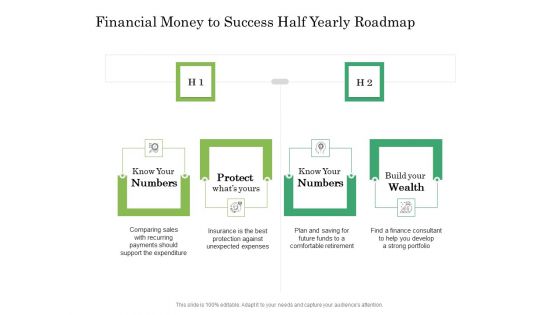
Financial Money To Success Half Yearly Roadmap Download
Presenting our innovatively-structured financial money to success half yearly roadmap download Template. Showcase your roadmap process in different formats like PDF, PNG, and JPG by clicking the download button below. This PPT design is available in both Standard Screen and Widescreen aspect ratios. It can also be easily personalized and presented with modified font size, font type, color, and shapes to measure your progress in a clear way.
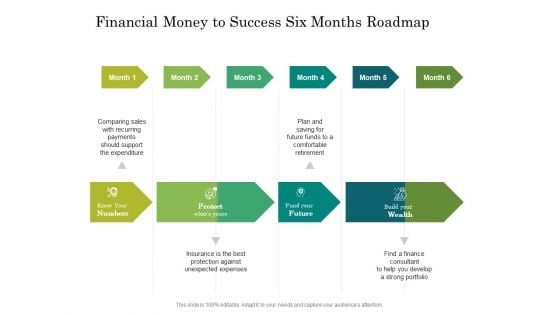
Financial Money To Success Six Months Roadmap Infographics
Introducing our financial money to success six months roadmap infographics. This PPT presentation is Google Slides compatible, therefore, you can share it easily with the collaborators for measuring the progress. Also, the presentation is available in both standard screen and widescreen aspect ratios. So edit the template design by modifying the font size, font type, color, and shapes as per your requirements. As this PPT design is fully editable it can be presented in PDF, JPG and PNG formats.
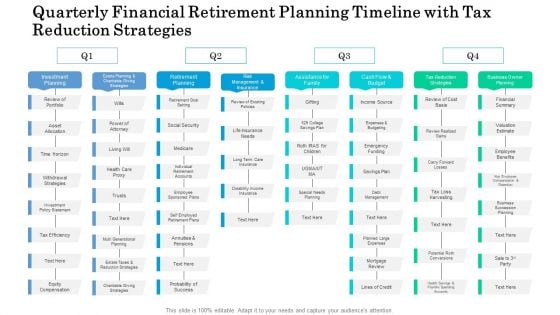
Quarterly Financial Retirement Planning Timeline With Tax Reduction Strategies Microsoft
Presenting our innovatively structured quarterly financial retirement planning timeline with tax reduction strategies microsoft Template. Showcase your roadmap process in different formats like PDF, PNG, and JPG by clicking the download button below. This PPT design is available in both Standard Screen and Widescreen aspect ratios. It can also be easily personalized and presented with modified font size, font type, color, and shapes to measure your progress in a clear way.
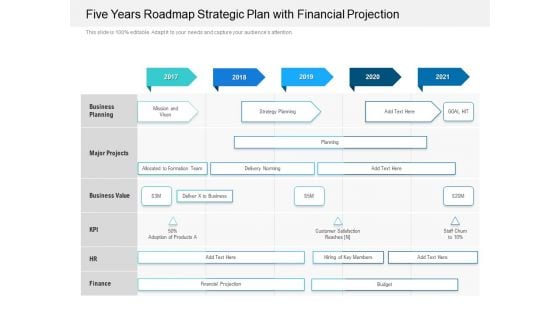
Five Years Roadmap Strategic Plan With Financial Projection Graphics
Introducing our five years roadmap strategic plan with financial projection graphics. This PPT presentation is Google Slides compatible, therefore, you can share it easily with the collaborators for measuring the progress. Also, the presentation is available in both standard screen and widescreen aspect ratios. So edit the template design by modifying the font size, font type, color, and shapes as per your requirements. As this PPT design is fully editable it can be presented in PDF, JPG and PNG formats.
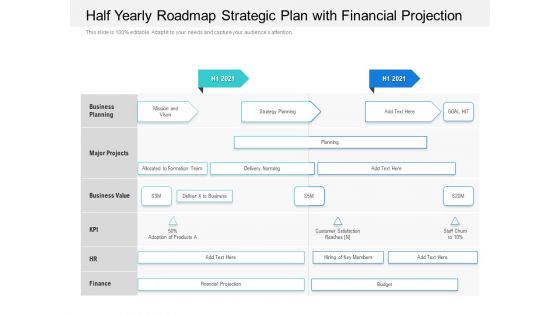
Half Yearly Roadmap Strategic Plan With Financial Projection Information
Introducing our half yearly roadmap strategic plan with financial projection information. This PPT presentation is Google Slides compatible, therefore, you can share it easily with the collaborators for measuring the progress. Also, the presentation is available in both standard screen and widescreen aspect ratios. So edit the template design by modifying the font size, font type, color, and shapes as per your requirements. As this PPT design is fully editable it can be presented in PDF, JPG and PNG formats.
Quarterly Roadmap Strategic Plan With Financial Projection Icons
Introducing our quarterly roadmap strategic plan with financial projection icons. This PPT presentation is Google Slides compatible, therefore, you can share it easily with the collaborators for measuring the progress. Also, the presentation is available in both standard screen and widescreen aspect ratios. So edit the template design by modifying the font size, font type, color, and shapes as per your requirements. As this PPT design is fully editable it can be presented in PDF, JPG and PNG formats.
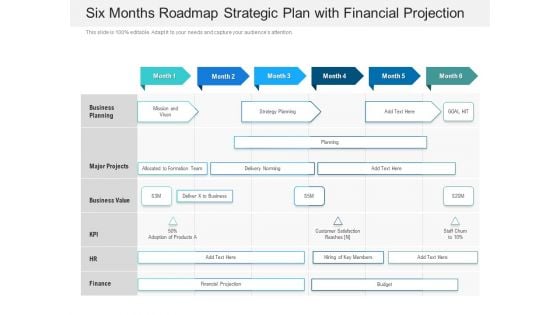
Six Months Roadmap Strategic Plan With Financial Projection Sample
Introducing our six months roadmap strategic plan with financial projection sample. This PPT presentation is Google Slides compatible, therefore, you can share it easily with the collaborators for measuring the progress. Also, the presentation is available in both standard screen and widescreen aspect ratios. So edit the template design by modifying the font size, font type, color, and shapes as per your requirements. As this PPT design is fully editable it can be presented in PDF, JPG and PNG formats.
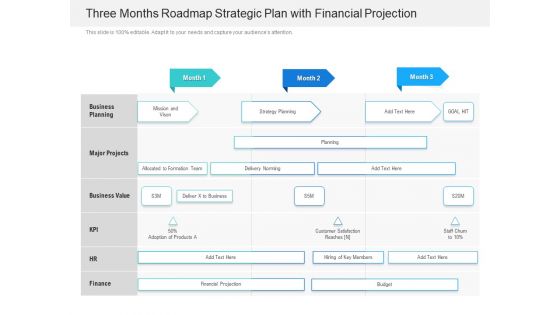
Three Months Roadmap Strategic Plan With Financial Projection Elements
Introducing our three months roadmap strategic plan with financial projection elements. This PPT presentation is Google Slides compatible, therefore, you can share it easily with the collaborators for measuring the progress. Also, the presentation is available in both standard screen and widescreen aspect ratios. So edit the template design by modifying the font size, font type, color, and shapes as per your requirements. As this PPT design is fully editable it can be presented in PDF, JPG and PNG formats.
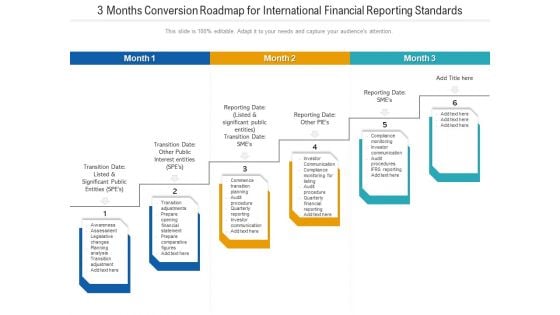
3 Months Conversion Roadmap For International Financial Reporting Standards Introduction
Introducing our 3 months conversion roadmap for international financial reporting standards introduction. This PPT presentation is Google Slides compatible, therefore, you can share it easily with the collaborators for measuring the progress. Also, the presentation is available in both standard screen and widescreen aspect ratios. So edit the template design by modifying the font size, font type, color, and shapes as per your requirements. As this PPT design is fully editable it can be presented in PDF, JPG and PNG formats.
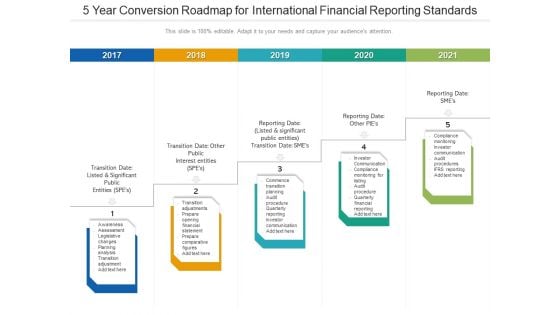
5 Year Conversion Roadmap For International Financial Reporting Standards Formats
Introducing our 5 year conversion roadmap for international financial reporting standards formats. This PPT presentation is Google Slides compatible, therefore, you can share it easily with the collaborators for measuring the progress. Also, the presentation is available in both standard screen and widescreen aspect ratios. So edit the template design by modifying the font size, font type, color, and shapes as per your requirements. As this PPT design is fully editable it can be presented in PDF, JPG and PNG formats.
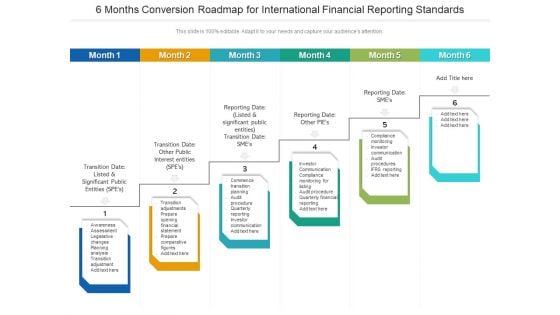
6 Months Conversion Roadmap For International Financial Reporting Standards Summary
Introducing our 6 months conversion roadmap for international financial reporting standards summary. This PPT presentation is Google Slides compatible, therefore, you can share it easily with the collaborators for measuring the progress. Also, the presentation is available in both standard screen and widescreen aspect ratios. So edit the template design by modifying the font size, font type, color, and shapes as per your requirements. As this PPT design is fully editable it can be presented in PDF, JPG and PNG formats.
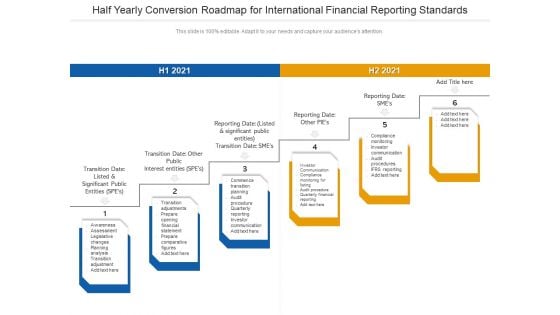
Half Yearly Conversion Roadmap For International Financial Reporting Standards Rules
Introducing our half yearly conversion roadmap for international financial reporting standards rules. This PPT presentation is Google Slides compatible, therefore, you can share it easily with the collaborators for measuring the progress. Also, the presentation is available in both standard screen and widescreen aspect ratios. So edit the template design by modifying the font size, font type, color, and shapes as per your requirements. As this PPT design is fully editable it can be presented in PDF, JPG and PNG formats.
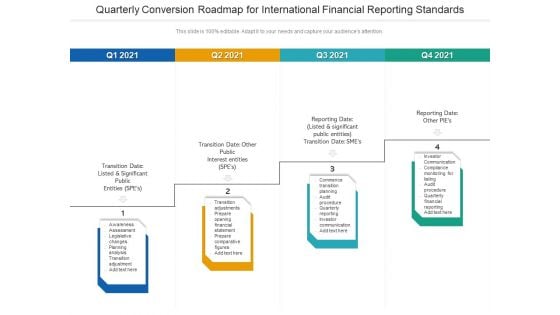
Quarterly Conversion Roadmap For International Financial Reporting Standards Rules
Introducing our quarterly conversion roadmap for international financial reporting standards rules. This PPT presentation is Google Slides compatible, therefore, you can share it easily with the collaborators for measuring the progress. Also, the presentation is available in both standard screen and widescreen aspect ratios. So edit the template design by modifying the font size, font type, color, and shapes as per your requirements. As this PPT design is fully editable it can be presented in PDF, JPG and PNG formats.
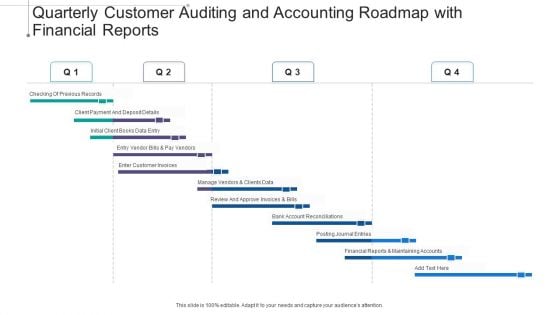
Quarterly Customer Auditing And Accounting Roadmap With Financial Reports Portrait
Presenting our innovatively structured quarterly customer auditing and accounting roadmap with financial reports portrait Template. Showcase your roadmap process in different formats like PDF, PNG, and JPG by clicking the download button below. This PPT design is available in both Standard Screen and Widescreen aspect ratios. It can also be easily personalized and presented with modified font size, font type, color, and shapes to measure your progress in a clear way.
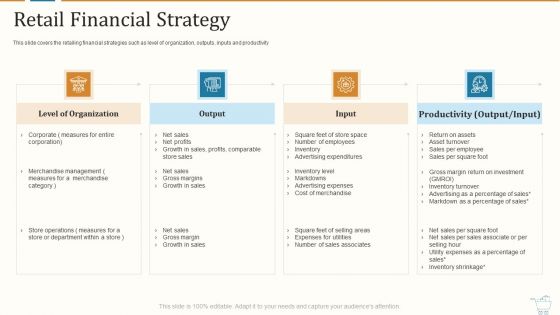
Marketing Strategies For Retail Store Retail Financial Strategy Inspiration PDF
This is a marketing strategies for retail store retail financial strategy inspiration pdf. template with various stages. Focus and dispense information on four stages using this creative set, that comes with editable features. It contains large content boxes to add your information on topics like level of organization, productivity output or input, corporate measures for entire corporation. You can also showcase facts, figures, and other relevant content using this PPT layout. Grab it now.
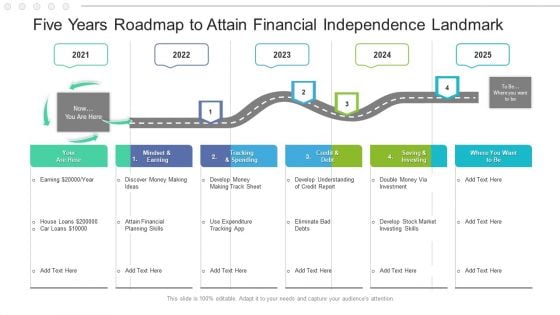
Five Years Roadmap To Attain Financial Independence Landmark Portrait
Presenting our innovatively structured five years roadmap to attain financial independence landmark portrait Template. Showcase your roadmap process in different formats like PDF, PNG, and JPG by clicking the download button below. This PPT design is available in both Standard Screen and Widescreen aspect ratios. It can also be easily personalized and presented with modified font size, font type, color, and shapes to measure your progress in a clear way.
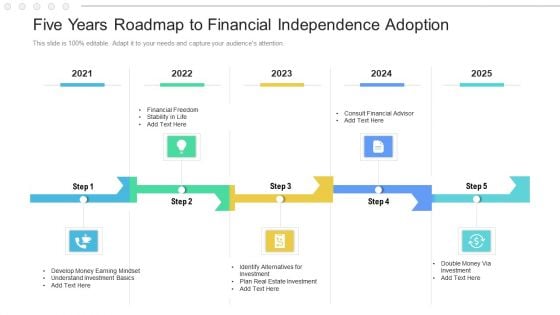
Five Years Roadmap To Financial Independence Adoption Sample
Introducing our five years roadmap to financial independence adoption sample. This PPT presentation is Google Slides compatible, therefore, you can share it easily with the collaborators for measuring the progress. Also, the presentation is available in both standard screen and widescreen aspect ratios. So edit the template design by modifying the font size, font type, color, and shapes as per your requirements. As this PPT design is fully editable it can be presented in PDF, JPG and PNG formats.
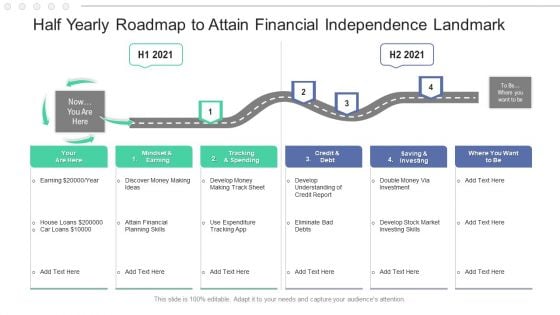
Half Yearly Roadmap To Attain Financial Independence Landmark Introduction
Presenting our innovatively structured half yearly roadmap to attain financial independence landmark introduction Template. Showcase your roadmap process in different formats like PDF, PNG, and JPG by clicking the download button below. This PPT design is available in both Standard Screen and Widescreen aspect ratios. It can also be easily personalized and presented with modified font size, font type, color, and shapes to measure your progress in a clear way.
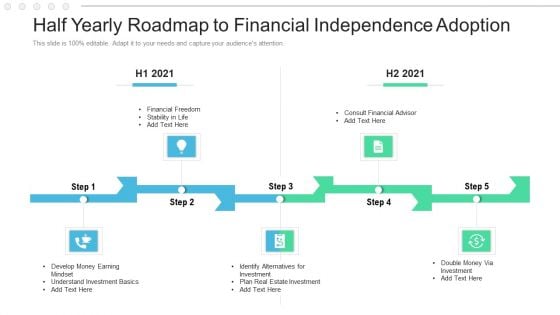
Half Yearly Roadmap To Financial Independence Adoption Mockup
Introducing our half yearly roadmap to financial independence adoption mockup. This PPT presentation is Google Slides compatible, therefore, you can share it easily with the collaborators for measuring the progress. Also, the presentation is available in both standard screen and widescreen aspect ratios. So edit the template design by modifying the font size, font type, color, and shapes as per your requirements. As this PPT design is fully editable it can be presented in PDF, JPG and PNG formats.
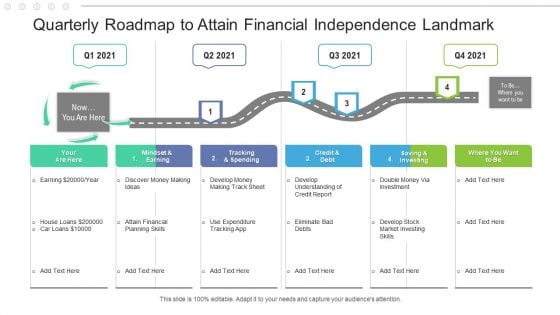
Quarterly Roadmap To Attain Financial Independence Landmark Structure
Presenting our innovatively structured quarterly roadmap to attain financial independence landmark structure Template. Showcase your roadmap process in different formats like PDF, PNG, and JPG by clicking the download button below. This PPT design is available in both Standard Screen and Widescreen aspect ratios. It can also be easily personalized and presented with modified font size, font type, color, and shapes to measure your progress in a clear way.
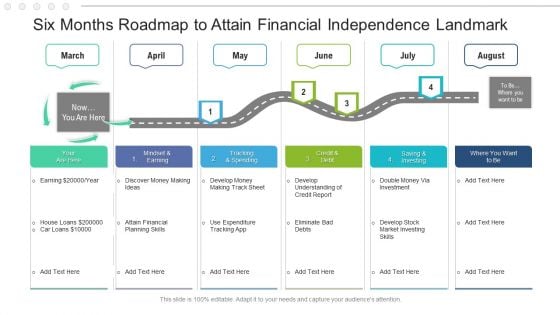
Six Months Roadmap To Attain Financial Independence Landmark Formats
Presenting our innovatively structured six months roadmap to attain financial independence landmark formats Template. Showcase your roadmap process in different formats like PDF, PNG, and JPG by clicking the download button below. This PPT design is available in both Standard Screen and Widescreen aspect ratios. It can also be easily personalized and presented with modified font size, font type, color, and shapes to measure your progress in a clear way.
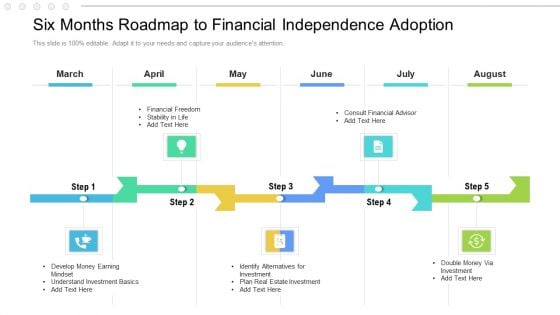
Six Months Roadmap To Financial Independence Adoption Information
Introducing our six months roadmap to financial independence adoption information. This PPT presentation is Google Slides compatible, therefore, you can share it easily with the collaborators for measuring the progress. Also, the presentation is available in both standard screen and widescreen aspect ratios. So edit the template design by modifying the font size, font type, color, and shapes as per your requirements. As this PPT design is fully editable it can be presented in PDF, JPG and PNG formats.
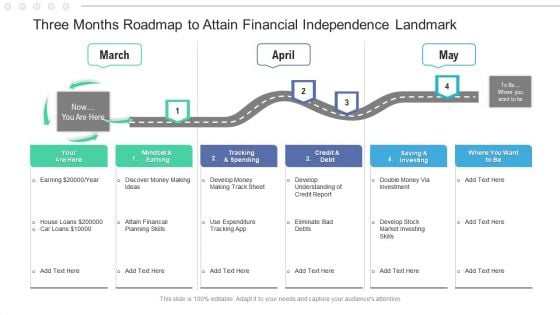
Three Months Roadmap To Attain Financial Independence Landmark Sample
Presenting our innovatively structured three months roadmap to attain financial independence landmark sample Template. Showcase your roadmap process in different formats like PDF, PNG, and JPG by clicking the download button below. This PPT design is available in both Standard Screen and Widescreen aspect ratios. It can also be easily personalized and presented with modified font size, font type, color, and shapes to measure your progress in a clear way.
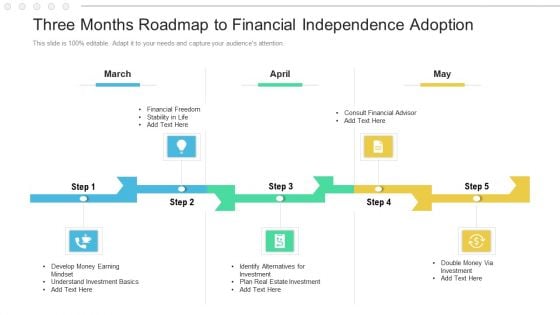
Three Months Roadmap To Financial Independence Adoption Information
Introducing our three months roadmap to financial independence adoption information. This PPT presentation is Google Slides compatible, therefore, you can share it easily with the collaborators for measuring the progress. Also, the presentation is available in both standard screen and widescreen aspect ratios. So edit the template design by modifying the font size, font type, color, and shapes as per your requirements. As this PPT design is fully editable it can be presented in PDF, JPG and PNG formats.
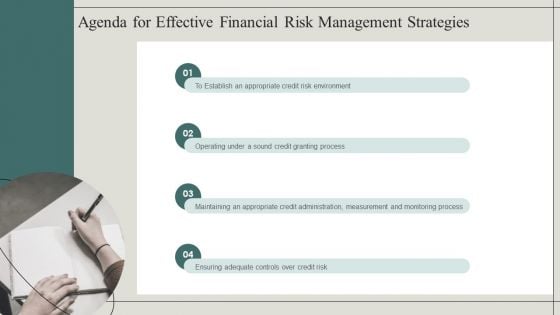
Agenda For Effective Financial Risk Management Strategies Elements PDF
This is a Agenda For Effective Financial Risk Management Strategies Elements PDF template with various stages. Focus and dispense information on four stages using this creative set, that comes with editable features. It contains large content boxes to add your information on topics like Credit Risk Environment, Credit Granting Process, Measurement And Monitoring Process. You can also showcase facts, figures, and other relevant content using this PPT layout. Grab it now.
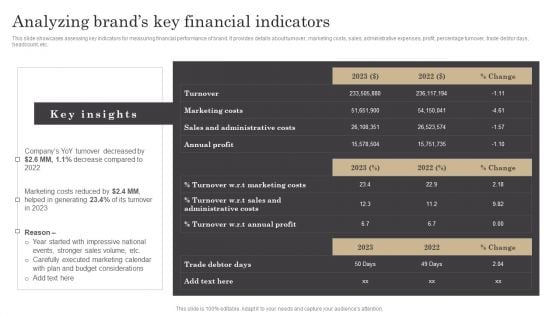
Analyzing Brands Key Financial Indicators Ppt Infographic Template Slides PDF
This slide showcases assessing key indicators for measuring financial performance of brand. It provides details about turnover, marketing costs, sales, administrative expenses, profit, percentage turnover, trade debtor days, headcount, etc. Are you in need of a template that can accommodate all of your creative concepts This one is crafted professionally and can be altered to fit any style. Use it with Google Slides or PowerPoint. Include striking photographs, symbols, depictions, and other visuals. Fill, move around, or remove text boxes as desired. Test out color palettes and font mixtures. Edit and save your work, or work with colleagues. Download Analyzing Brands Key Financial Indicators Ppt Infographic Template Slides PDF and observe how to make your presentation outstanding. Give an impeccable presentation to your group and make your presentation unforgettable.
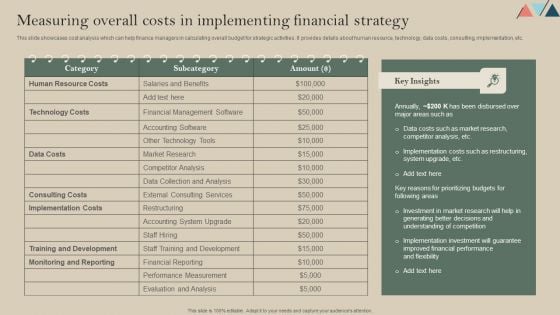
Measuring Overall Costs In Implementing Financial Strategy Themes PDF
This slide showcases cost analysis which can help finance managers in calculating overall budget for strategic activities. It provides details about human resource, technology, data costs, consulting, implementation, etc. Retrieve professionally designed Measuring Overall Costs In Implementing Financial Strategy Themes PDF to effectively convey your message and captivate your listeners. Save time by selecting pre-made slideshows that are appropriate for various topics, from business to educational purposes. These themes come in many different styles, from creative to corporate, and all of them are easily adjustable and can be edited quickly. Access them as PowerPoint templates or as Google Slides themes. You do not have to go on a hunt for the perfect presentation because Slidegeeks got you covered from everywhere.
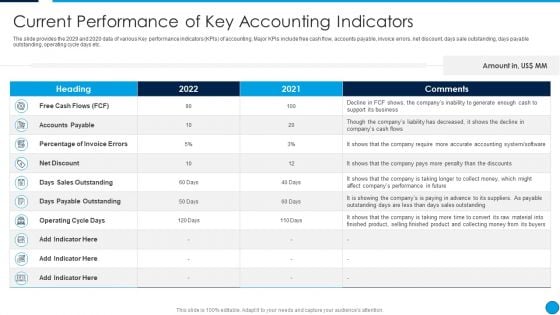
Summary Financial Current Performance Of Key Accounting Indicators Template PDF
The slide provides the 2029 and 2020 data of various Key performance indicators KPIs of accounting. Major KPIs include free cash flow, accounts payable, invoice errors, net discount, days sale outstanding, days payable outstanding, operating cycle days etc. Deliver an awe inspiring pitch with this creative Summary Financial Current Performance Of Key Accounting Indicators Template PDF bundle. Topics like Free Cash Flows, Accounts Payable, Percentage Of Invoice Errors, Net Discount can be discussed with this completely editable template. It is available for immediate download depending on the needs and requirements of the user.
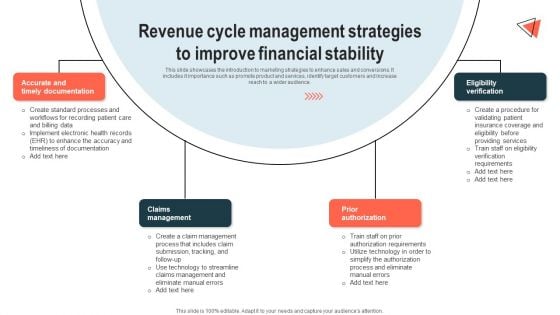
Revenue Cycle Management Strategies To Improve Financial Stability Microsoft PDF
This slide showcases the introduction to marketing strategies to enhance sales and conversions. It includes it importance such as promote product and services, identify target customers and increase reach to a wider audience. From laying roadmaps to briefing everything in detail, our templates are perfect for you. You can set the stage with your presentation slides. All you have to do is download these easy-to-edit and customizable templates. Revenue Cycle Management Strategies To Improve Financial Stability Microsoft PDF will help you deliver an outstanding performance that everyone would remember and praise you for. Do download this presentation today.


 Continue with Email

 Home
Home


