Financial Ratio Analysis
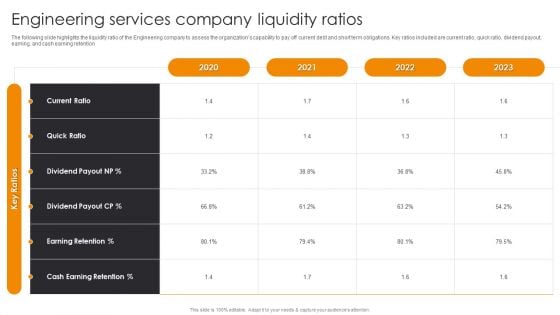
Engineering Services Company Liquidity Ratios Engineering Company Financial Analysis Report Mockup PDF
The following slide highlights the liquidity ratio of the Engineering company to assess the organizations capability to pay off current debt and short term obligations. Key ratios included are current ratio, quick ratio, dividend payout, earning, and cash earning retention.Explore a selection of the finest Engineering Services Company Liquidity Ratios Engineering Company Financial Analysis Report Mockup PDF here. With a plethora of professionally designed and pre-made slide templates, you can quickly and easily find the right one for your upcoming presentation. You can use our Engineering Services Company Liquidity Ratios Engineering Company Financial Analysis Report Mockup PDF to effectively convey your message to a wider audience. Slidegeeks has done a lot of research before preparing these presentation templates. The content can be personalized and the slides are highly editable. Grab templates today from Slidegeeks.
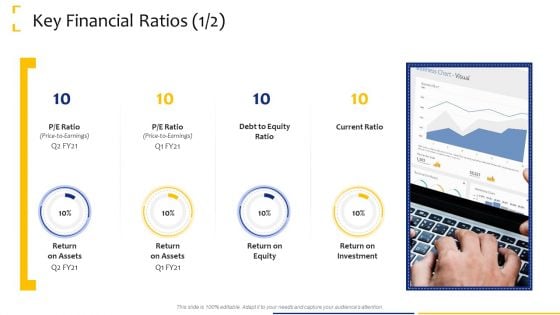
Tactical Analysis Key Financial Ratios Equity Ppt Infographic Template Slide Download PDF
Presenting tactical analysis key financial ratios equity ppt infographic template slide download pdf to provide visual cues and insights. Share and navigate important information on four stages that need your due attention. This template can be used to pitch topics like current ratio, return on investment, return on equity. In addtion, this PPT design contains high resolution images, graphics, etc, that are easily editable and available for immediate download.

Engineering Services Company Profitability Ratios Engineering Company Financial Analysis Report Sample PDF
The following slide highlights the profitability ratio of the Engineering company to assess the organizations capability to earn compared to its revenue. Key ratios included are EBDIT margin, EBIT margin, PBT margin, Net profit margin, and asset turnover percentage.The best PPT templates are a great way to save time, energy, and resources. Slidegeeks have 100 precent editable powerpoint slides making them incredibly versatile. With these quality presentation templates, you can create a captivating and memorable presentation by combining visually appealing slides and effectively communicating your message. Download Engineering Services Company Profitability Ratios Engineering Company Financial Analysis Report Sample PDF from Slidegeeks and deliver a wonderful presentation.
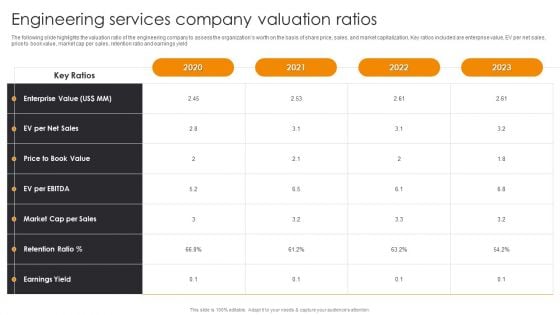
Engineering Services Company Valuation Ratios Engineering Company Financial Analysis Report Brochure PDF
The following slide highlights the valuation ratio of the engineering company to assess the organizations worth on the basis of share price, sales, and market capitalization, Key ratios included are enterprise value, EV per net sales, price to book value, market cap per sales, retention ratio and earnings yield. The Engineering Services Company Valuation Ratios Engineering Company Financial Analysis Report Brochure PDF is a compilation of the most recent design trends as a series of slides. It is suitable for any subject or industry presentation, containing attractive visuals and photo spots for businesses to clearly express their messages. This template contains a variety of slides for the user to input data, such as structures to contrast two elements, bullet points, and slides for written information. Slidegeeks is prepared to create an impression.
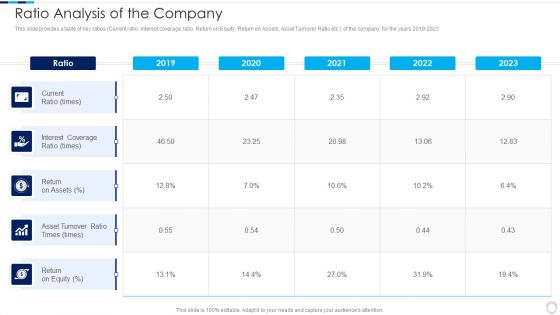
Financial Report Of An IT Firm Ratio Analysis Of The Company Structure PDF
This slide provides a table of key ratios Current ratio, interest coverage ratio, Return on Equity, Return on Assets, Asset Turnover Ratio etc. of the company, for the years 2019 to 2023.Deliver an awe inspiring pitch with this creative Financial Report Of An IT Firm Ratio Analysis Of The Company Structure PDF bundle. Topics like Interest Coverage, Asset Turnover, Return Equity can be discussed with this completely editable template. It is available for immediate download depending on the needs and requirements of the user.
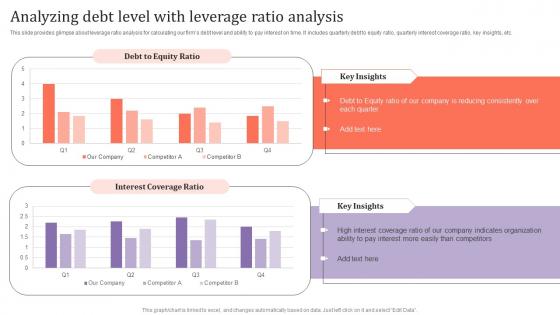
Analyzing Debt Level With Leverage Ratio Analysis Assessing Corporate Financial Techniques Designs Pdf
This slide provides glimpse about leverage ratio analysis for calculating our firms debt level and ability to pay interest on time. It includes quarterly debt to equity ratio, quarterly interest coverage ratio, key insights, etc. There are so many reasons you need a Analyzing Debt Level With Leverage Ratio Analysis Assessing Corporate Financial Techniques Designs Pdf. The first reason is you can not spend time making everything from scratch, Thus, Slidegeeks has made presentation templates for you too. You can easily download these templates from our website easily. This slide provides glimpse about leverage ratio analysis for calculating our firms debt level and ability to pay interest on time. It includes quarterly debt to equity ratio, quarterly interest coverage ratio, key insights, etc.
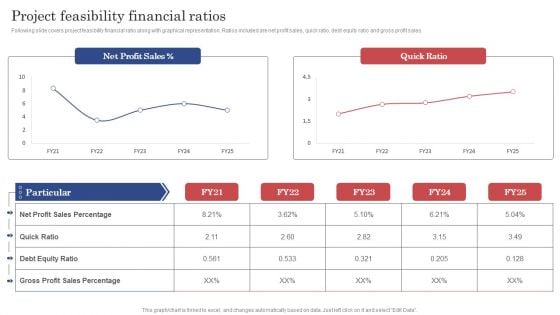
Construction Project Cost Benefit Analysis Report Project Feasibility Financial Ratios Ideas PDF
Following slide covers project feasibility financial ratio along with graphical representation. Ratios included are net profit sales, quick ratio, debt equity ratio and gross profit sales. Presenting this PowerPoint presentation, titled Construction Project Cost Benefit Analysis Report Project Feasibility Financial Ratios Ideas PDF, with topics curated by our researchers after extensive research. This editable presentation is available for immediate download and provides attractive features when used. Download now and captivate your audience. Presenting this Construction Project Cost Benefit Analysis Report Project Feasibility Financial Ratios Ideas PDF. Our researchers have carefully researched and created these slides with all aspects taken into consideration. This is a completely customizable Construction Project Cost Benefit Analysis Report Project Feasibility Financial Ratios Ideas PDF that is available for immediate downloading. Download now and make an impact on your audience. Highlight the attractive features available with our PPTs.
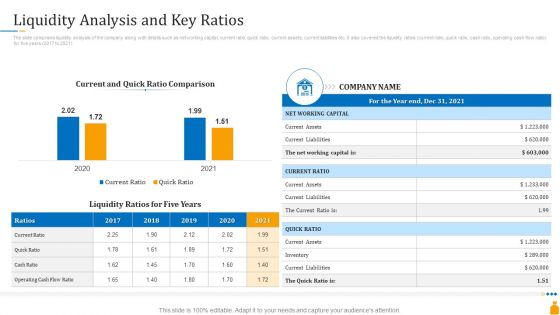
Financial Banking PPT Liquidity Analysis And Key Ratios Ppt Show Layouts PDF
The slide comprises liquidity analysis of the company along with details such as networking capital, current ratio, quick ratio, current assets, current liabilities etc. It also covered the liquidity ratios current ratio, quick ratio, cash ratio, operating cash flow ratio for five years 2017 to 2021. Deliver an awe-inspiring pitch with this creative financial banking ppt liquidity analysis and key ratios ppt show layouts pdf bundle. Topics like liquidity analysis and key ratios can be discussed with this completely editable template. It is available for immediate download depending on the needs and requirements of the user.
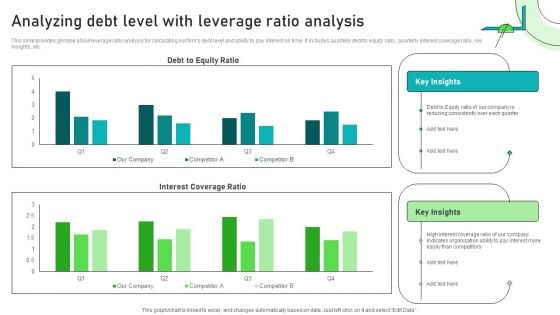
Adjusting Financial Strategies And Planning Analyzing Debt Level With Leverage Ratio Analysis Designs PDF
This slide provides glimpse about leverage ratio analysis for calculating our firms debt level and ability to pay interest on time. It includes quarterly debt to equity ratio, quarterly interest coverage ratio, key insights, etc. Crafting an eye catching presentation has never been more straightforward. Let your presentation shine with this tasteful yet straightforward Adjusting Financial Strategies And Planning Analyzing Debt Level With Leverage Ratio Analysis Designs PDF template. It offers a minimalistic and classy look that is great for making a statement. The colors have been employed intelligently to add a bit of playfulness while still remaining professional. Construct the ideal Adjusting Financial Strategies And Planning Analyzing Debt Level With Leverage Ratio Analysis Designs PDF that effortlessly grabs the attention of your audience. Begin now and be certain to wow your customers.
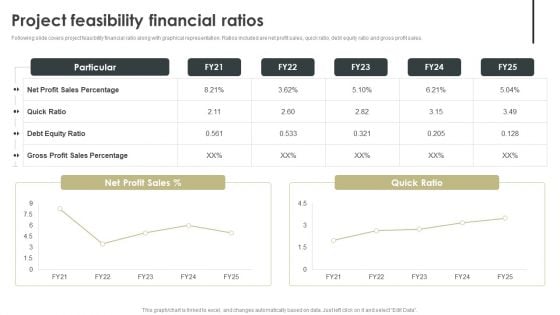
Construction Project Cost Benefit Analysis Report For Mortgage Approval Project Feasibility Financial Ratios Topics PDF
Following slide covers project feasibility financial ratio along with graphical representation. Ratios included are net profit sales, quick ratio, debt equity ratio and gross profit sales. Presenting this PowerPoint presentation, titled Construction Project Cost Benefit Analysis Report For Mortgage Approval Project Feasibility Financial Ratios Topics PDF, with topics curated by our researchers after extensive research. This editable presentation is available for immediate download and provides attractive features when used. Download now and captivate your audience. Presenting this Construction Project Cost Benefit Analysis Report For Mortgage Approval Project Feasibility Financial Ratios Topics PDF. Our researchers have carefully researched and created these slides with all aspects taken into consideration. This is a completely customizable Construction Project Cost Benefit Analysis Report For Mortgage Approval Project Feasibility Financial Ratios Topics PDF that is available for immediate downloading. Download now and make an impact on your audience. Highlight the attractive features available with our PPTs.
Bar Graph With Financial Ratio And Icons Powerpoint Template
Visually support your presentation with our above template containing bar graph with icons. This diagram slide helps to exhibit financial ratio analysis. Etch your views in the brains of your audience with this diagram slide.
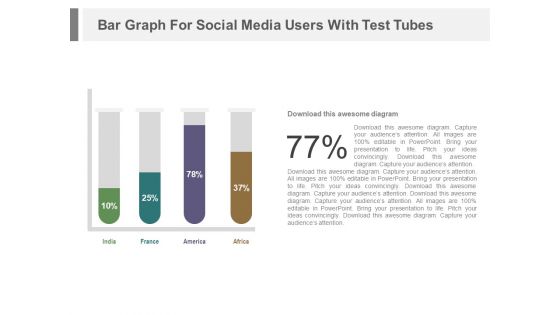
Test Tubes With Financial Data In Percentage Ratio Powerpoint Slides
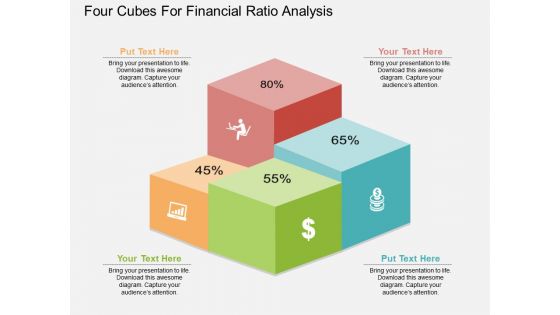
Four Cubes For Fnancial Ratio Analysis Powerpoint Template
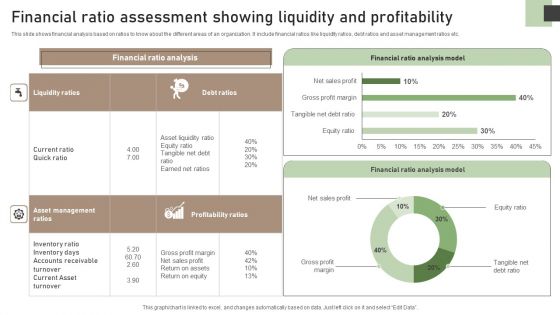
Financial Ratio Assessment Showing Liquidity And Profitability Brochure PDF
This slide shows financial analysis based on ratios to know about the different areas of an organization. It include financial ratios like liquidity ratios, debt ratios and asset management ratios etc. Showcasing this set of slides titled Financial Ratio Assessment Showing Liquidity And Profitability Brochure PDF. The topics addressed in these templates are Financial Ratio Analysis, Equity Ratio, Tangible Net Debt Ratio. All the content presented in this PPT design is completely editable. Download it and make adjustments in color, background, font etc. as per your unique business setting.
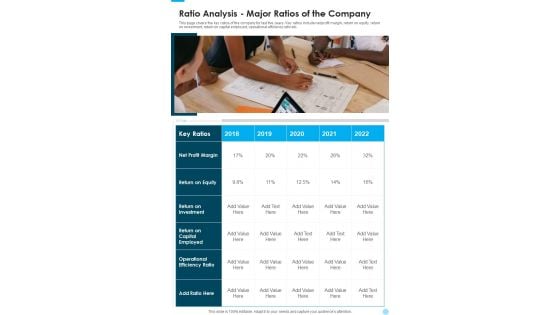
Ratio Analysis Major Ratios Of The Company One Pager Documents
This page covers the key ratios of the company for last five years. Key ratios include net profit margin, return on equity, return on investment, return on capital employed, operational efficiency ratio etc. Presenting you an exemplary Ratio Analysis Major Ratios Of The Company One Pager Documents. Our one-pager comprises all the must-have essentials of an inclusive document. You can edit it with ease, as its layout is completely editable. With such freedom, you can tweak its design and other elements to your requirements. Download this Ratio Analysis Major Ratios Of The Company One Pager Documents brilliant piece now.
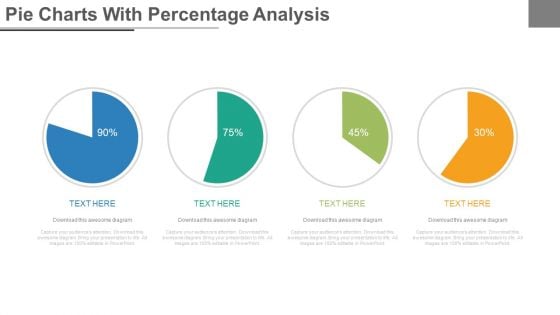
Four Steps Pie Charts For Financial Analysis Powerpoint Slides
Four pie charts have been displayed in this business slide. This PowerPoint template helps to exhibit financial ratio analysis. Use this diagram slide to build an exclusive presentation.
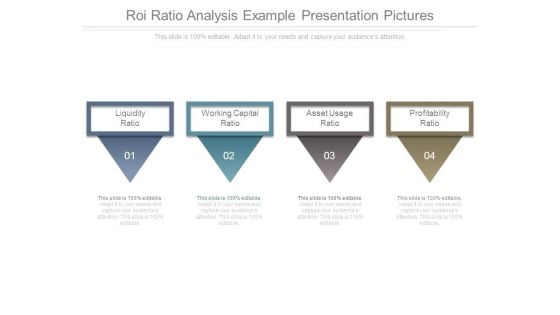
Roi Ratio Analysis Example Presentation Pictures
This is a roi ratio analysis example presentation pictures. This is a four stage process. The stages in this process are liquidity ratio, working capital ratio, asset usage ratio, profitability ratio.
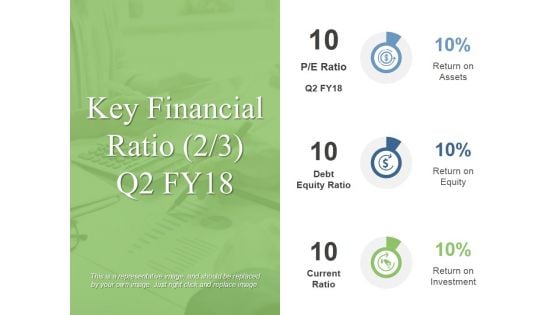
Key Financial Ratio Template 2 Ppt PowerPoint Presentation Summary Influencers
This is a key financial ratio template 2 ppt powerpoint presentation summary influencers. This is a three stage process. The stages in this process are return on assets, return on equity, return on investment.

Financial Analysis Tools Ppt Templates
This is a financial analysis tools ppt templates. This is a three stage process. The stages in this process are horizontal analysis, vertical analysis, ratio analysis.
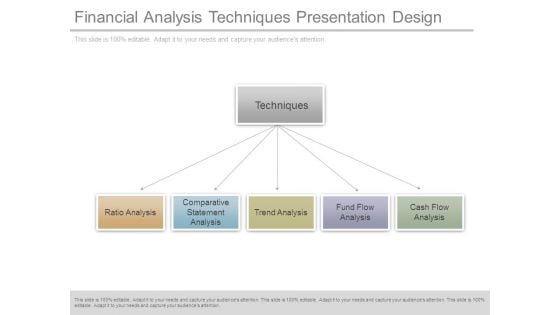
Financial Analysis Techniques Presentation Design
This is a financial analysis techniques presentation design. This is a five stage process. The stages in this process are techniques, ratio analysis, comparative statement analysis, trend analysis, fund flow analysis, cash flow analysis.
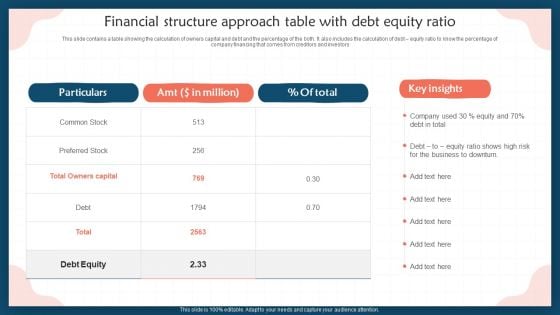
Financial Structure Approach Table With Debt Equity Ratio Professional PDF
This slide contains a table showing the calculation of owners capital and debt and the percentage of the both. It also includes the calculation of debt equity ratio to know the percentage of company financing that comes from creditors and investors. Showcasing this set of slides titled Financial Structure Approach Table With Debt Equity Ratio Professional PDF. The topics addressed in these templates are Preferred Stock, Debt, Debt Equity. All the content presented in this PPT design is completely editable. Download it and make adjustments in color, background, font etc. as per your unique business setting.
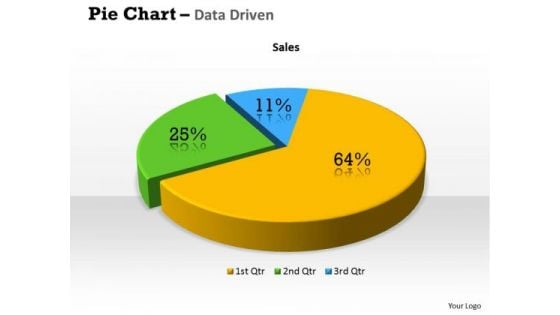
Quantitative Data Analysis 3d Percentage Ratio Pie Chart PowerPoint Templates
Plan Your Storyboard With Our quantitative data analysis 3d percentage ratio pie chart Powerpoint Templates . Give An Outline To The Solutions You Have.
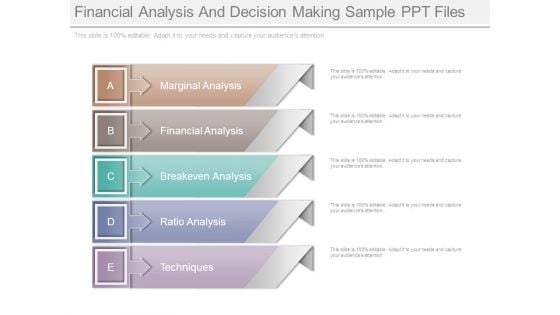
Financial Analysis And Decision Making Sample Ppt Files
This is a financial analysis and decision making sample ppt files. This is a five stage process. The stages in this process are marginal analysis, financial analysis, breakeven analysis, ratio analysis, techniques.
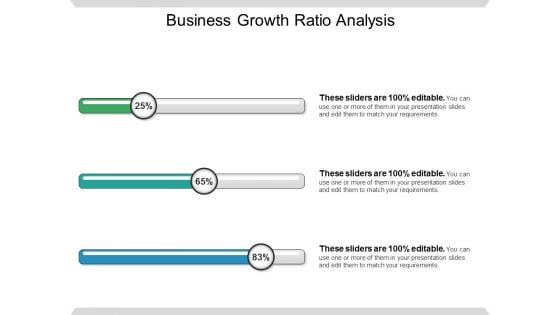
Business Growth Ratio Analysis Ppt PowerPoint Presentation Gallery Design Templates
This is a business growth ratio analysis ppt powerpoint presentation gallery design templates. This is a three stage process. The stages in this process are cost reduction strategies.
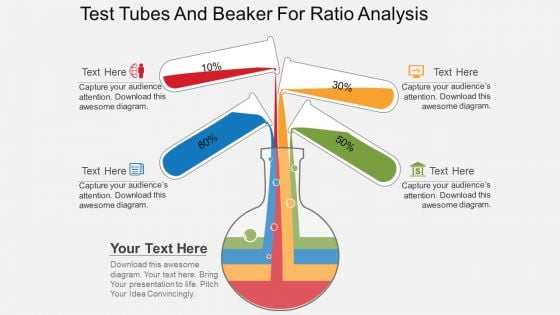
Test Tubes And Beaker For Ratio Analysis Powerpoint Template
Visually support your presentation with our above template containing diagram of test tubes and beaker. This diagram is excellent visual tools for explaining ratio analysis. Use this diagram to make interactive presentations.
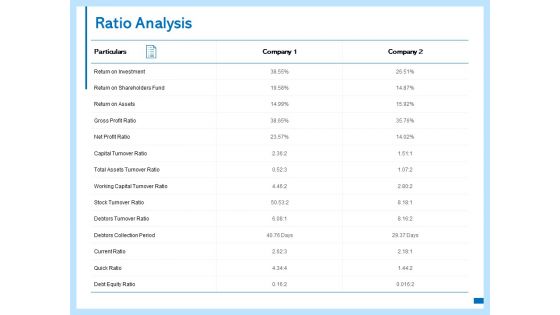
Ratio Analysis Investment Ppt PowerPoint Presentation Pictures Summary
Presenting this set of slides with name ratio analysis investment ppt powerpoint presentation pictures summary. The topics discussed in these slides are investment, return, assets, gross profit ratio, net profit ratio, capital turnover ratio, working capital turnover ratio, debt equity ratio. This is a completely editable PowerPoint presentation and is available for immediate download. Download now and impress your audience.

Ratio Analysis Debtors Collection Ppt PowerPoint Presentation Outline Styles
Presenting this set of slides with name ratio analysis debtors collection ppt powerpoint presentation outline styles. The topics discussed in these slides are investment, working capital, debtors collection, capital turnover, stock turnover. This is a completely editable PowerPoint presentation and is available for immediate download. Download now and impress your audience.
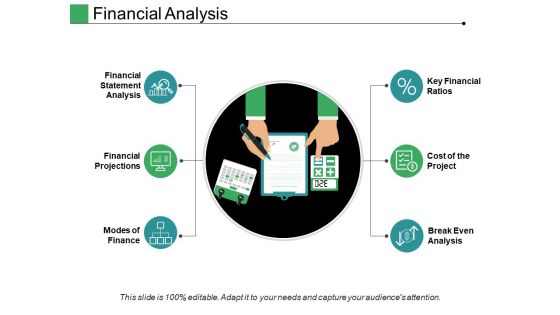
Financial Analysis Ppt PowerPoint Presentation Inspiration Designs Download
This is a financial analysis ppt powerpoint presentation inspiration designs download. This is a six stage process. The stages in this process are key financial ratios, cost of the project, break even analysis, financial projections.
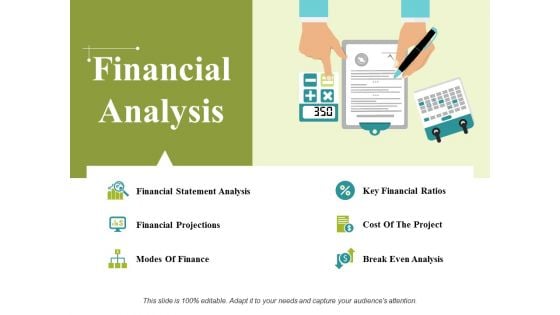
Financial Analysis Ppt PowerPoint Presentation Ideas Background Images
This is a financial analysis ppt powerpoint presentation ideas background images. This is a six stage process. The stages in this process are financial statement analysis, financial projections, modes of finance, key financial ratios, cost of the project.
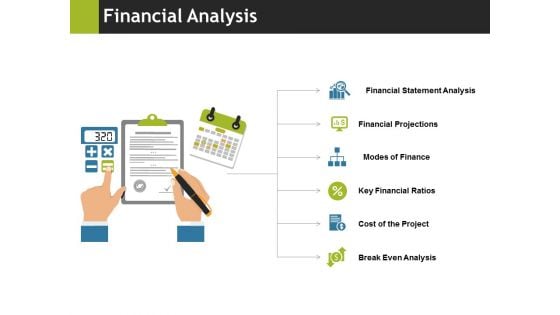
Financial Analysis Ppt PowerPoint Presentation Layouts Visual Aids
This is a financial analysis ppt powerpoint presentation layouts visual aids. This is a six stage process. The stages in this process are financial statement analysis, financial projections, modes of finance, key financial ratios, cost of the project.
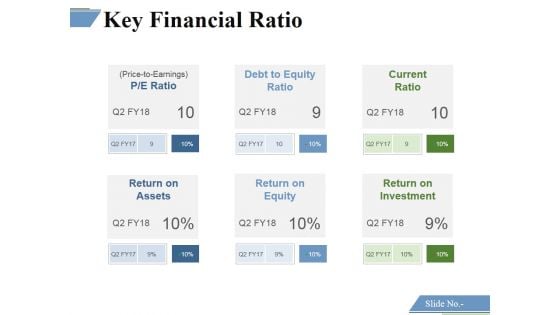
Key Financial Ratio Template 1 Ppt PowerPoint Presentation Visual Aids Slides
This is a key financial ratio template 1 ppt powerpoint presentation visual aids slides. This is a six stage process. The stages in this process are debt to equity ratio, current ratio, return on assets, return on equity, return on investment.
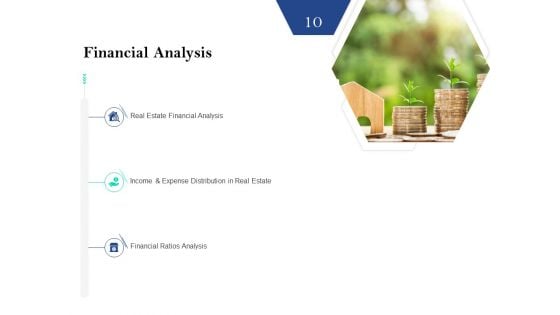
Property Investment Strategies Financial Analysis Ppt PowerPoint Presentation Outline Ideas PDF
Presenting property investment strategies financial analysis ppt powerpoint presentation outline ideas pdf. to provide visual cues and insights. Share and navigate important information on three stages that need your due attention. This template can be used to pitch topics like real estate financial analysis, income and expense distribution in real estate, financial ratios analysis. In addtion, this PPT design contains high resolution images, graphics, etc, that are easily editable and available for immediate download.
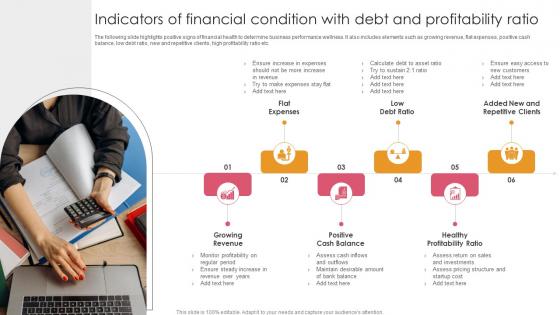
Indicators Of Financial Condition With Debt And Profitability Ratio Ideas Pdf
The following slide highlights positive signs of financial health to determine business performance wellness. It also includes elements such as growing revenue, flat expenses, positive cash balance, low debt ratio, new and repetitive clients, high profitability ratio etc. Pitch your topic with ease and precision using this Indicators Of Financial Condition With Debt And Profitability Ratio Ideas Pdf. This layout presents information on Growing Revenue, Positive Cash Balance, Healthy Profitability Ratio. It is also available for immediate download and adjustment. So, changes can be made in the color, design, graphics or any other component to create a unique layout. The following slide highlights positive signs of financial health to determine business performance wellness. It also includes elements such as growing revenue, flat expenses, positive cash balance, low debt ratio, new and repetitive clients, high profitability ratio etc.
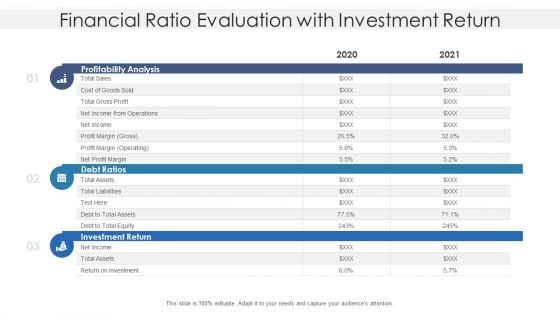
Financial Ratio Evaluation With Investment Return Ppt PowerPoint Presentation File Examples PDF
Showcasing this set of slides titled financial ratio evaluation with investment return ppt powerpoint presentation file examples pdf. The topics addressed in these templates are profitability analysis, debt ratios, investment return. All the content presented in this PPT design is completely editable. Download it and make adjustments in color, background, font etc. as per your unique business setting.
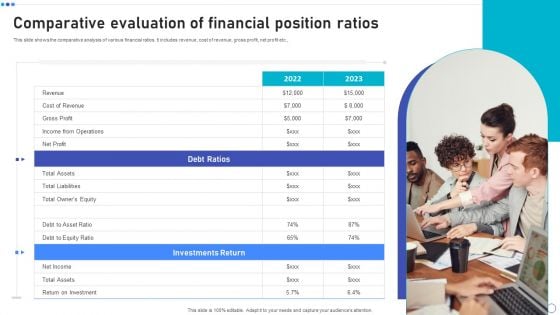
Comparative Evaluation Of Financial Position Ratios Information PDF
This slide shows the comparative analysis of various financial ratios. It includes revenue, cost of revenue, gross profit, net profit etc. Persuade your audience using this Comparative Evaluation Of Financial Position Ratios Information PDF. This PPT design covers two stages, thus making it a great tool to use. It also caters to a variety of topics including Debt Ratios, Investments Return, Net Income. Download this PPT design now to present a convincing pitch that not only emphasizes the topic but also showcases your presentation skills.
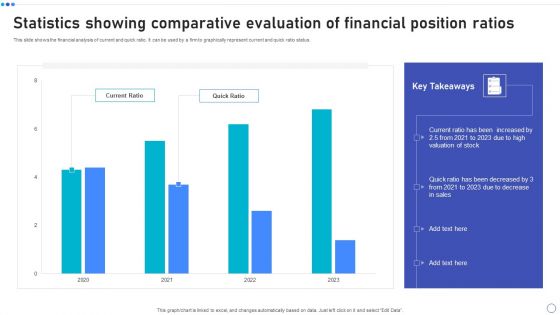
Statistics Showing Comparative Evaluation Of Financial Position Ratios Download PDF
This slide shows the financial analysis of current and quick ratio. It can be used by a firm to graphically represent current and quick ratio status. Pitch your topic with ease and precision using this Statistics Showing Comparative Evaluation Of Financial Position Ratios Download PDF. This layout presents information on Current Ratio, Quick Ratio, 2021 To 2023. It is also available for immediate download and adjustment. So, changes can be made in the color, design, graphics or any other component to create a unique layout.
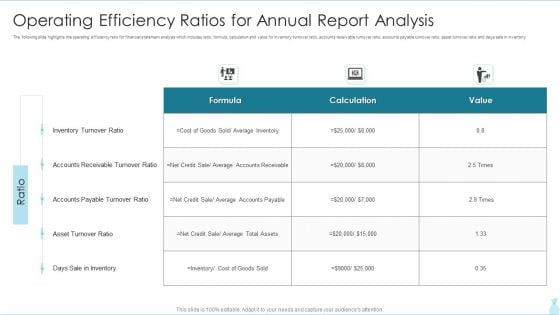
Operating Efficiency Ratios For Annual Report Analysis Elements PDF
The following slide highlights the operating efficiency ratio for financial statement analysis which includes ratio, formula, calculation and value for inventory turnover ratio, accounts receivable turnover ratio, accounts payable turnover ratio, asset turnover ratio and days sale in inventory.Showcasing this set of slides titled Operating Efficiency Ratios For Annual Report Analysis Elements PDF The topics addressed in these templates are Inventory Turnover, Accounts Receivable, Sale In Inventory All the content presented in this PPT design is completely editable. Download it and make adjustments in color, background, font etc. as per your unique business setting.
Graph Icon For Quick And Current Liquidity Ratio Analysis Template PDF
Persuade your audience using this Graph Icon For Quick And Current Liquidity Ratio Analysis Template PDF. This PPT design covers Three stages, thus making it a great tool to use. It also caters to a variety of topics including Graph Icon, Quick And Current, Liquidity Ratio Analysis. Download this PPT design now to present a convincing pitch that not only emphasizes the topic but also showcases your presentation skills.
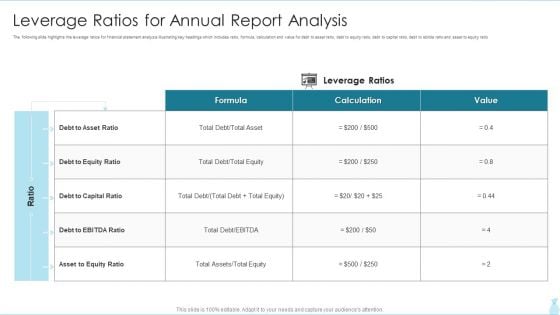
Leverage Ratios For Annual Report Analysis Pictures PDF
The following slide highlights the leverage ratios for financial statement analysis illustrating key headings which includes ratio, formula, calculation and value for debt to asset ratio, debt to equity ratio, debt to capital ratio, debt to ebitda ratio and asset to equity ratio.Pitch your topic with ease and precision using this Leverage Ratios For Annual Report Analysis Pictures PDF This layout presents information on Debt To Asset, Capital Ratio, Asset To Equity It is also available for immediate download and adjustment. So, changes can be made in the color, design, graphics or any other component to create a unique layout.
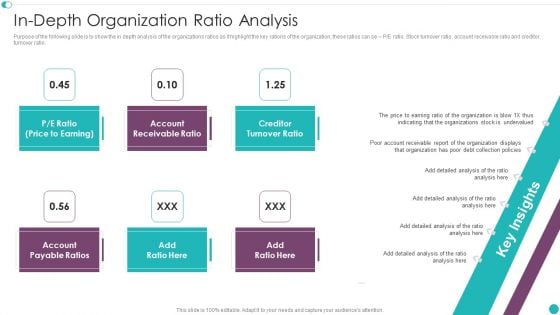
Credit Management And Recovery Policies In Depth Organization Ratio Analysis Demonstration PDF
Purpose of the following slide is to show the in depth analysis of the organizations ratios as it highlight the key rations of the organization, these ratios can be P or E ratio, Stock turnover ratio, account receivable ratio and creditor turnover ratio. Presenting Credit Management And Recovery Policies In Depth Organization Ratio Analysis Demonstration PDF to provide visual cues and insights. Share and navigate important information on six stages that need your due attention. This template can be used to pitch topics like Price To Earning, Account Receivable, Creditor Turnover. In addtion, this PPT design contains high resolution images, graphics, etc, that are easily editable and available for immediate download.
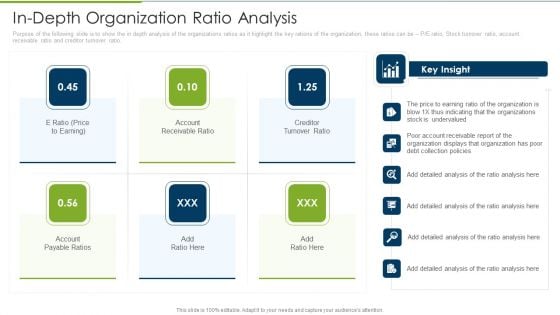
Debt Collection Improvement Plan In Depth Organization Ratio Analysis Background PDF
Purpose of the following slide is to show the in depth analysis of the organizations ratios as it highlight the key rations of the organization, these ratios can be P or E ratio, Stock turnover ratio, account receivable ratio and creditor turnover ratio. Presenting debt collection improvement plan in depth organization ratio analysis background pdf to provide visual cues and insights. Share and navigate important information on six stages that need your due attention. This template can be used to pitch topics like e ratio, price to earning, account receivable ratio, creditor turnover ratio, account payable ratios. In addtion, this PPT design contains high resolution images, graphics, etc, that are easily editable and available for immediate download.
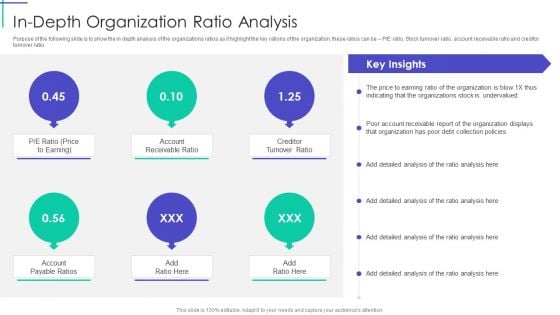
Mortgage Recovery Strategy For Finance Companies In Depth Organization Ratio Analysis Portrait PDF
Purpose of the following slide is to show the in depth analysis of the organizations ratios as it highlight the key rations of the organization, these ratios can be P or E ratio, Stock turnover ratio, account receivable ratio and creditor turnover ratio. Presenting Mortgage Recovery Strategy For Finance Companies In Depth Organization Ratio Analysis Portrait PDF to provide visual cues and insights. Share and navigate important information on six stages that need your due attention. This template can be used to pitch topics like Account Payable Ratios, Account Receivable Ratio, Creditor Turnover Ratio. In addtion, this PPT design contains high resolution images, graphics, etc, that are easily editable and available for immediate download.
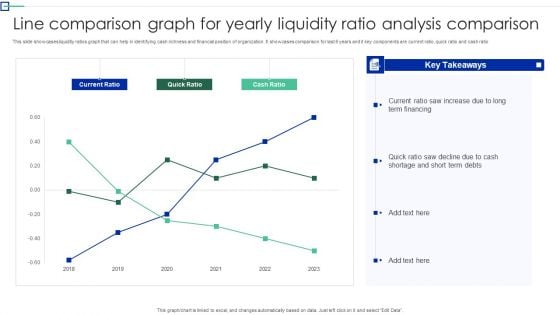
Line Comparison Graph For Yearly Liquidity Ratio Analysis Comparison Topics PDF
This slide showcases liquidity ratios graph that can help in identifying cash richness and financial position of organization. It showcases comparison for last 6 years and it key components are current ratio, quick ratio and cash ratio. Showcasing this set of slides titled Line Comparison Graph For Yearly Liquidity Ratio Analysis Comparison Topics PDF. The topics addressed in these templates are Term Financing, Cash Shortage, Cash Ratio. All the content presented in this PPT design is completely editable. Download it and make adjustments in color, background, font etc. as per your unique business setting.
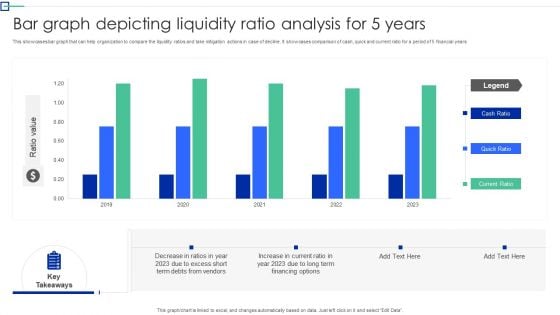
Bar Graph Depicting Liquidity Ratio Analysis For 5 Years Graphics PDF
This showcases bar graph that can help organization to compare the liquidity ratios and take mitigation actions in case of decline. It showcases comparison of cash, quick and current ratio for a period of 5 financial years. Showcasing this set of slides titled Bar Graph Depicting Liquidity Ratio Analysis For 5 Years Graphics PDF. The topics addressed in these templates are Organization To Compare, The Liquidity Ratios, Mitigation Action Decline. All the content presented in this PPT design is completely editable. Download it and make adjustments in color, background, font etc. as per your unique business setting.

Cash Management Dashboard With Sales Outstanding And Liquidity Ratio Analysis Information PDF
This showcases dashboard that can help organization in cash management and track KPIs to evaluate the financial performance of company. It key components are liquidity ratios, cash balance. days sales outstanding, days inventory outstanding and days payable outstanding. Pitch your topic with ease and precision using this Cash Management Dashboard With Sales Outstanding And Liquidity Ratio Analysis Information PDF. This layout presents information on Cash Conversion, Working Capital, Cash Balance. It is also available for immediate download and adjustment. So, changes can be made in the color, design, graphics or any other component to create a unique layout.
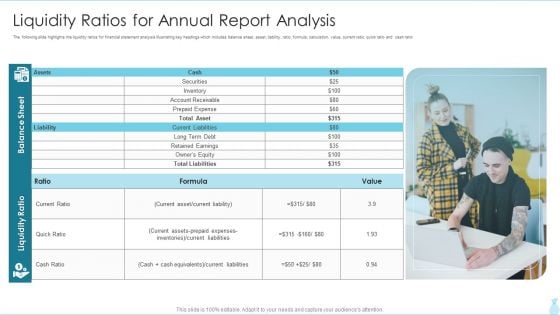
Liquidity Ratios For Annual Report Analysis Pictures PDF
The following slide highlights the liquidity ratios for financial statement analysis illustrating key headings which includes balance sheet, asset, liability, ratio, formula, calculation, value, current ratio, quick ratio.Presenting Liquidity Ratios For Annual Report Analysis Pictures PDF to dispense important information. This template comprises one stage. It also presents valuable insights into the topics including Current Liabilities, Equivalents Current, Current Liabilities This is a completely customizable PowerPoint theme that can be put to use immediately. So, download it and address the topic impactfully.
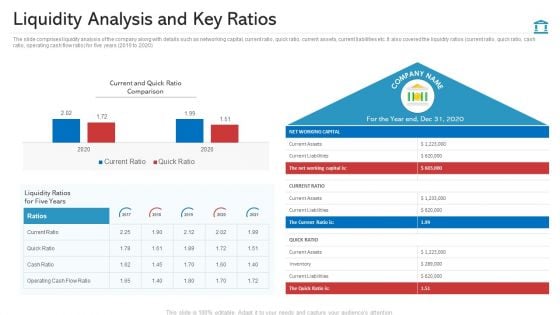
Liquidity Analysis And Key Ratios Structure PDF
The slide comprises liquidity analysis of the company along with details such as networking capital, current ratio, quick ratio, current assets, current liabilities etc. It also covered the liquidity ratios current ratio, quick ratio, cash ratio, operating cash flow ratio for five years 2016 to 2020 Deliver and pitch your topic in the best possible manner with this liquidity analysis and key ratios structure pdf. Use them to share invaluable insights on net working capital, current and quick ratio comparison, current liabilities and impress your audience. This template can be altered and modified as per your expectations. So, grab it now.
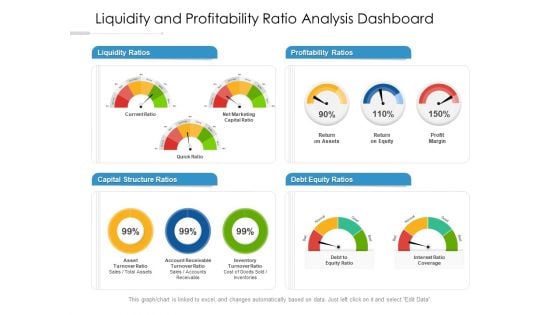
Liquidity And Profitability Ratio Analysis Dashboard Ppt PowerPoint Presentation Portfolio Infographic Template PDF
Presenting this set of slides with name liquidity and profitability ratio analysis dashboard ppt powerpoint presentation portfolio infographic template pdf. The topics discussed in these slides are liquidity ratios, profitability ratios, capital structure ratios, debt equity ratios. This is a completely editable PowerPoint presentation and is available for immediate download. Download now and impress your audience.
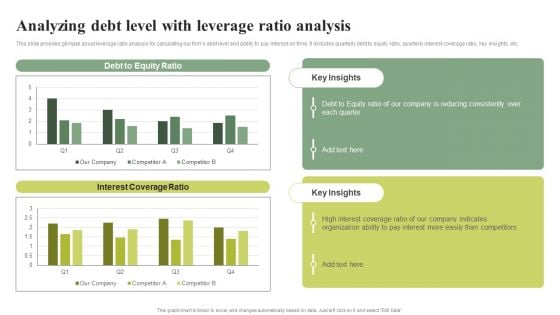
Analyzing Debt Level With Leverage Ratio Analysis Effective Planning For Monetary Structure PDF
This slide provides glimpse about leverage ratio analysis for calculating our firms debt level and ability to pay interest on time. It includes quarterly debt to equity ratio, quarterly interest coverage ratio, key insights, etc.This Analyzing Debt Level With Leverage Ratio Analysis Effective Planning For Monetary Structure PDF is perfect for any presentation, be it in front of clients or colleagues. It is a versatile and stylish solution for organizing your meetings. The Analyzing Debt Level With Leverage Ratio Analysis Effective Planning For Monetary Structure PDF features a modern design for your presentation meetings. The adjustable and customizable slides provide unlimited possibilities for acing up your presentation. Slidegeeks has done all the homework before launching the product for you. So, do not wait, grab the presentation templates today.
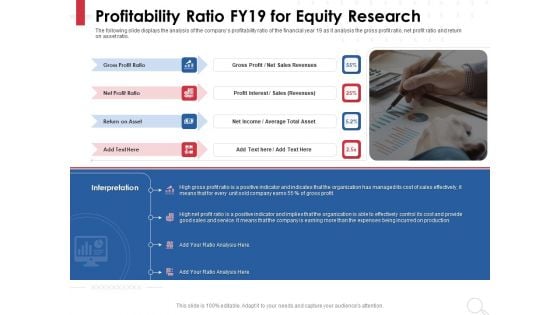
Equity Analysis Project Profitability Ratio FY19 For Equity Research Ppt PowerPoint Presentation Layouts Structure PDF
Presenting this set of slides with name equity analysis project profitability ratio fy19 for equity research ppt powerpoint presentation layouts structure pdf. This is a four stage process. The stages in this process are gross profit ratio, net profit ratio, return asset, gross profit, net sales revenues. This is a completely editable PowerPoint presentation and is available for immediate download. Download now and impress your audience.
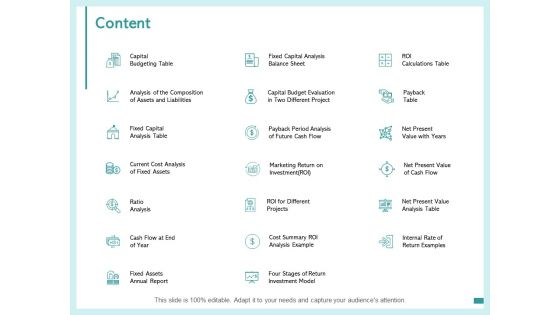
Content Capital Budgeting Table Ratio Analysis Ppt PowerPoint Presentation Slides Layout Ideas
Presenting this set of slides with name content capital budgeting table ratio analysis ppt powerpoint presentation slides layout ideas. The topics discussed in these slides are business, management, planning, strategy, marketing. This is a completely editable PowerPoint presentation and is available for immediate download. Download now and impress your audience.
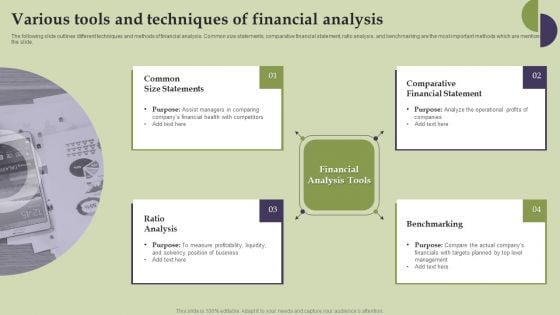
Methods And Approaches To Assess Various Tools And Techniques Of Financial Analysis Formats PDF
The following slide outlines different techniques and methods of financial analysis. Common size statements, comparative financial statement, ratio analysis, and benchmarking are the most important methods which are mentioned in the slide. Take your projects to the next level with our ultimate collection of Methods And Approaches To Assess Various Tools And Techniques Of Financial Analysis Formats PDF. Slidegeeks has designed a range of layouts that are perfect for representing task or activity duration, keeping track of all your deadlines at a glance. Tailor these designs to your exact needs and give them a truly corporate look with your own brand colors they will make your projects stand out from the rest.
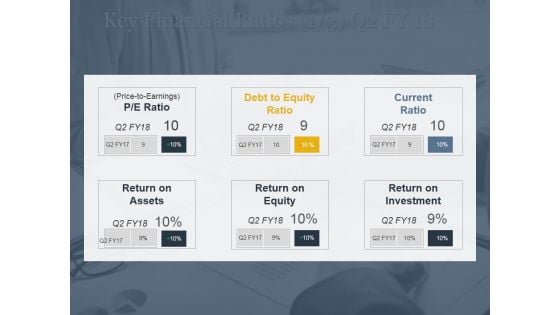
Key Financial Ratios Ppt PowerPoint Presentation Model Objects
This is a key financial ratios ppt powerpoint presentation model objects. This is a three stage process. The stages in this process are p e ratio, price to earnings, debt, equity ratio, current, ratio.
Key Financial Ratios Template Ppt PowerPoint Presentation Icon
This is a key financial ratios template ppt powerpoint presentation icon. This is a four stage process. The stages in this process are business, marketing, planning, strategy, finance.
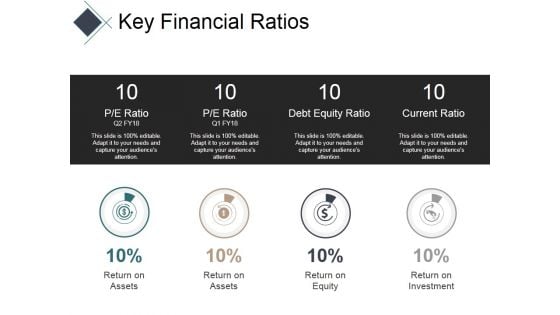
Key Financial Ratios Ppt PowerPoint Presentation Summary Inspiration
This is a key financial ratios ppt powerpoint presentation summary inspiration. This is a four stage process. The stages in this process are pe ratio, debt equity ratio, current ratio.
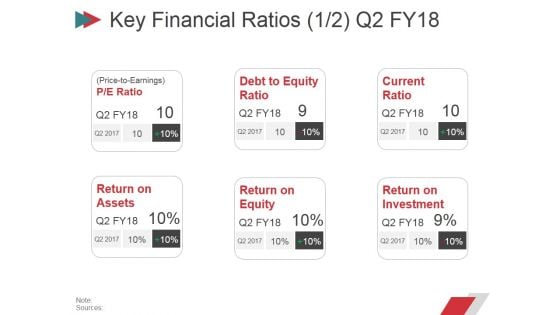
Key Financial Ratios Ppt PowerPoint Presentation Infographic Template Structure
This is a key financial ratios ppt powerpoint presentation infographic template structure. This is a six stage process. The stages in this process are price to earnings, debt to equity ratio, current ratio, return on, assets, return on , equity, return on investment.
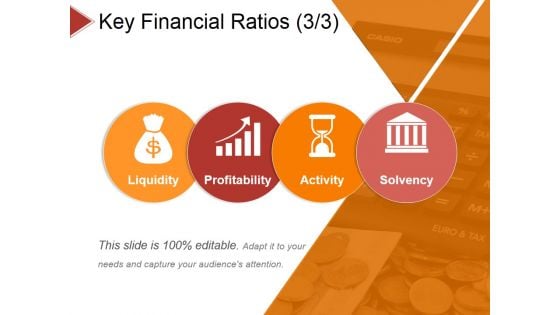
Key Financial Ratios Template 3 Ppt PowerPoint Presentation Summary Sample
This is a key financial ratios template 3 ppt powerpoint presentation summary sample. This is a four stage process. The stages in this process are liquidity, profitability, activity, solvency.
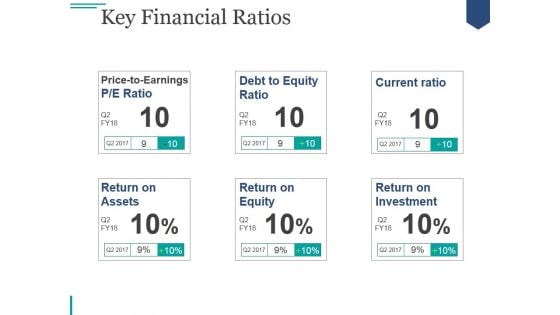
Key Financial Ratios Template 2 Ppt PowerPoint Presentation Inspiration
This is a key financial ratios template 2 ppt powerpoint presentation inspiration. This is a six stage process. The stages in this process are price to earnings, debt to equity ratio, current ratio, return on, assets, return on equity, return on, investment.
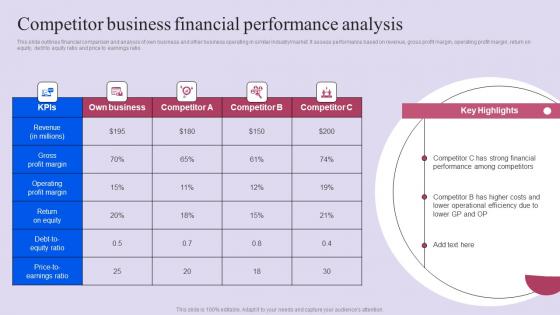
Competitor Business Financial Performance Analysis Ppt Slides Display Pdf
This slide outlines financial comparison and analysis of own business and other business operating in similar industrymarket. It assess performance based on revenue, gross profit margin, operating profit margin, return on equity, debt to equity ratio and price to earnings ratio. Do you have an important presentation coming up Are you looking for something that will make your presentation stand out from the rest Look no further than Competitor Business Financial Performance Analysis Ppt Slides Display Pdf. With our professional designs, you can trust that your presentation will pop and make delivering it a smooth process. And with Slidegeeks, you can trust that your presentation will be unique and memorable. So why wait Grab Competitor Business Financial Performance Analysis Ppt Slides Display Pdf today and make your presentation stand out from the rest This slide outlines financial comparison and analysis of own business and other business operating in similar industrymarket. It assess performance based on revenue, gross profit margin, operating profit margin, return on equity, debt to equity ratio and price to earnings ratio.
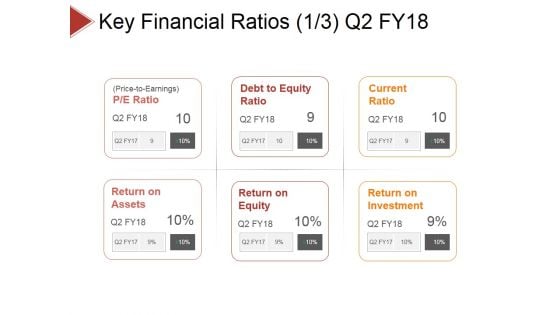
Key Financial Ratios Template 1 Ppt PowerPoint Presentation Layouts Guidelines
This is a key financial ratios template 1 ppt powerpoint presentation layouts guidelines. This is a six stage process. The stages in this process are price to earnings, debt to equity ratio, current ratio, return on, equity, return on , assets, return on investment.

 Home
Home