Financial Ratios
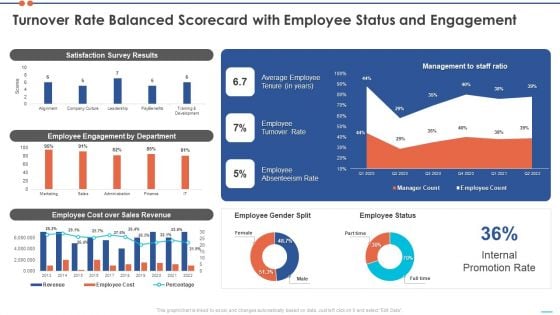
Staff Turnover Ratio BSC Turnover Rate Balanced Scorecard With Employee Status And Engagement Background PDF
Deliver an awe inspiring pitch with this creative staff turnover ratio bsc turnover rate balanced scorecard with employee status and engagement background pdf bundle. Topics like satisfaction survey results, employee engagement by department, employee cost over sales revenue can be discussed with this completely editable template. It is available for immediate download depending on the needs and requirements of the user.
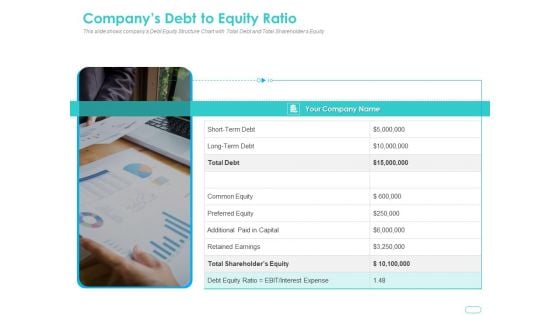
Debt Funding Investment Pitch Deck Companys Debt To Equity Ratio Ppt Portfolio Graphics PDF
This is a debt funding investment pitch deck companys debt to equity ratio ppt portfolio graphics pdf template with various stages. Focus and dispense information on one stage using this creative set, that comes with editable features. It contains large content boxes to add your information on topics like common equity, additional paid capital, retained earnings, short term debt, interest expense. You can also showcase facts, figures, and other relevant content using this PPT layout. Grab it now.
HR Induction Dashboard Highlighting Employee Headcount And Turnover Ratio Icons PDF
This slide highlights the HR induction dashboard which includes average salary, headcount, turnover rate, employees hired and employees left rate, average age with employment contract and status. Make sure to capture your audiences attention in your business displays with our gratis customizable HR Induction Dashboard Highlighting Employee Headcount And Turnover Ratio Icons PDF. These are great for business strategies, office conferences, capital raising or task suggestions. If you desire to acquire more customers for your tech business and ensure they stay satisfied, create your own sales presentation with these plain slides.
Debt To Equity Ratio Of Organization Developing Fundraising Techniques Icons PDF
This slide showcases drawbacks of raising money from crowdfunding which are commission, limited fund availability and unsuccessful raises are public. It can help organization to identify the risks associated with raising funds from equity crowdfunding. The Debt To Equity Ratio Of Organization Developing Fundraising Techniques Icons PDF is a compilation of the most recent design trends as a series of slides. It is suitable for any subject or industry presentation, containing attractive visuals and photo spots for businesses to clearly express their messages. This template contains a variety of slides for the user to input data, such as structures to contrast two elements, bullet points, and slides for written information. Slidegeeks is prepared to create an impression.
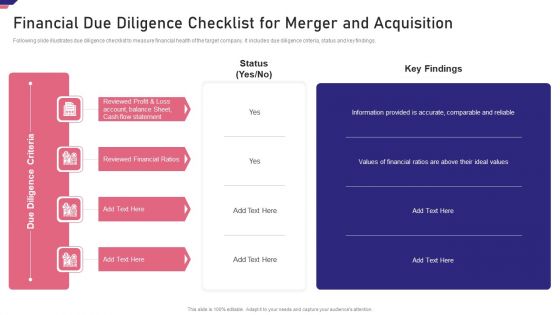
Mergers Acquisition Playbook Mergers Acquisition Playbook Financial Due Diligence Topics PDF
Following slide illustrates due diligence checklist to measure financial health of the target company. It includes due diligence criteria, status and key findings.Deliver and pitch your topic in the best possible manner with this Mergers Acquisition Playbook Mergers Acquisition Playbook Financial Due Diligence Topics PDF Use them to share invaluable insights on Reviewed Financial Ratios, Information Provided, Values Of Financial and impress your audience. This template can be altered and modified as per your expectations. So, grab it now.
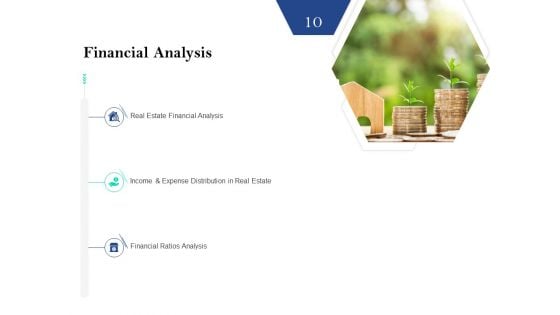
Property Investment Strategies Financial Analysis Ppt PowerPoint Presentation Outline Ideas PDF
Presenting property investment strategies financial analysis ppt powerpoint presentation outline ideas pdf. to provide visual cues and insights. Share and navigate important information on three stages that need your due attention. This template can be used to pitch topics like real estate financial analysis, income and expense distribution in real estate, financial ratios analysis. In addtion, this PPT design contains high resolution images, graphics, etc, that are easily editable and available for immediate download.
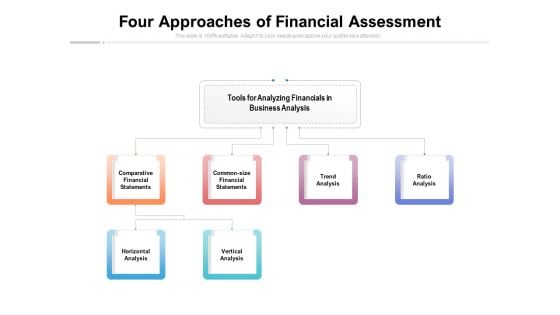
Four Approaches Of Financial Assessment Ppt PowerPoint Presentation Infographics Example
Presenting this set of slides with name four approaches of financial assessment ppt powerpoint presentation infographics example. This is a six stage process. The stages in this process are tools for analyzing financials business analysis, comparative financial statements, common size financial statements, trend analysis, ratio analysis, vertical analysis. This is a completely editable PowerPoint presentation and is available for immediate download. Download now and impress your audience.
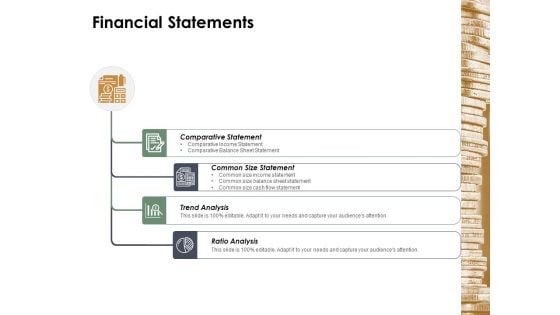
Financial Statements Ppt Powerpoint Presentation Infographic Template Sample
This is a financial statements ppt powerpoint presentation infographic template sample. This is a four stage process. The stages in this process are financial statements, comparative statement, common size statement, trend analysis, ratio analysis.
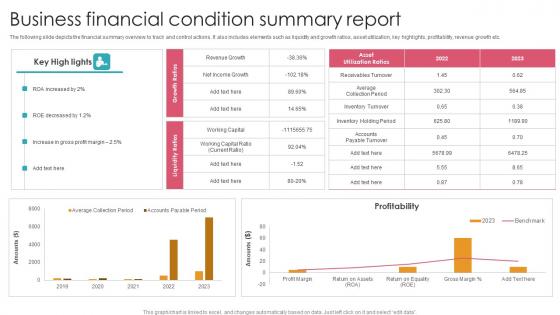
Business Financial Condition Summary Report Graphics Pdf
The following slide depicts the financial summary overview to track and control actions. It also includes elements such as liquidity and growth ratios, asset utilization, key highlights, profitability, revenue growth etc. Pitch your topic with ease and precision using this Business Financial Condition Summary Report Graphics Pdf. This layout presents information on Profitability, Increase Gross Profit Margin, Roe Decreased. It is also available for immediate download and adjustment. So, changes can be made in the color, design, graphics or any other component to create a unique layout. The following slide depicts the financial summary overview to track and control actions. It also includes elements such as liquidity and growth ratios, asset utilization, key highlights, profitability, revenue growth etc.
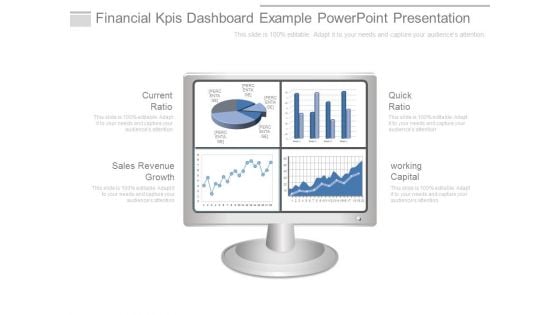
Financial Kpis Dashboard Example Powerpoint Presentation
This is a financial kpis dashboard example powerpoint presentation. This is a four stage process. The stages in this process are current ratio, sales revenue growth, quick ratio, working capital.
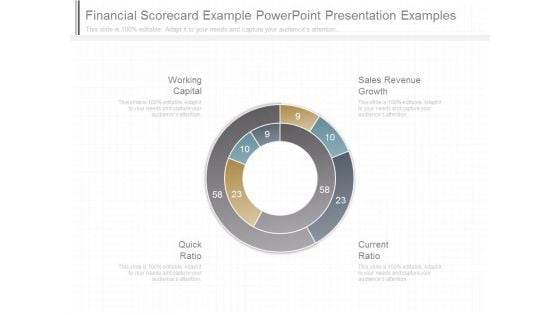
Financial Scorecard Example Powerpoint Presentation Examples
This is a financial scorecard example powerpoint presentation examples. This is a four stage process. The stages in this process are working capital, quick ratio, current ratio, sales revenue growth.
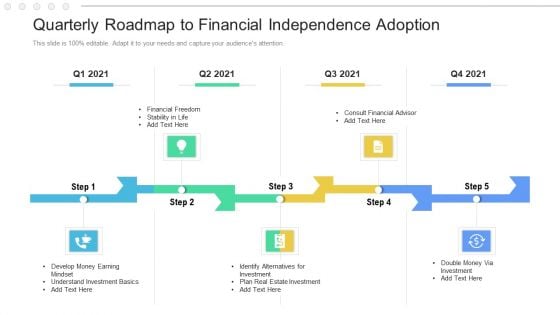
Quarterly Roadmap To Financial Independence Adoption Formats
Introducing our quarterly roadmap to financial independence adoption formats. This PPT presentation is Google Slides compatible, therefore, you can share it easily with the collaborators for measuring the progress. Also, the presentation is available in both standard screen and widescreen aspect ratios. So edit the template design by modifying the font size, font type, color, and shapes as per your requirements. As this PPT design is fully editable it can be presented in PDF, JPG and PNG formats.
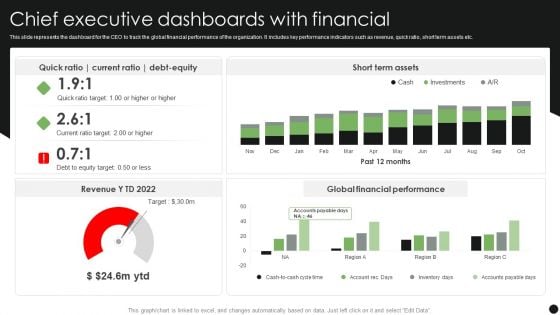
Chief Executive Dashboards With Financial Topics PDF
This slide represents the dashboard for the CEO to track the global financial performance of the organization. It includes key performance indicators such as revenue, quick ratio, short term assets etc. Showcasing this set of slides titled Chief Executive Dashboards With Financial Topics PDF. The topics addressed in these templates are Short Term Assets, Global Financial Performance, Debt Equity. All the content presented in this PPT design is completely editable. Download it and make adjustments in color, background, font etc. as per your unique business setting.
Monthly Financial Performance Outcome Reporting Icons PDF
This slide showcases a report showing monthly results financial performance to ensure constant revenue growth. It includes key components such as gross profit margin, operating expenses ratio, operating profit margin, net profit margin, earning before interest and taxes, etc. Showcasing this set of slides titled Monthly Financial Performance Outcome Reporting Icons PDF. The topics addressed in these templates are Operating Expenses, Income Statement, Operating Expenses Ratio. All the content presented in this PPT design is completely editable. Download it and make adjustments in color, background, font etc. as per your unique business setting.
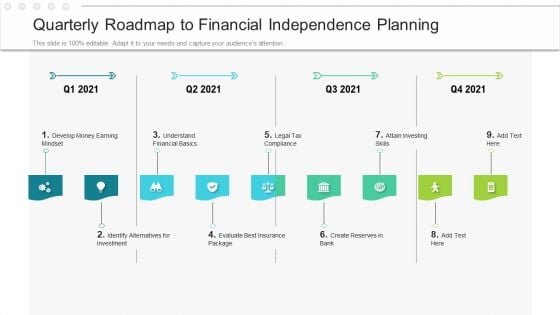
Quarterly Roadmap To Financial Independence Planning Sample
Presenting the quarterly roadmap to financial independence planning sample. The template includes a roadmap that can be used to initiate a strategic plan. Not only this, the PowerPoint slideshow is completely editable and you can effortlessly modify the font size, font type, and shapes according to your needs. This PPT slide can be easily reached in standard screen and widescreen aspect ratios. The set is also available in various formats like PDF, PNG, and JPG. So download and use it multiple times as per your knowledge.
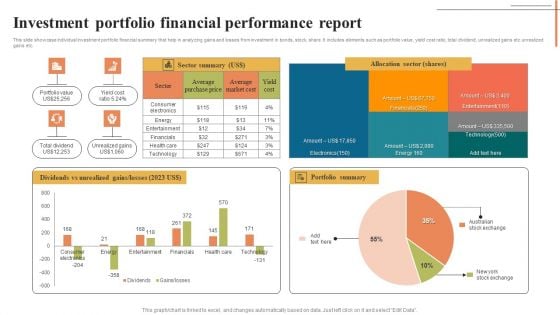
Investment Portfolio Financial Performance Report Pictures PDF
This slide showcase individual investment portfolio financial summary that help in analyzing gains and losses from investment in bonds, stock, share. It includes elements such as portfolio value, yield cost ratio, total dividend, unrealized gains etc.unrealized gains etc. Showcasing this set of slides titled Investment Portfolio Financial Performance Report Pictures PDF. The topics addressed in these templates are Allocation Sector, Portfolio Summary, Dividends. All the content presented in this PPT design is completely editable. Download it and make adjustments in color, background, font etc. as per your unique business setting.
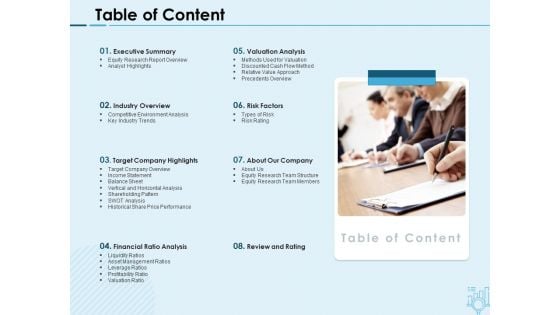
Assessing Stocks In Financial Market Table Of Content Ppt PowerPoint Presentation Infographic Template Example File
Presenting this set of slides with name assessing stocks in financial market table of content ppt powerpoint presentation infographic template example file. This is a eight stage process. The stages in this process are executive summary, industry overview, target company highlights, financial ratio analysis, valuation analysis, risk factors, about our company, review and rating. This is a completely editable PowerPoint presentation and is available for immediate download. Download now and impress your audience.
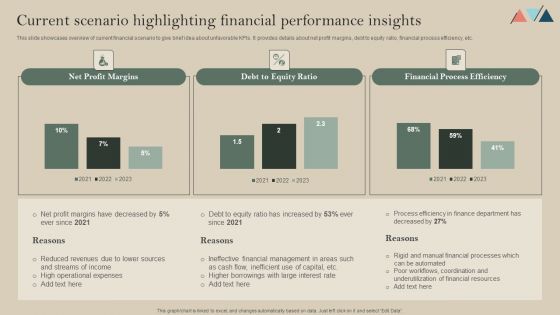
Current Scenario Highlighting Financial Performance Insights Demonstration PDF
This slide showcases overview of current financial scenario to give brief idea about unfavorable KPIs. It provides details about net profit margins, debt to equity ratio, financial process efficiency, etc. Want to ace your presentation in front of a live audience Our Current Scenario Highlighting Financial Performance Insights Demonstration PDF can help you do that by engaging all the users towards you.. Slidegeeks experts have put their efforts and expertise into creating these impeccable powerpoint presentations so that you can communicate your ideas clearly. Moreover, all the templates are customizable, and easy-to-edit and downloadable. Use these for both personal and commercial use.
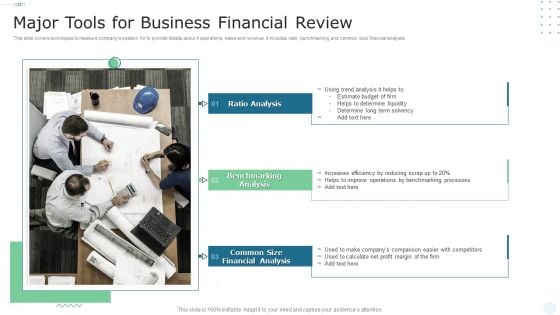
Major Tools For Business Financial Review Pictures PDF
This slide covers techniques to measure companys position for to provide details about it operations, sales and revenue. It includes ratio, benchmarking and common size financial analysis. Presenting Major Tools For Business Financial Review Pictures PDF to dispense important information. This template comprises three stages. It also presents valuable insights into the topics including Ratio Analysis, Benchmarking Analysis, Common Size Financial Analysis. This is a completely customizable PowerPoint theme that can be put to use immediately. So, download it and address the topic impactfully.
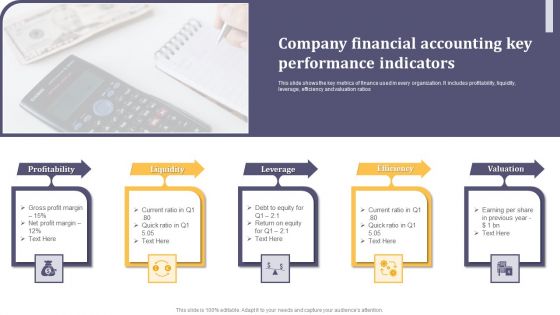
Company Financial Accounting Key Performance Indicators Ppt Slides PDF
This slide shows the key metrics of finance used in every organization. It includes profitability, liquidity, leverage, efficiency and valuation ratios. Presenting Company Financial Accounting Key Performance Indicators Ppt Slides PDF to dispense important information. This template comprises five stages. It also presents valuable insights into the topics including Profitability, Liquidity, Leverage. This is a completely customizable PowerPoint theme that can be put to use immediately. So, download it and address the topic impactfully.
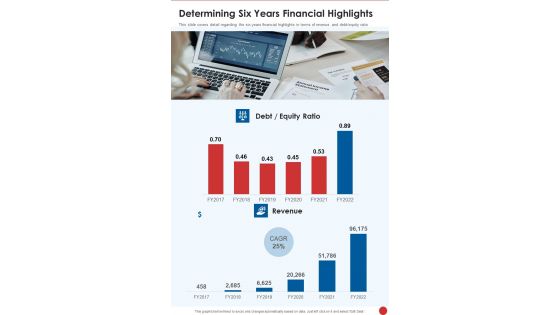
Determining Six Years Financial Highlights One Pager Documents
This slide covers detail regarding the six years financial highlights in terms of revenue and debt or equity ratio. Presenting you a fantastic Determining Six Years Financial Highlights One Pager Documents. This piece is crafted on hours of research and professional design efforts to ensure you have the best resource. It is completely editable and its design allow you to rehash its elements to suit your needs. Get this Determining Six Years Financial Highlights One Pager Documents A4 One-pager now.
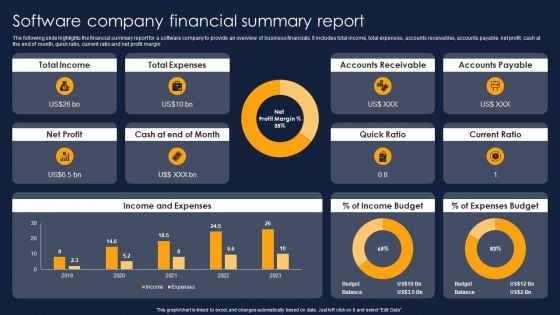
Software Company Financial Summary Report Financial Performance Report Of Software Firm Rules PDF
The following slide highlights the financial summary report for a software company to provide an overview of business financials. It includes total income, total expenses, accounts receivables, accounts payable, net profit, cash at the end of month, quick ratio, current ratio and net profit margin. If your project calls for a presentation, then Slidegeeks is your go-to partner because we have professionally designed, easy-to-edit templates that are perfect for any presentation. After downloading, you can easily edit Software Company Financial Summary Report Financial Performance Report Of Software Firm Rules PDF and make the changes accordingly. You can rearrange slides or fill them with different images. Check out all the handy templates
Overview Healthcare Business Management Health System Financial Analysis Icons PDF
Presenting this set of slides with name overview healthcare business management health system financial analysis icons pdf. The topics discussed in these slides are ratio or statistic, profitability, debt position, liquidity. This is a completely editable PowerPoint presentation and is available for immediate download. Download now and impress your audience.
Financial Impact Of Fundraising On Organization Icons PDF
This slide showcases financial impact of raising funds on organization. It showcases comparison of various ratios before and after fundraising which are - debt to equity ratio, debt to capital ratio, shareholder equity ratio. Deliver an awe inspiring pitch with this creative Financial Impact Of Fundraising On Organization Icons PDF bundle. Topics like Debt To Equity Ratio, Debt To Capital Ratio, Shareholder Equity Ratio can be discussed with this completely editable template. It is available for immediate download depending on the needs and requirements of the user.
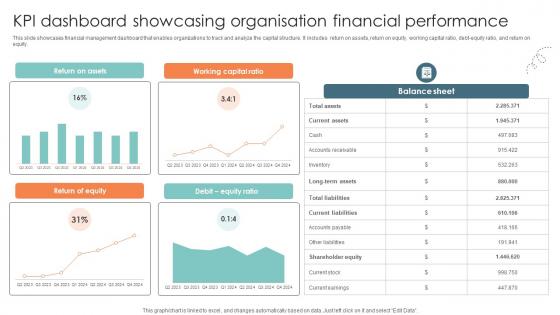
Kpi Dashboard Showcasing Organisation Financial Performance Strategic Approaches To Corporate Financial
This slide showcases financial management dashboard that enables organizations to track and analyze the capital structure. It includes return on assets, return on equity, working capital ratio, debt-equity ratio, and return on equity. This modern and well-arranged Kpi Dashboard Showcasing Organisation Financial Performance Strategic Approaches To Corporate Financial provides lots of creative possibilities. It is very simple to customize and edit with the Powerpoint Software. Just drag and drop your pictures into the shapes. All facets of this template can be edited with Powerpoint, no extra software is necessary. Add your own material, put your images in the places assigned for them, adjust the colors, and then you can show your slides to the world, with an animated slide included. This slide showcases financial management dashboard that enables organizations to track and analyze the capital structure. It includes return on assets, return on equity, working capital ratio, debt-equity ratio, and return on equity.
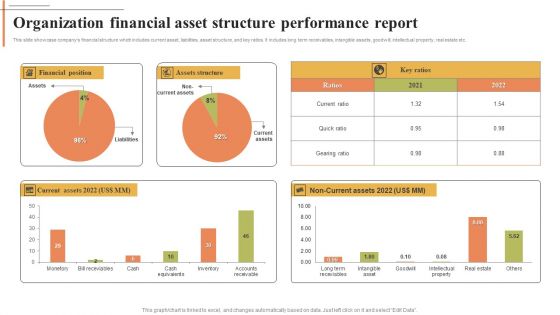
Organization Financial Asset Structure Performance Report Portrait PDF
This slide showcase companys financial structure which includes current asset, liabilities, asset structure, and key ratios. It includes long term receivables, intangible assets, goodwill, intellectual property, real estate etc. Showcasing this set of slides titled Organization Financial Asset Structure Performance Report Portrait PDF. The topics addressed in these templates are Financial Position, Assets Structure, Current Assets. All the content presented in this PPT design is completely editable. Download it and make adjustments in color, background, font etc. as per your unique business setting.
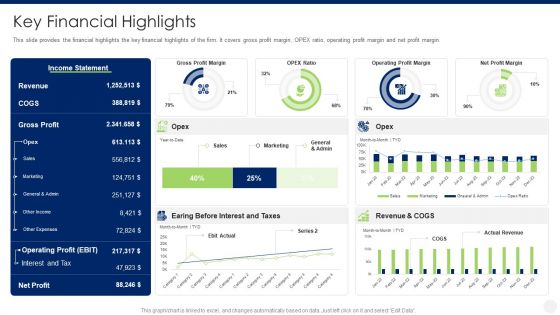
Merger And Acquisition Due Diligence Key Financial Highlights Clipart PDF
This slide provides the financial highlights the key financial highlights of the firm. It covers gross profit margin, OPEX ratio, operating profit margin and net profit margin. Deliver and pitch your topic in the best possible manner with this merger and acquisition due diligence key financial highlights clipart pdf. Use them to share invaluable insights on revenue, gross profit, operating profit, expenses and impress your audience. This template can be altered and modified as per your expectations. So, grab it now.
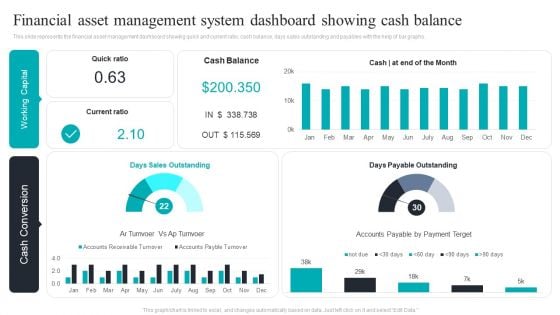
Financial Asset Management System Dashboard Showing Cash Balance Download PDF
This slide represents the financial asset management dashboard showing quick and current ratio, cash balance, days sales outstanding and payables with the help of bar graphs. Pitch your topic with ease and precision using this Financial Asset Management System Dashboard Showing Cash Balance Download PDF. This layout presents information on Financial Asset, Management System, Dashboard Showing, Cash Balance. It is also available for immediate download and adjustment. So, changes can be made in the color, design, graphics or any other component to create a unique layout.
KPI Dashboard For Tracking Financial Management Challenges Download PDF
Following slide demonstrates KPI dashboard for monitoring business cash flow management pain points to improve organisation financial performance. It includes elements such as quick ratio, current ration, annual cash balance, monthly cash balance, accounts receivable and payables, etc. Showcasing this set of slides titled KPI Dashboard For Tracking Financial Management Challenges Download PDF. The topics addressed in these templates are Monthly Cash Flow, Account Payable By Days, Annual Revenue, Annual Cost, Annual Net Profits. All the content presented in this PPT design is completely editable. Download it and make adjustments in color, background, font etc. as per your unique business setting.
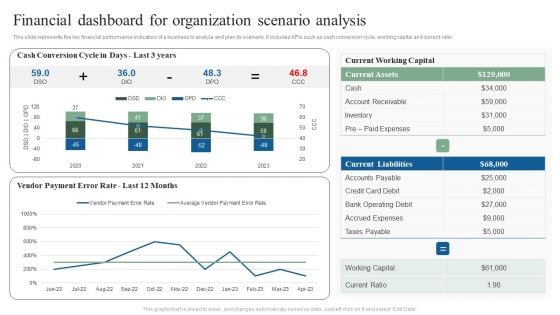
Financial Dashboard For Organization Scenario Analysis Ppt Show Ideas PDF
This slide represents the key financial performance indicators of a business to analyze and plan its scenario. It includes KPIs such as cash conversion cycle, working capital and current ratio. Showcasing this set of slides titled Financial Dashboard For Organization Scenario Analysis Ppt Show Ideas PDF. The topics addressed in these templates are Current Working Capital, Current Liabilities, Current Assets. All the content presented in this PPT design is completely editable. Download it and make adjustments in color, background, font etc. as per your unique business setting.
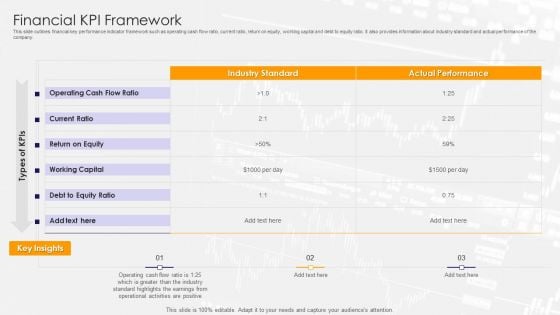
Financial KPI Framework Ppt PowerPoint Presentation Gallery Show PDF
This slide outlines financial key performance indicator framework such as operating cash flow ratio, current ratio, return on equity, working capital and debt to equity ratio. It also provides information about industry standard and actual performance of the company. Showcasing this set of slides titled financial kpi framework ppt powerpoint presentation gallery show pdf. The topics addressed in these templates are current ratio, working capital, equity. All the content presented in this PPT design is completely editable. Download it and make adjustments in color, background, font etc. as per your unique business setting.
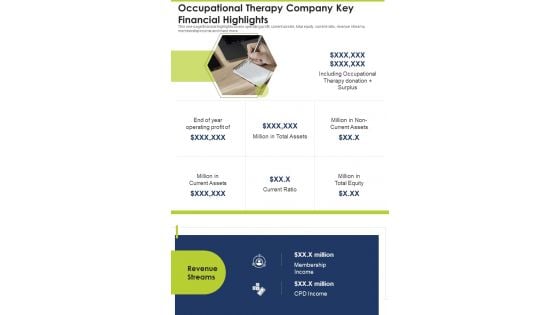
Occupational Therapy Company Key Financial Highlights One Pager Documents
This one-page financial highlights covers operating profit, current assets, total equity, current ratio, revenue streams, membership income and many more. Presenting you an exemplary Occupational Therapy Company Key Financial Highlights One Pager Documents. Our one-pager comprises all the must-have essentials of an inclusive document. You can edit it with ease, as its layout is completely editable. With such freedom, you can tweak its design and other elements to your requirements. Download this Occupational Therapy Company Key Financial Highlights One Pager Documents brilliant piece now.
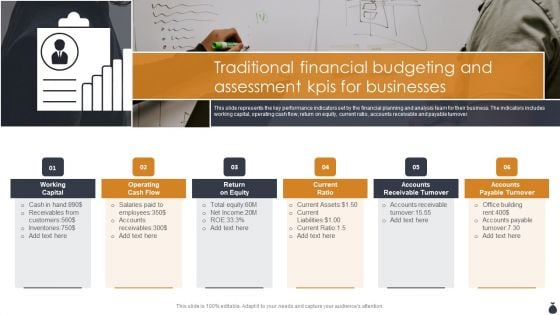
Traditional Financial Budgeting And Assessment Kpis For Businesses Infographics PDF
This slide represents the key performance indicators set by the financial planning and analysis team for their business. The indicators includes working capital, operating cash flow, return on equity, current ratio, accounts receivable and payable turnover. Presenting Traditional Financial Budgeting And Assessment Kpis For Businesses Infographics PDF to dispense important information. This template comprises six stages. It also presents valuable insights into the topics including Working Capital, Operating Cash Flow, Current Ratio. This is a completely customizable PowerPoint theme that can be put to use immediately. So, download it and address the topic impactfully.
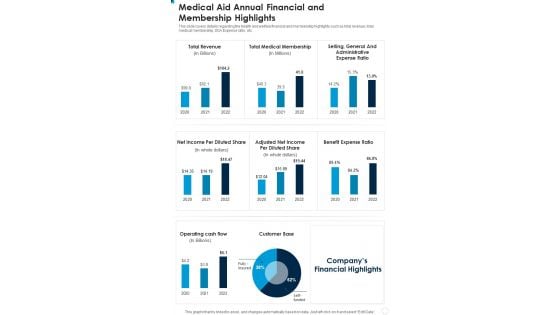
Medical Aid Annual Financial And Membership Highlights One Pager Documents
This slide covers details regarding the health and welfare financial and membership highlights such as total revenue, total medical membership, SGA Expense ratio, etc. Presenting you a fantastic Medical Aid Annual Financial And Membership Highlights One Pager Documents. This piece is crafted on hours of research and professional design efforts to ensure you have the best resource. It is completely editable and its design allow you to rehash its elements to suit your needs. Get this Medical Aid Annual Financial And Membership Highlights One Pager Documents A4 One-pager now.
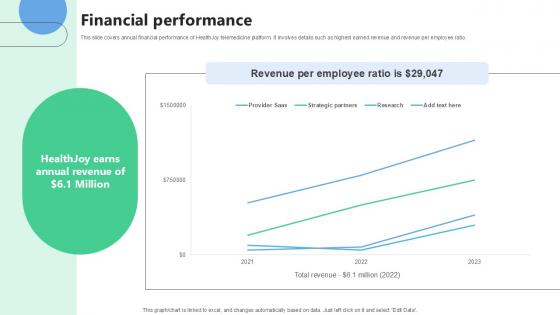
Financial Performance Medical Benefits Navigation Platform Pitch Deck Ppt Presentation
This slide covers annual financial performance of HealthJoy telemedicine platform. It involves details such as highest earned revenue and revenue per employee ratio. Do you know about Slidesgeeks Financial Performance Medical Benefits Navigation Platform Pitch Deck Ppt Presentation These are perfect for delivering any kind od presentation. Using it, create PowerPoint presentations that communicate your ideas and engage audiences. Save time and effort by using our pre-designed presentation templates that are perfect for a wide range of topic. Our vast selection of designs covers a range of styles, from creative to business, and are all highly customizable and easy to edit. Download as a PowerPoint template or use them as Google Slides themes. This slide covers annual financial performance of HealthJoy telemedicine platform. It involves details such as highest earned revenue and revenue per employee ratio.
Financial Document With Euro Symbol Vector Ppt Powerpoint Presentation Inspiration Graphics
This is a financial document with euro symbol vector ppt powerpoint presentation inspiration graphics. This is a four stage process. The stages in this process are financial statements icon, accounting ratio icon, balance sheet icon.
Financial Document With Pen And Dollar Icon Ppt Powerpoint Presentation Summary Slide Portrait
This is a financial document with pen and dollar icon ppt powerpoint presentation summary slide portrait. This is a four stage process. The stages in this process are financial statements icon, accounting ratio icon, balance sheet icon.
Financial Performance Report Vector Icon Ppt Powerpoint Presentation Pictures Background Image
This is a financial performance report vector icon ppt powerpoint presentation pictures background image. This is a four stage process. The stages in this process are financial statements icon, accounting ratio icon, balance sheet icon.
Financial Reporting Icon Computer Screen With Graph And Dollar Ppt Powerpoint Presentation Layouts Model
This is a financial reporting icon computer screen with graph and dollar ppt powerpoint presentation layouts model. This is a four stage process. The stages in this process are financial statements icon, accounting ratio icon, balance sheet icon.
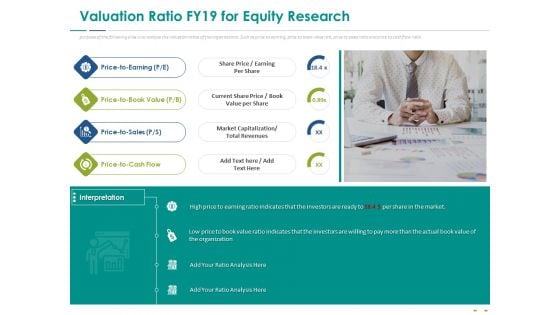
Stock Market Research Report Valuation Ratio FY19 For Equity Research Ppt PowerPoint Presentation Model Background Images PDF
The purpose of the following slide is to analyze the valuation ratios of the organizations. Such as price to earning, price to book value rati, price to sales ratio and price to cash flow ratio. Presenting stock market research report valuation ratio fy19 for equity research ppt powerpoint presentation model background images pdf to provide visual cues and insights. Share and navigate important information on four stages that need your due attention. This template can be used to pitch topics like rice to earning, price to book value, price to sale, price to cash flow. In addition, this PPT design contains high-resolution images, graphics, etc, that are easily editable and available for immediate download.
Determining Asset Utilization Ability Assessing Corporate Financial Techniques Icons Pdf
This slide provides glimpse about activity ratio analysis for calculating our firms ability to quickly change inventory to sales. It includes quarterly inventory ratio, quarterly total assets turnover ratio, key insights, etc. Formulating a presentation can take up a lot of effort and time, so the content and message should always be the primary focus. The visuals of the PowerPoint can enhance the presenters message, so our Determining Asset Utilization Ability Assessing Corporate Financial Techniques Icons Pdf was created to help save time. Instead of worrying about the design, the presenter can concentrate on the message while our designers work on creating the ideal templates for whatever situation is needed. Slidegeeks has experts for everything from amazing designs to valuable content, we have put everything into Determining Asset Utilization Ability Assessing Corporate Financial Techniques Icons Pdf This slide provides glimpse about activity ratio analysis for calculating our firms ability to quickly change inventory to sales. It includes quarterly inventory ratio, quarterly total assets turnover ratio, key insights, etc.
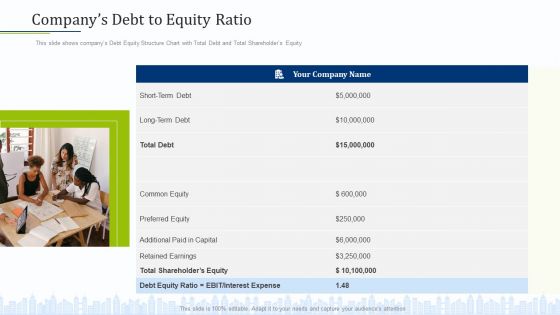
Pitch Deck To Draw External Capital From Commercial Banking Institution Companys Debt To Equity Ratio Portrait PDF
This slide shows companys Debt Equity Structure Chart with Total Debt and Total Shareholders Equity This is a pitch deck to draw external capital from commercial banking institution companys debt to equity ratio portrait pdf template with various stages. Focus and dispense information on one stage using this creative set, that comes with editable features. It contains large content boxes to add your information on topics like preferred equity, retained earnings, total shareholders equity. You can also showcase facts, figures, and other relevant content using this PPT layout. Grab it now.
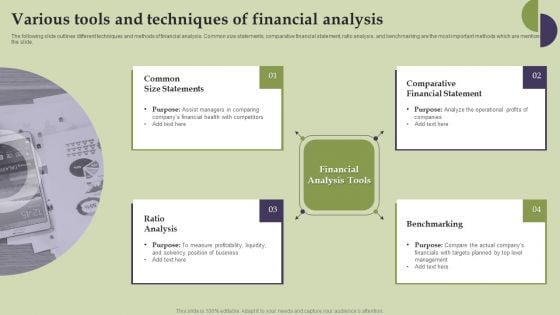
Methods And Approaches To Assess Various Tools And Techniques Of Financial Analysis Formats PDF
The following slide outlines different techniques and methods of financial analysis. Common size statements, comparative financial statement, ratio analysis, and benchmarking are the most important methods which are mentioned in the slide. Take your projects to the next level with our ultimate collection of Methods And Approaches To Assess Various Tools And Techniques Of Financial Analysis Formats PDF. Slidegeeks has designed a range of layouts that are perfect for representing task or activity duration, keeping track of all your deadlines at a glance. Tailor these designs to your exact needs and give them a truly corporate look with your own brand colors they will make your projects stand out from the rest.
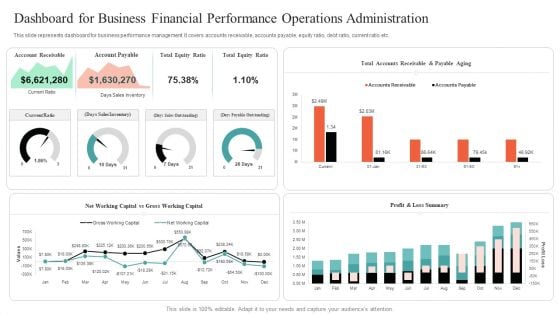
Dashboard For Business Financial Performance Operations Administration Mockup PDF
This slide represents dashboard for business performance management. It covers accounts receivable, accounts payable, equity ratio, debt ratio, current ratio etc. Showcasing this set of slides titled Dashboard For Business Financial Performance Operations Administration Mockup PDF. The topics addressed in these templates are Dashboard For Business Financial, Performance Operations Administration. All the content presented in this PPT design is completely editable. Download it and make adjustments in color, background, font etc. as per your unique business setting.
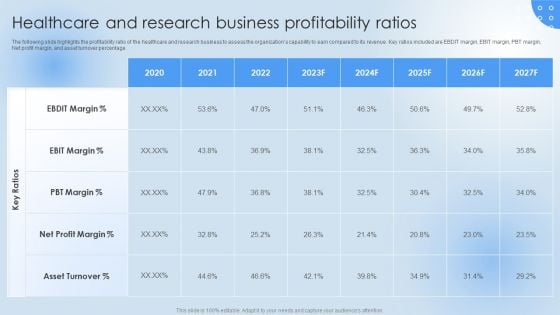
Healthcare And Research Business Pharmaceutical Company Financial Summary Information PDF
The following slide highlights the profitability ratio of the healthcare and research business to assess the organizations capability to earn compared to its revenue. Key ratios included are EBDIT margin, EBIT margin, PBT margin, Net profit margin, and asset turnover percentage. This Healthcare And Research Business Pharmaceutical Company Financial Summary Information PDF is perfect for any presentation, be it in front of clients or colleagues. It is a versatile and stylish solution for organizing your meetings. The Healthcare And Research Business Pharmaceutical Company Financial Summary Information PDF features a modern design for your presentation meetings. The adjustable and customizable slides provide unlimited possibilities for acing up your presentation. Slidegeeks has done all the homework before launching the product for you. So, dont wait, grab the presentation templates today.
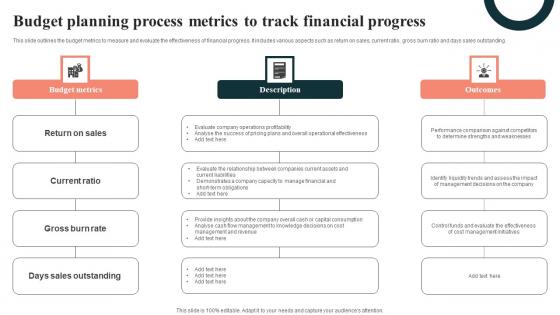
Budget Planning Process Metrics To Track Financial Progress Template Pdf
This slide outlines the budget metrics to measure and evaluate the effectiveness of financial progress. It includes various aspects such as return on sales, current ratio, gross burn ratio and days sales outstanding. Pitch your topic with ease and precision using this Budget Planning Process Metrics To Track Financial Progress Template Pdf. This layout presents information on Budget Metrics, Description, Outcomes. It is also available for immediate download and adjustment. So, changes can be made in the color, design, graphics or any other component to create a unique layout. This slide outlines the budget metrics to measure and evaluate the effectiveness of financial progress. It includes various aspects such as return on sales, current ratio, gross burn ratio and days sales outstanding.
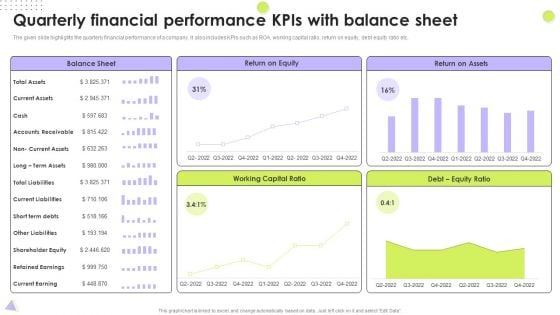
Quarterly Financial Performance Kpis With Balance Sheet Designs PDF
The given slide highlights the quarterly financial performance of a company. It also includes KPIs such as ROA, working capital ratio, return on equity, debt equity ratio etc. Pitch your topic with ease and precision using this Quarterly Financial Performance Kpis With Balance Sheet Designs PDF. This layout presents information on Total Liabilities, Return On Equity, Working Capital Ratio. It is also available for immediate download and adjustment. So, changes can be made in the color, design, graphics or any other component to create a unique layout.
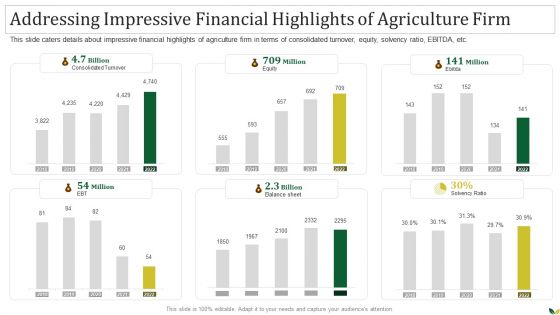
Agribusiness Addressing Impressive Financial Highlights Of Agriculture Firm Elements PDF
This slide caters details about impressive financial highlights of agriculture firm in terms of consolidated turnover, equity, solvency ratio, EBITDA, etc. Deliver and pitch your topic in the best possible manner with this Agribusiness Addressing Impressive Financial Highlights Of Agriculture Firm Elements PDF. Use them to share invaluable insights on Consolidated Turnover, Equity, Balance sheet, Solvency Ratio and impress your audience. This template can be altered and modified as per your expectations. So, grab it now.
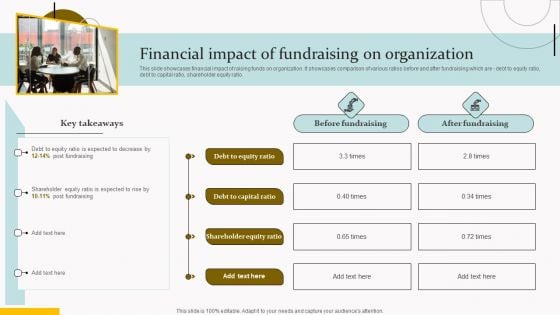
Financial Impact Of Fundraising On Organization Microsoft PDF
This slide showcases financial impact of raising funds on organization. It showcases comparison of various ratios before and after fundraising which are debt to equity ratio, debt to capital ratio, shareholder equity ratio. Whether you have daily or monthly meetings, a brilliant presentation is necessary. Financial Impact Of Fundraising On Organization Microsoft PDF can be your best option for delivering a presentation. Represent everything in detail using Financial Impact Of Fundraising On Organization Microsoft PDF and make yourself stand out in meetings. The template is versatile and follows a structure that will cater to your requirements. All the templates prepared by Slidegeeks are easy to download and edit. Our research experts have taken care of the corporate themes as well. So, give it a try and see the results.
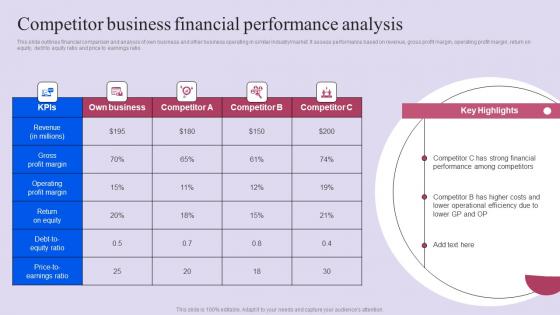
Competitor Business Financial Performance Analysis Ppt Slides Display Pdf
This slide outlines financial comparison and analysis of own business and other business operating in similar industrymarket. It assess performance based on revenue, gross profit margin, operating profit margin, return on equity, debt to equity ratio and price to earnings ratio. Do you have an important presentation coming up Are you looking for something that will make your presentation stand out from the rest Look no further than Competitor Business Financial Performance Analysis Ppt Slides Display Pdf. With our professional designs, you can trust that your presentation will pop and make delivering it a smooth process. And with Slidegeeks, you can trust that your presentation will be unique and memorable. So why wait Grab Competitor Business Financial Performance Analysis Ppt Slides Display Pdf today and make your presentation stand out from the rest This slide outlines financial comparison and analysis of own business and other business operating in similar industrymarket. It assess performance based on revenue, gross profit margin, operating profit margin, return on equity, debt to equity ratio and price to earnings ratio.
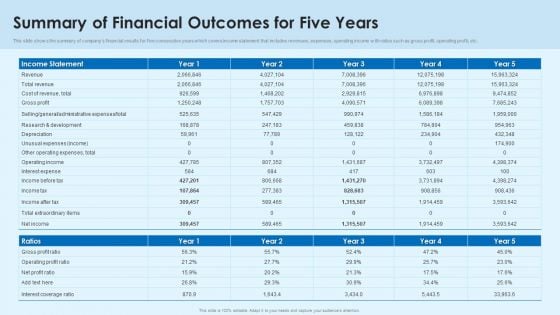
Summary Of Financial Outcomes For Five Years Guidelines PDF
This slide shows the summary of companys financial results for five consecutive years which covers income statement that includes revenues, expenses, operating income with ratios such as gross profit, operating profit, etc.Pitch your topic with ease and precision using this Summary Of Financial Outcomes For Five Years Guidelines PDF This layout presents information on Income Statement, Administrative Expenses, Total Extraordinary It is also available for immediate download and adjustment. So, changes can be made in the color, design, graphics or any other component to create a unique layout.

Business Financial Controller In Powerpoint And Google Slides Cpb
Introducing our well designed Business Financial Controller In Powerpoint And Google Slides Cpb. This PowerPoint design presents information on topics like Business Financial Controller. As it is predesigned it helps boost your confidence level. It also makes you a better presenter because of its high quality content and graphics. This PPT layout can be downloaded and used in different formats like PDF, PNG, and JPG. Not only this, it is available in both Standard Screen and Widescreen aspect ratios for your convenience. Therefore, click on the download button now to persuade and impress your audience. Our Business Financial Controller In Powerpoint And Google Slides Cpb are topically designed to provide an attractive backdrop to any subject. Use them to look like a presentation pro.
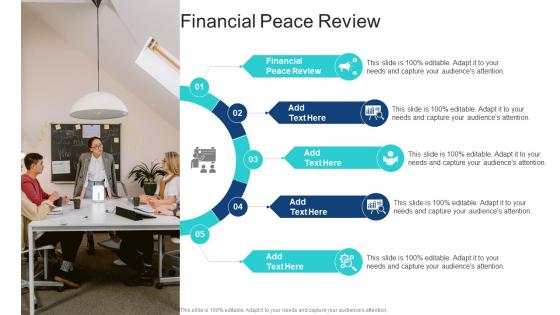
Financial Peace Review In Powerpoint And Google Slides Cpb
Introducing our well designed Financial Peace Review In Powerpoint And Google Slides Cpb. This PowerPoint design presents information on topics like Financial Peace Review. As it is predesigned it helps boost your confidence level. It also makes you a better presenter because of its high quality content and graphics. This PPT layout can be downloaded and used in different formats like PDF, PNG, and JPG. Not only this, it is available in both Standard Screen and Widescreen aspect ratios for your convenience. Therefore, click on the download button now to persuade and impress your audience. Our Financial Peace Review In Powerpoint And Google Slides Cpb are topically designed to provide an attractive backdrop to any subject. Use them to look like a presentation pro.

Budget Webb Financial In Powerpoint And Google Slides Cpb
Introducing our well designed Budget Webb Financial In Powerpoint And Google Slides Cpb. This PowerPoint design presents information on topics like Budget Webb Financial. As it is predesigned it helps boost your confidence level. It also makes you a better presenter because of its high quality content and graphics. This PPT layout can be downloaded and used in different formats like PDF, PNG, and JPG. Not only this, it is available in both Standard Screen and Widescreen aspect ratios for your convenience. Therefore, click on the download button now to persuade and impress your audience. Our Budget Webb Financial In Powerpoint And Google Slides Cpb are topically designed to provide an attractive backdrop to any subject. Use them to look like a presentation pro.
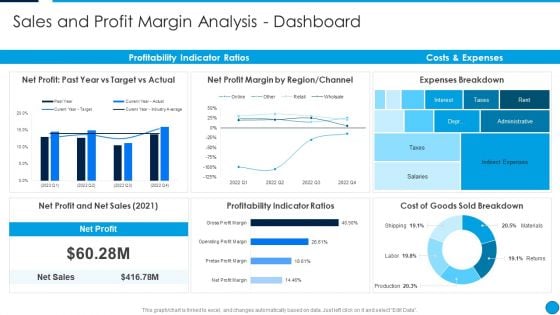
Summary Financial Sales And Profit Margin Analysis Dashboard Pictures PDF
This graph or chart is linked to excel, and changes automatically based on data. Just left click on it and select Edit Data. Deliver an awe inspiring pitch with this creative Summary Financial Sales And Profit Margin Analysis Dashboard Pictures PDF bundle. Topics like Net Profit, Past Year Vs Target Vs Actual, Net Profit Margin By Region, Channel, Expenses Breakdown, Costs And Expenses, Profitability Indicator Ratios can be discussed with this completely editable template. It is available for immediate download depending on the needs and requirements of the user.
Top Financial Advisors In Powerpoint And Google Slides Cpb
Introducing our well designed Top Financial Advisors In Powerpoint And Google Slides Cpb. This PowerPoint design presents information on topics like Top Financial Advisors. As it is predesigned it helps boost your confidence level. It also makes you a better presenter because of its high-quality content and graphics. This PPT layout can be downloaded and used in different formats like PDF, PNG, and JPG. Not only this, it is available in both Standard Screen and Widescreen aspect ratios for your convenience. Therefore, click on the download button now to persuade and impress your audience. Our Top Financial Advisors In Powerpoint And Google Slides Cpb are topically designed to provide an attractive backdrop to any subject. Use them to look like a presentation pro.

Power BI Financial Reporting In Powerpoint And Google Slides Cpb
Introducing our well-designed Power BI Financial Reporting In Powerpoint And Google Slides Cpb. This PowerPoint design presents information on topics like Power BI Financial Reporting. As it is predesigned it helps boost your confidence level. It also makes you a better presenter because of its high-quality content and graphics. This PPT layout can be downloaded and used in different formats like PDF, PNG, and JPG. Not only this, it is available in both Standard Screen and Widescreen aspect ratios for your convenience. Therefore, click on the download button now to persuade and impress your audience. Our Power BI Financial Reporting In Powerpoint And Google Slides Cpb are topically designed to provide an attractive backdrop to any subject. Use them to look like a presentation pro.

Company Financial Report In Powerpoint And Google Slides Cpb
Introducing our well designed Company Financial Report In Powerpoint And Google Slides Cpb. This PowerPoint design presents information on topics like Company Financial Report. As it is predesigned it helps boost your confidence level. It also makes you a better presenter because of its high quality content and graphics. This PPT layout can be downloaded and used in different formats like PDF, PNG, and JPG. Not only this, it is available in both Standard Screen and Widescreen aspect ratios for your convenience. Therefore, click on the download button now to persuade and impress your audience. Our Company Financial Report In Powerpoint And Google Slides Cpb are topically designed to provide an attractive backdrop to any subject. Use them to look like a presentation pro.
Reconsolidation Financial Optimization In Powerpoint And Google Slides Cpb
Introducing our well designed Reconsolidation Financial Optimization In Powerpoint And Google Slides Cpb This PowerPoint design presents information on topics like Reconsolidation Financial Optimization As it is predesigned it helps boost your confidence level. It also makes you a better presenter because of its high quality content and graphics. This PPT layout can be downloaded and used in different formats like PDF, PNG, and JPG. Not only this, it is available in both Standard Screen and Widescreen aspect ratios for your convenience. Therefore, click on the download button now to persuade and impress your audience. Our Reconsolidation Financial Optimization In Powerpoint And Google Slides Cpb are topically designed to provide an attractive backdrop to any subject. Use them to look like a presentation pro.

Everyday Financial Management In Powerpoint And Google Slides Cpb
Introducing our well-designed Everyday Financial Management In Powerpoint And Google Slides Cpb. This PowerPoint design presents information on topics like Everyday Financial Management. As it is predesigned it helps boost your confidence level. It also makes you a better presenter because of its high-quality content and graphics. This PPT layout can be downloaded and used in different formats like PDF, PNG, and JPG. Not only this, it is available in both Standard Screen and Widescreen aspect ratios for your convenience. Therefore, click on the download button now to persuade and impress your audience. Our Everyday Financial Management In Powerpoint And Google Slides Cpb are topically designed to provide an attractive backdrop to any subject. Use them to look like a presentation pro.


 Continue with Email

 Home
Home


