Financial Ratios
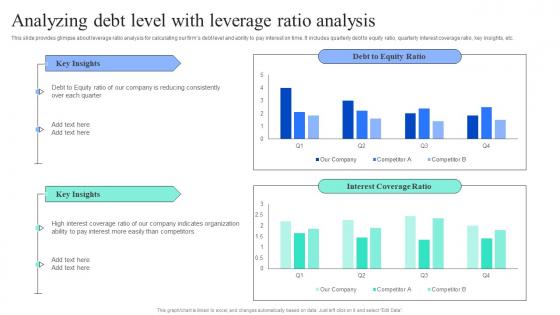
Strategic Financial Planning And Administration Analyzing Debt Level With Leverage Template PDF
This slide provides glimpse about leverage ratio analysis for calculating our firms debt level and ability to pay interest on time. It includes quarterly debt to equity ratio, quarterly interest coverage ratio, key insights, etc. Do you have to make sure that everyone on your team knows about any specific topic I yes, then you should give Strategic Financial Planning And Administration Analyzing Debt Level With Leverage Template PDF a try. Our experts have put a lot of knowledge and effort into creating this impeccable Strategic Financial Planning And Administration Analyzing Debt Level With Leverage Template PDF. You can use this template for your upcoming presentations, as the slides are perfect to represent even the tiniest detail. You can download these templates from the Slidegeeks website and these are easy to edit. So grab these today This slide provides glimpse about leverage ratio analysis for calculating our firms debt level and ability to pay interest on time. It includes quarterly debt to equity ratio, quarterly interest coverage ratio, key insights, etc.
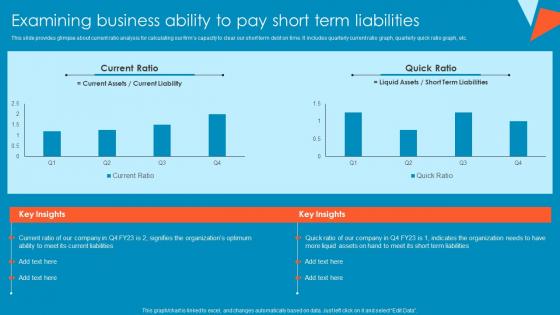
Examining Business Ability To Pay Short Term Liabilities Tactical Financial Governance Brochure Pdf
This slide provides glimpse about current ratio analysis for calculating our firms capacity to clear our short term debt on time. It includes quarterly current ratio graph, quarterly quick ratio graph, etc.Presenting this PowerPoint presentation, titled Examining Business Ability To Pay Short Term Liabilities Tactical Financial Governance Brochure Pdf, with topics curated by our researchers after extensive research. This editable presentation is available for immediate download and provides attractive features when used. Download now and captivate your audience. Presenting this Examining Business Ability To Pay Short Term Liabilities Tactical Financial Governance Brochure Pdf. Our researchers have carefully researched and created these slides with all aspects taken into consideration. This is a completely customizable Examining Business Ability To Pay Short Term Liabilities Tactical Financial Governance Brochure Pdf that is available for immediate downloading. Download now and make an impact on your audience. Highlight the attractive features available with our PPTs. This slide provides glimpse about current ratio analysis for calculating our firms capacity to clear our short term debt on time. It includes quarterly current ratio graph, quarterly quick ratio graph, etc.
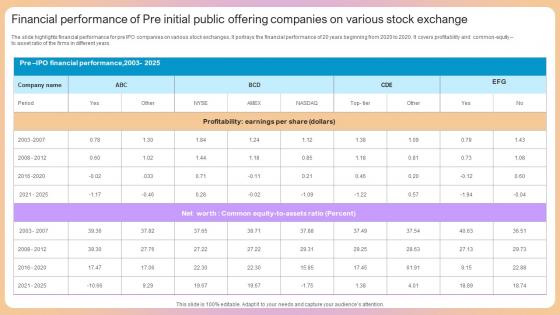
Financial Performance Of Pre Initial Public Offering Companies On Various Stock Exchange Rules Pdf
The slide highlights financial performance for pre IPO companies on various stock exchanges, It portrays the financial performance of 20 years beginning from 2020 to 2020. It covers profitability and common-equity to asset ratio of the firms in different years. Showcasing this set of slides titled Financial Performance Of Pre Initial Public Offering Companies On Various Stock Exchange Rules Pdf The topics addressed in these templates are Financial Performance, Profitability, Common Equity To Assets All the content presented in this PPT design is completely editable. Download it and make adjustments in color, background, font etc. as per your unique business setting. The slide highlights financial performance for pre IPO companies on various stock exchanges, It portrays the financial performance of 20 years beginning from 2020 to 2020. It covers profitability and common-equity to asset ratio of the firms in different years.
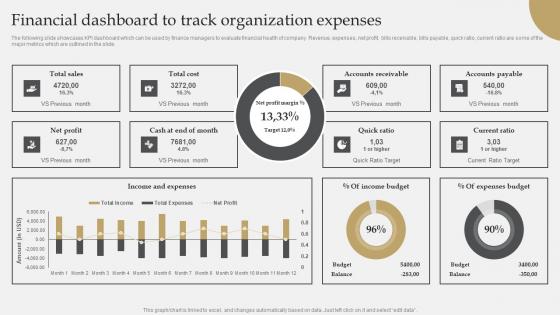
IT Industry Market Research Financial Dashboard To Track Organization Expenses Introduction Pdf
The following slide showcases KPI dashboard which can be used by finance managers to evaluate financial health of company. Revenue, expenses, net profit, bills receivable, bills payable, quick ratio, current ratio are some of the major metrics which are outlined in the slide. Present like a pro with IT Industry Market Research Financial Dashboard To Track Organization Expenses Introduction Pdf Create beautiful presentations together with your team, using our easy-to-use presentation slides. Share your ideas in real-time and make changes on the fly by downloading our templates. So whether you are in the office, on the go, or in a remote location, you can stay in sync with your team and present your ideas with confidence. With Slidegeeks presentation got a whole lot easier. Grab these presentations today. The following slide showcases KPI dashboard which can be used by finance managers to evaluate financial health of company. Revenue, expenses, net profit, bills receivable, bills payable, quick ratio, current ratio are some of the major metrics which are outlined in the slide.
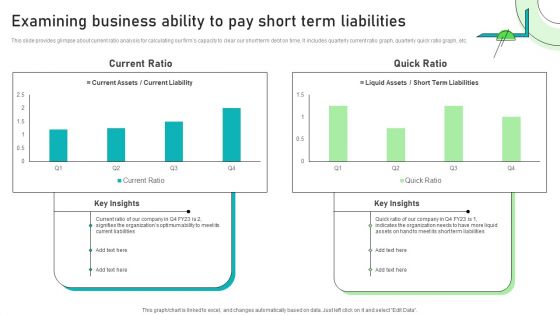
Adjusting Financial Strategies And Planning Examining Business Ability To Pay Short Term Liabilities Guidelines PDF
This slide provides glimpse about current ratio analysis for calculating our firms capacity to clear our short term debt on time. It includes quarterly current ratio graph, quarterly quick ratio graph, etc. Welcome to our selection of the Adjusting Financial Strategies And Planning Examining Business Ability To Pay Short Term Liabilities Guidelines PDF. These are designed to help you showcase your creativity and bring your sphere to life. Planning and Innovation are essential for any business that is just starting out. This collection contains the designs that you need for your everyday presentations. All of our PowerPoints are 100 percent editable, so you can customize them to suit your needs. This multi purpose template can be used in various situations. Grab these presentation templates today.
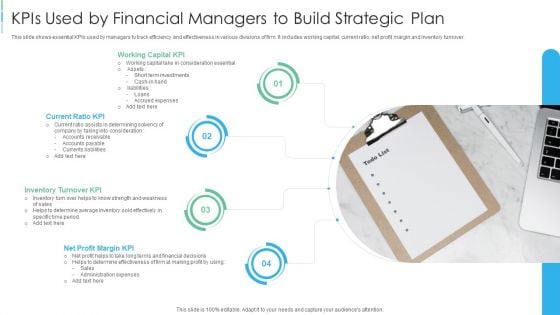
Kpis Used By Financial Managers To Build Strategic Plan Diagrams PDF
This slide shows essential KPIs used by managers to track efficiency and effectiveness in various divisions of firm. It includes working capital, current ratio, net profit margin and inventory turnover.Presenting Kpis Used By Financial Managers To Build Strategic Plan Diagrams PDF to dispense important information. This template comprises four stages. It also presents valuable insights into the topics including Working Capital KPI, Current Ratio KPI, Inventory Turnover KPI. This is a completely customizable PowerPoint theme that can be put to use immediately. So, download it and address the topic impactfully.
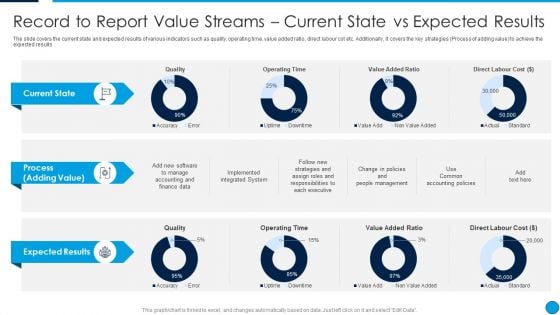
Summary Financial Record To Report Value Streams Current State Vs Expected Results Template PDF
The slide covers the current state and expected results of various indicators such as quality, operating time, value added ratio, direct labour cot etc. Additionally, it covers the key strategies Process of adding value to achieve the expected results. Deliver an awe inspiring pitch with this creative Summary Financial Record To Report Value Streams Current State Vs Expected Results Template PDF bundle. Topics like Current State, Process, Adding Value, Expected Results, Operating Time, Value Added Ratio can be discussed with this completely editable template. It is available for immediate download depending on the needs and requirements of the user.
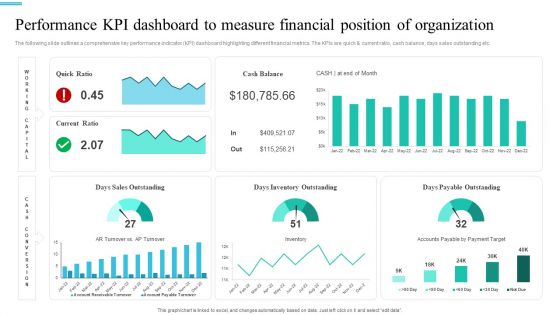
Monetary Planning And Evaluation Guide Performance KPI Dashboard To Measure Financial Position Of Organization Ppt File Slides PDF
The following slide outlines a comprehensive key performance indicator KPI dashboard highlighting different financial metrics. The KPIs are quick and current ratio, cash balance, days sales outstanding etc. The best PPT templates are a great way to save time, energy, and resources. Slidegeeks have 100 percent editable powerpoint slides making them incredibly versatile. With these quality presentation templates, you can create a captivating and memorable presentation by combining visually appealing slides and effectively communicating your message. Download Monetary Planning And Evaluation Guide Performance KPI Dashboard To Measure Financial Position Of Organization Ppt File Slides PDF from Slidegeeks and deliver a wonderful presentation.
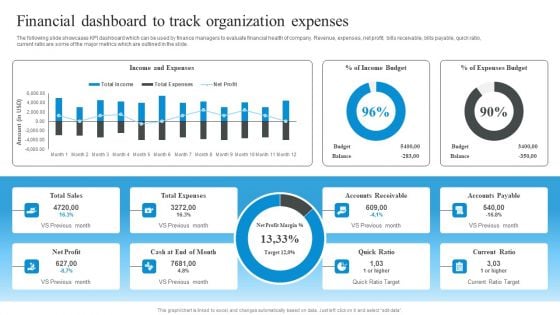
Market Evaluation Of IT Industry Financial Dashboard To Track Organization Expenses Clipart PDF
The following slide showcases KPI dashboard which can be used by finance managers to evaluate financial health of company. Revenue, expenses, net profit, bills receivable, bills payable, quick ratio, current ratio are some of the major metrics which are outlined in the slide. Do you have an important presentation coming up Are you looking for something that will make your presentation stand out from the rest Look no further than Market Evaluation Of IT Industry Financial Dashboard To Track Organization Expenses Clipart PDF. With our professional designs, you can trust that your presentation will pop and make delivering it a smooth process. And with Slidegeeks, you can trust that your presentation will be unique and memorable. So why wait Grab Market Evaluation Of IT Industry Financial Dashboard To Track Organization Expenses Clipart PDF today and make your presentation stand out from the rest.
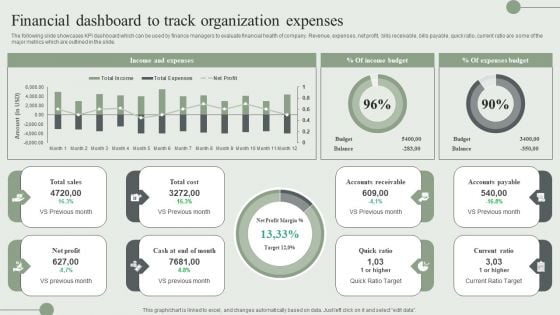
Financial Dashboard To Track Organization Expenses Ppt PowerPoint Presentation File Ideas PDF
The following slide showcases KPI dashboard which can be used by finance managers to evaluate financial health of company. Revenue, expenses, net profit, bills receivable, bills payable, quick ratio, current ratio are some of the major metrics which are outlined in the slide. Boost your pitch with our creative Financial Dashboard To Track Organization Expenses Ppt PowerPoint Presentation File Ideas PDF. Deliver an awe-inspiring pitch that will mesmerize everyone. Using these presentation templates you will surely catch everyones attention. You can browse the ppts collection on our website. We have researchers who are experts at creating the right content for the templates. So you do not have to invest time in any additional work. Just grab the template now and use them.
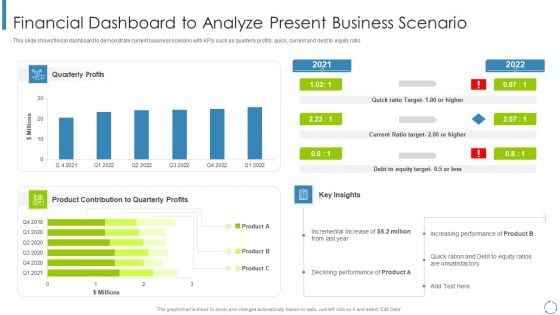
Internal And External Business Environment Analysis Financial Dashboard To Analyze Present Business Scenario Topics PDF
This slide shows finical dashboard to demonstrate current business scenario with KPIs such as quarterly profits, quick, current and debt to equity ratio Deliver and pitch your topic in the best possible manner with this internal and external business environment analysis financial dashboard to analyze present business scenario topics pdf Use them to share invaluable insights on product contribution to quarterly, incremental increase, declining performance and impress your audience. This template can be altered and modified as per your expectations. So, grab it now.
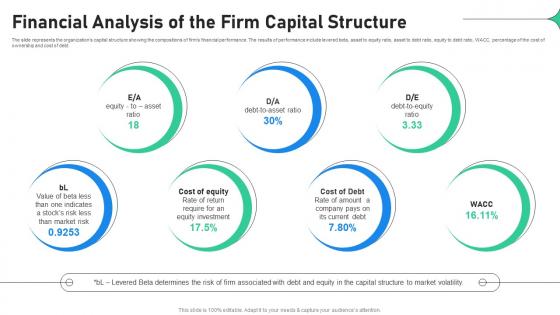
Financial Analysis Of The Firm Capital Increasing Profitability Through Better Product
The slide represents the organizations capital structure showing the compositions of firms financial performance. The results of performance include levered beta, asset to equity ratio, asset to debt ratio, equity to debt ratio, WACC, percentage of the cost of ownership and cost of debt. If your project calls for a presentation, then Slidegeeks is your go-to partner because we have professionally designed, easy-to-edit templates that are perfect for any presentation. After downloading, you can easily edit Financial Analysis Of The Firm Capital Increasing Profitability Through Better Product and make the changes accordingly. You can rearrange slides or fill them with different images. Check out all the handy templates The slide represents the organizations capital structure showing the compositions of firms financial performance. The results of performance include levered beta, asset to equity ratio, asset to debt ratio, equity to debt ratio, WACC, percentage of the cost of ownership and cost of debt.
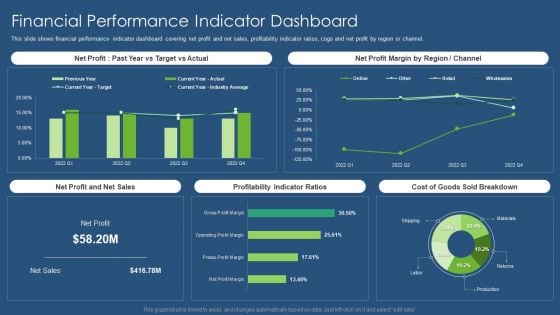
Sustainability Calculation With KPI Financial Performance Indicator Dashboard Infographics PDF Template PDF
This slide shows financial performance indicator dashboard covering net profit and net sales, profitability indicator ratios, cogs and net profit by region or channel. Deliver an awe inspiring pitch with this creative sustainability calculation with kpi financial performance indicator dashboard infographics pdf bundle. Topics like net profit margin, net profit and net sales, profitability indicator ratios, sold breakdown can be discussed with this completely editable template. It is available for immediate download depending on the needs and requirements of the user.

Paypal Hacked Compromised Financial Information In Powerpoint And Google Slides Cpb
Presenting our innovatively-designed set of slides titled Paypal Hacked Compromised Financial Information In Powerpoint And Google Slides Cpb. This completely editable PowerPoint graphic exhibits Paypal Hacked Compromised Financial Information that will help you convey the message impactfully. It can be accessed with Google Slides and is available in both standard screen and widescreen aspect ratios. Apart from this, you can download this well-structured PowerPoint template design in different formats like PDF, JPG, and PNG. So, click the download button now to gain full access to this PPT design. Our Paypal Hacked Compromised Financial Information In Powerpoint And Google Slides Cpb are topically designed to provide an attractive backdrop to any subject. Use them to look like a presentation pro.
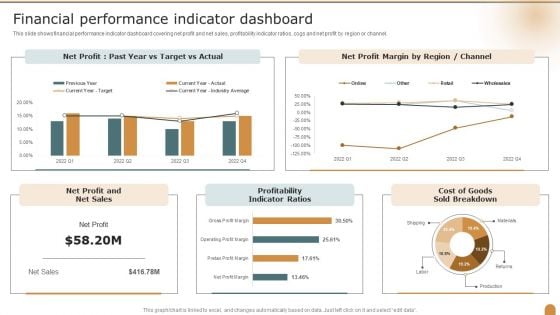
Financial Performance Indicator Dashboard Company Performance Evaluation Using KPI Structure PDF
This slide shows financial performance indicator dashboard covering net profit and net sales, profitability indicator ratios, cogs and net profit by region or channel. Deliver and pitch your topic in the best possible manner with this Financial Performance Indicator Dashboard Company Performance Evaluation Using KPI Structure PDF. Use them to share invaluable insights on Financial Performance, Indicator Dashboard, Profitability Indicator and impress your audience. This template can be altered and modified as per your expectations. So, grab it now.
Cash Flow Handling Money Financial Management In Powerpoint And Google Slides Cpb
Presenting our innovatively designed set of slides titled Cash Flow Handling Money Financial Management In Powerpoint And Google Slides Cpb. This completely editable PowerPoint graphic exhibits Cash Flow Handling Money Financial Management that will help you convey the message impactfully. It can be accessed with Google Slides and is available in both standard screen and widescreen aspect ratios. Apart from this, you can download this well structured PowerPoint template design in different formats like PDF, JPG, and PNG. So, click the download button now to gain full access to this PPT design. Our Cash Flow Handling Money Financial Management In Powerpoint And Google Slides Cpb are topically designed to provide an attractive backdrop to any subject. Use them to look like a presentation pro.
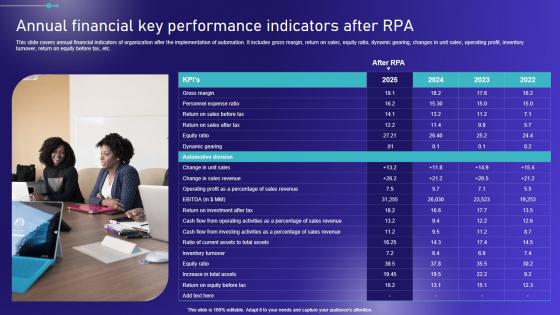
Annual Financial Key Performance Indicators After Embracing Robotic Process Elements PDF
This slide covers annual financial indicators of organization after the implementation of automation. It includes gross margin, return on sales, equity ratio, dynamic gearing, changes in unit sales, operating profit, inventory turnover, return on equity before tax, etc. Slidegeeks is one of the best resources for PowerPoint templates. You can download easily and regulate Annual Financial Key Performance Indicators After Embracing Robotic Process Elements PDF for your personal presentations from our wonderful collection. A few clicks is all it takes to discover and get the most relevant and appropriate templates. Use our Templates to add a unique zing and appeal to your presentation and meetings. All the slides are easy to edit and you can use them even for advertisement purposes. This slide covers annual financial indicators of organization after the implementation of automation. It includes gross margin, return on sales, equity ratio, dynamic gearing, changes in unit sales, operating profit, inventory turnover, return on equity before tax, etc.
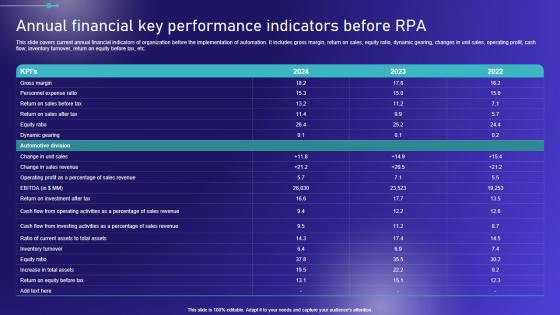
Annual Financial Key Performance Indicators Before Embracing Robotic Process Graphics PDF
This slide covers current annual financial indicators of organization before the implementation of automation. It includes gross margin, return on sales, equity ratio, dynamic gearing, changes in unit sales, operating profit, cash flow, inventory turnover, return on equity before tax, etc. Want to ace your presentation in front of a live audience Our Annual Financial Key Performance Indicators Before Embracing Robotic Process Graphics PDF can help you do that by engaging all the users towards you. Slidegeeks experts have put their efforts and expertise into creating these impeccable powerpoint presentations so that you can communicate your ideas clearly. Moreover, all the templates are customizable, and easy-to-edit and downloadable. Use these for both personal and commercial use. This slide covers current annual financial indicators of organization before the implementation of automation. It includes gross margin, return on sales, equity ratio, dynamic gearing, changes in unit sales, operating profit, cash flow, inventory turnover, return on equity before tax, etc.
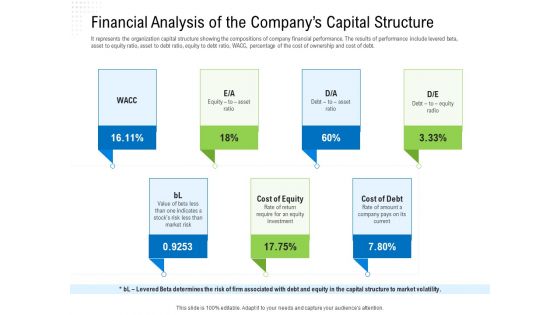
Revaluate Capital Structure Resolution Financial Analysis Of The Companys Capital Structure Introduction PDF
It represents the organization capital structure showing the compositions of company financial performance. The results of performance include levered beta, asset to equity ratio, asset to debt ratio, equity to debt ratio, WACC, percentage of the cost of ownership and cost of debt.This is a revaluate capital structure resolution financial analysis of the companys capital structure introduction pdf. template with various stages. Focus and dispense information on seven stages using this creative set, that comes with editable features. It contains large content boxes to add your information on topics like cost equity, cost debt, value, indicates, investment. You can also showcase facts, figures, and other relevant content using this PPT layout. Grab it now.
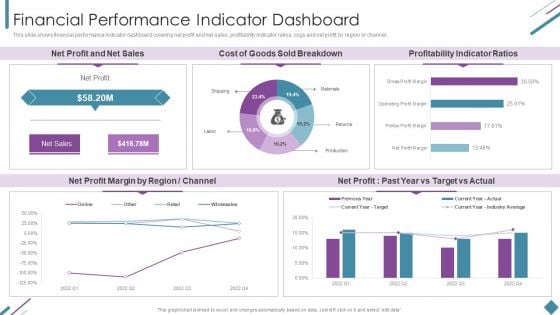
Metrics To Measure Business Performance Financial Performance Indicator Dashboard Pictures PDF
This slide shows financial performance indicator dashboard covering net profit and net sales, profitability indicator ratios, cogs and net profit by region or channel. Deliver an awe inspiring pitch with this creative Metrics To Measure Business Performance Financial Performance Indicator Dashboard Pictures PDF bundle. Topics like Net Profit, Net Sales, Cost Goods, Sold Breakdown can be discussed with this completely editable template. It is available for immediate download depending on the needs and requirements of the user.
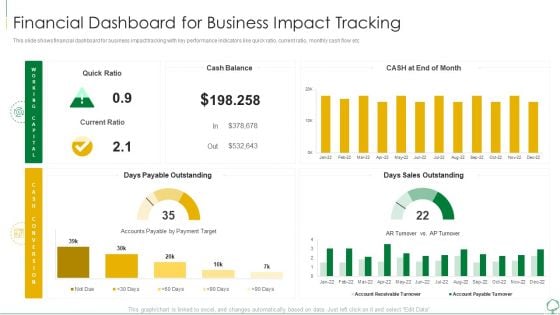
Environmental Examination Tools And Approaches Financial Dashboard For Business Professional PDF
This slide shows financial dashboard for business impact tracking with key performance indicators like quick ratio, current ratio, monthly cash flow etc. Deliver an awe inspiring pitch with this creative environmental examination tools and approaches financial dashboard for business professional pdf bundle. Topics like financial dashboard for business impact tracking can be discussed with this completely editable template. It is available for immediate download depending on the needs and requirements of the user.
Internal And External Business Environment Analysis Financial Dashboard For Business Impact Tracking Formats PDF
This slide shows financial dashboard for business impact tracking with key performance indicators like quick ratio, current ratio, monthly cash flow etc Deliver an awe inspiring pitch with this creative internal and external business environment analysis financial dashboard for business impact tracking formats pdf bundle. Topics like financial dashboard for business impact tracking can be discussed with this completely editable template. It is available for immediate download depending on the needs and requirements of the user.
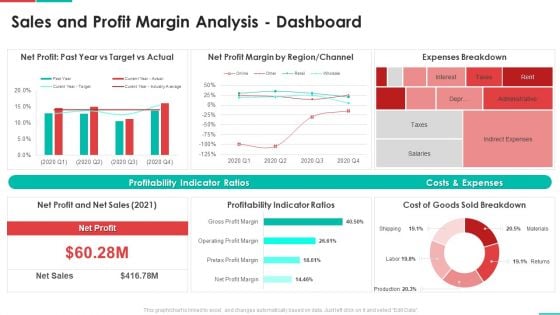
Roadmap For Financial Accounting Transformation Sales And Profit Margin Analysis Dashboard Pictures PDF
Deliver an awe inspiring pitch with this creative roadmap for financial accounting transformation sales and profit margin analysis dashboard pictures pdf bundle. Topics like profitability indicator ratios, costs and expenses, expenses breakdown can be discussed with this completely editable template. It is available for immediate download depending on the needs and requirements of the user.
Strategic Financial Planning And Administration Tracking The Cashflow Improvements Cash Themes PDF
This slide showcases the KPIs that would help our business organization to track the improvements in the new cash management process. It includes quick ratio, cash balance, current ratio, days inventory outstanding, etc. Slidegeeks is one of the best resources for PowerPoint templates. You can download easily and regulate Strategic Financial Planning And Administration Tracking The Cashflow Improvements Cash Themes PDF for your personal presentations from our wonderful collection. A few clicks is all it takes to discover and get the most relevant and appropriate templates. Use our Templates to add a unique zing and appeal to your presentation and meetings. All the slides are easy to edit and you can use them even for advertisement purposes. This slide showcases the KPIs that would help our business organization to track the improvements in the new cash management process. It includes quick ratio, cash balance, current ratio, days inventory outstanding, etc.
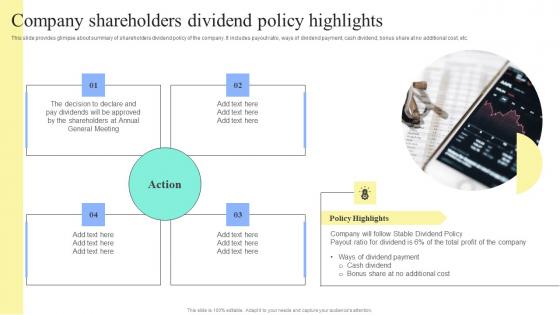
Strategic Financial Planning And Administration Company Shareholders Dividend Policy Highlights Guidelines PDF
This slide provides glimpse about summary of shareholders dividend policy of the company. It includes payout ratio, ways of dividend payment, cash dividend, bonus share at no additional cost, etc. If you are looking for a format to display your unique thoughts, then the professionally designed Strategic Financial Planning And Administration Company Shareholders Dividend Policy Highlights Guidelines PDF is the one for you. You can use it as a Google Slides template or a PowerPoint template. Incorporate impressive visuals, symbols, images, and other charts. Modify or reorganize the text boxes as you desire. Experiment with shade schemes and font pairings. Alter, share or cooperate with other people on your work. Download Strategic Financial Planning And Administration Company Shareholders Dividend Policy Highlights Guidelines PDF and find out how to give a successful presentation. Present a perfect display to your team and make your presentation unforgettable. This slide provides glimpse about summary of shareholders dividend policy of the company. It includes payout ratio, ways of dividend payment, cash dividend, bonus share at no additional cost, etc.
Environmental Assessment Financial Dashboard For Business Impact Tracking Ppt Layouts Guidelines PDF
This slide shows financial dashboard for business impact tracking with key performance indicators like quick ratio, current ratio, monthly cash flow etc Deliver and pitch your topic in the best possible manner with this environmental assessment financial dashboard for business impact tracking ppt layouts guidelines pdf. Use them to share invaluable insights on sales outstanding, cash balance, accounts payable and impress your audience. This template can be altered and modified as per your expectations. So, grab it now.
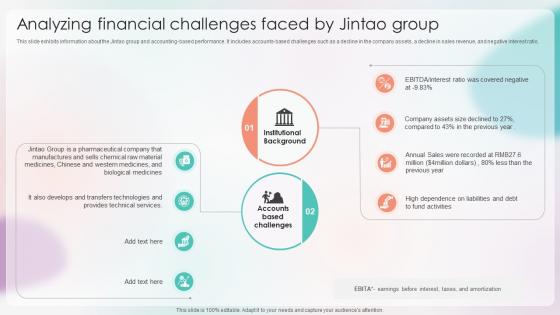
Strategies For Stabilizing Corporate Analyzing Financial Challenges Faced By Jintao Group
This slide exhibits information about the Jintao group and accounting-based performance. It includes accounts-based challenges such as a decline in the company assets, a decline in sales revenue, and negative interest ratio. Slidegeeks is one of the best resources for PowerPoint templates. You can download easily and regulate Strategies For Stabilizing Corporate Analyzing Financial Challenges Faced By Jintao Group for your personal presentations from our wonderful collection. A few clicks is all it takes to discover and get the most relevant and appropriate templates. Use our Templates to add a unique zing and appeal to your presentation and meetings. All the slides are easy to edit and you can use them even for advertisement purposes. This slide exhibits information about the Jintao group and accounting-based performance. It includes accounts-based challenges such as a decline in the company assets, a decline in sales revenue, and negative interest ratio.
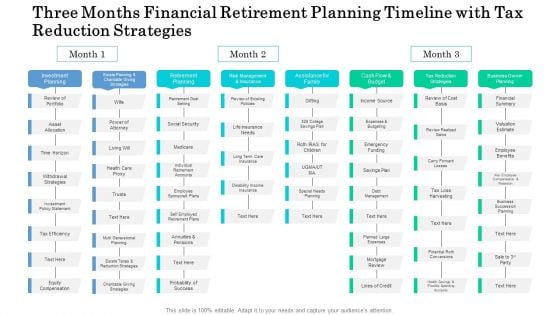
Three Months Financial Retirement Planning Timeline With Tax Reduction Strategies Microsoft
Introducing our three months financial retirement planning timeline with tax reduction strategies microsoft. This PPT presentation is Google Slides compatible, therefore, you can share it easily with the collaborators for measuring the progress. Also, the presentation is available in both standard screen and widescreen aspect ratios. So edit the template design by modifying the font size, font type, color, and shapes as per your requirements. As this PPT design is fully editable it can be presented in PDF, JPG and PNG formats.
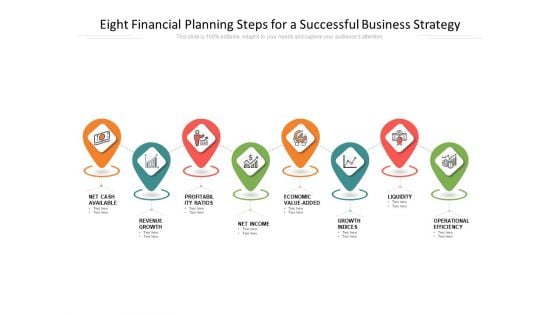
Eight Financial Planning Steps For A Successful Business Strategy Ppt PowerPoint Presentation Gallery Graphics Download PDF
Presenting eight financial planning steps for a successful business strategy ppt powerpoint presentation gallery graphics download pdf. to dispense important information. This template comprises eight stages. It also presents valuable insights into the topics including growth indices, operational efficiency, economic value added, net income, revenue growth, profitability ratios, net cash available, liquidity. This is a completely customizable PowerPoint theme that can be put to use immediately. So, download it and address the topic impactfully.
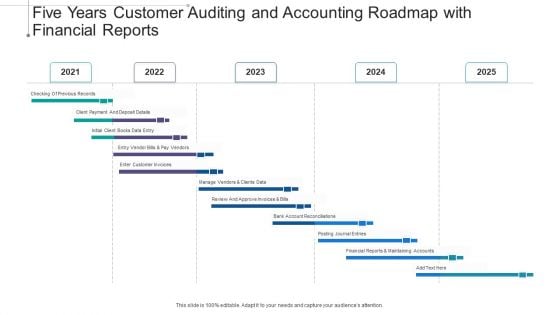
Five Years Customer Auditing And Accounting Roadmap With Financial Reports Slides
Presenting our innovatively structured five years customer auditing and accounting roadmap with financial reports slides Template. Showcase your roadmap process in different formats like PDF, PNG, and JPG by clicking the download button below. This PPT design is available in both Standard Screen and Widescreen aspect ratios. It can also be easily personalized and presented with modified font size, font type, color, and shapes to measure your progress in a clear way.
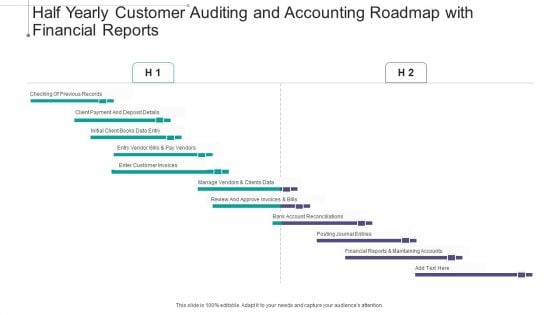
Half Yearly Customer Auditing And Accounting Roadmap With Financial Reports Template
Presenting our innovatively structured half yearly customer auditing and accounting roadmap with financial reports template Template. Showcase your roadmap process in different formats like PDF, PNG, and JPG by clicking the download button below. This PPT design is available in both Standard Screen and Widescreen aspect ratios. It can also be easily personalized and presented with modified font size, font type, color, and shapes to measure your progress in a clear way.
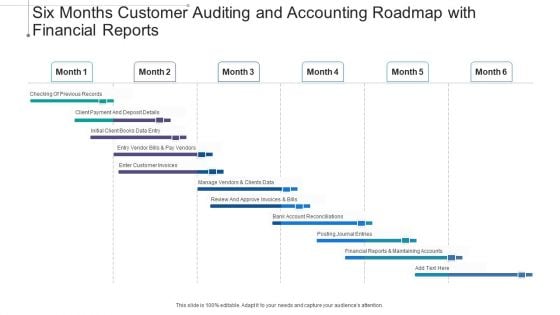
Six Months Customer Auditing And Accounting Roadmap With Financial Reports Infographics
Presenting our innovatively structured six months customer auditing and accounting roadmap with financial reports infographics Template. Showcase your roadmap process in different formats like PDF, PNG, and JPG by clicking the download button below. This PPT design is available in both Standard Screen and Widescreen aspect ratios. It can also be easily personalized and presented with modified font size, font type, color, and shapes to measure your progress in a clear way.

Summary Financial Accounting Statement Profit And Loss Analysis Dashboard Elements PDF
This graph or chart is linked to excel, and changes automatically based on data. Just left click on it and select Edit Data. Deliver an awe inspiring pitch with this creative Summary Financial Accounting Statement Profit And Loss Analysis Dashboard Elements PDF bundle. Topics like P And L Structure Dynamics, Dupont Rations, Debt Coverage Ratios, Creditworthiness Assessment can be discussed with this completely editable template. It is available for immediate download depending on the needs and requirements of the user.
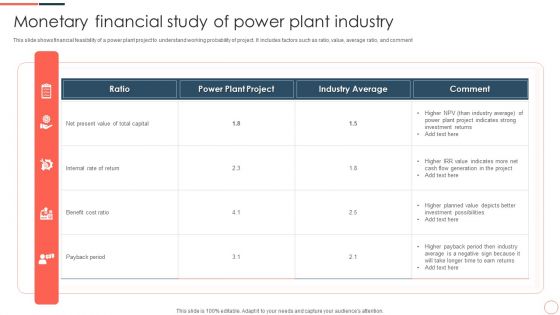
Monetary Financial Study Of Power Plant Industry Ppt Model Pictures PDF
This slide shows financial feasibility of a power plant project to understand working probability of project. It includes factors such as ratio, value, average ratio, and comment. Showcasing this set of slides titled Monetary Financial Study Of Power Plant Industry Ppt Model Pictures PDF. The topics addressed in these templates are Power Plant Project, Ratio, Industry Average, Payback Period. All the content presented in this PPT design is completely editable. Download it and make adjustments in color, background, font etc. as per your unique business setting.
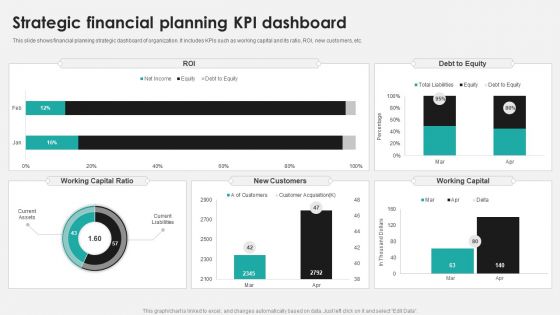
Strategic Financial Planning KPI Dashboard Ppt PowerPoint Presentation Layouts Background Designs PDF
This slide shows financial planning strategic dashboard of organization. It includes KPIs such as working capital and its ratio, ROI, new customers, etc. Pitch your topic with ease and precision using this Strategic Financial Planning KPI Dashboard Ppt PowerPoint Presentation Layouts Background Designs PDF. This layout presents information on New Customers, Working Capital, Debt Equity. It is also available for immediate download and adjustment. So, changes can be made in the color, design, graphics or any other component to create a unique layout.
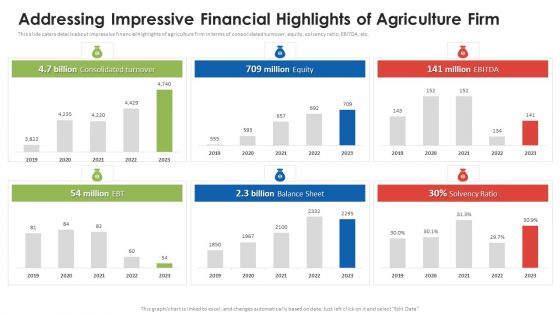
Agribusiness Startup Addressing Impressive Financial Highlights Of Agriculture Firm Sample PDF
This slide caters details about impressive financial highlights of agriculture firm in terms of consolidated turnover, equity, solvency ratio, EBITDA, etc. Get a simple yet stunning designed Agribusiness Startup Addressing Impressive Financial Highlights Of Agriculture Firm Sample PDF. It is the best one to establish the tone in your meetings. It is an excellent way to make your presentations highly effective. So, download this PPT today from Slidegeeks and see the positive impacts. Our easy-to-edit Agribusiness Startup Addressing Impressive Financial Highlights Of Agriculture Firm Sample PDF can be your go-to option for all upcoming conferences and meetings. So, what are you waiting for Grab this template today.
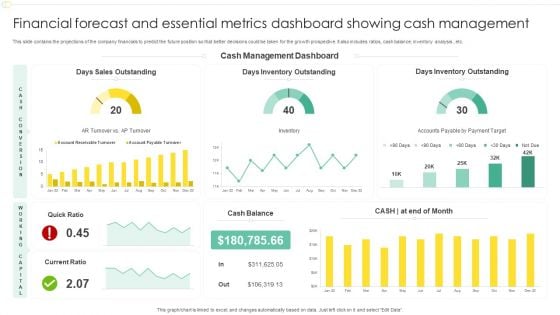
Financial Forecast And Essential Metrics Dashboard Showing Cash Management Designs PDF
This slide contains the projections of the company financials to predict the future position so that better decisions could be taken for the growth prospective. It also includes ratios, cash balance, inventory analysis , etc. Showcasing this set of slides titled Financial Forecast And Essential Metrics Dashboard Showing Cash Management Designs PDF. The topics addressed in these templates are Days Sales Outstanding, Cash Management Dashboard, Days Inventory Outstanding. All the content presented in this PPT design is completely editable. Download it and make adjustments in color, background, font etc. as per your unique business setting.
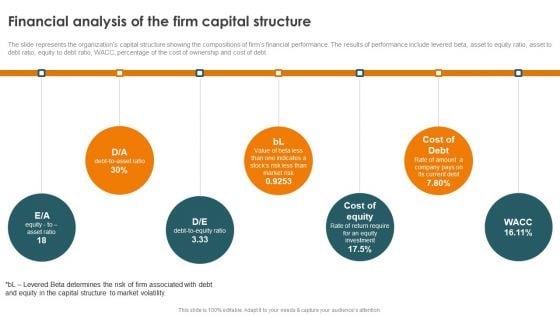
Profitability Modelling Framework Financial Analysis Of The Firm Capital Structure Ideas PDF
The slide represents the organizations capital structure showing the compositions of firms financial performance. The results of performance include levered beta, asset to equity ratio, asset to debt ratio, equity to debt ratio, WACC, percentage of the cost of ownership and cost of debt. This Profitability Modelling Framework Financial Analysis Of The Firm Capital Structure Ideas PDF is perfect for any presentation, be it in front of clients or colleagues. It is a versatile and stylish solution for organizing your meetings. The Profitability Modelling Framework Financial Analysis Of The Firm Capital Structure Ideas PDF features a modern design for your presentation meetings. The adjustable and customizable slides provide unlimited possibilities for acing up your presentation. Slidegeeks has done all the homework before launching the product for you. So, dont wait, grab the presentation templates today.
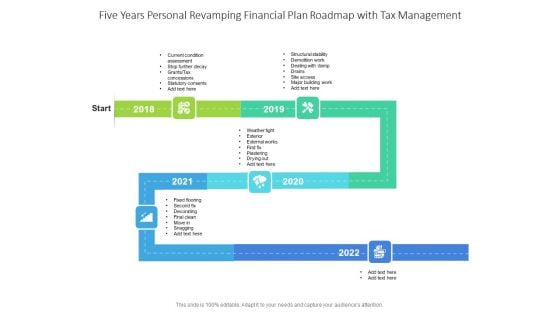
Five Years Personal Revamping Financial Plan Roadmap With Tax Management Topics
Presenting our jaw dropping five years personal revamping financial plan roadmap with tax management topics. You can alternate the color, font size, font type, and shapes of this PPT layout according to your strategic process. This PPT presentation is compatible with Google Slides and is available in both standard screen and widescreen aspect ratios. You can also download this well researched PowerPoint template design in different formats like PDF, JPG, and PNG. So utilize this visually appealing design by clicking the download button given below.
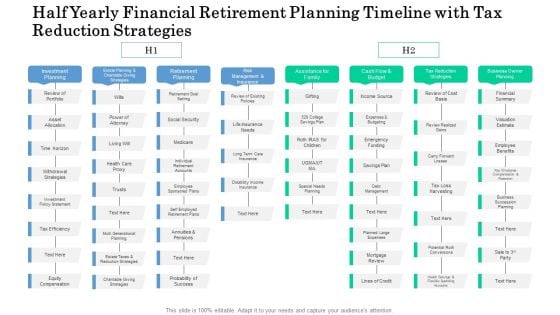
Half Yearly Financial Retirement Planning Timeline With Tax Reduction Strategies Brochure
Presenting the half yearly financial retirement planning timeline with tax reduction strategies brochure. The template includes a roadmap that can be used to initiate a strategic plan. Not only this, the PowerPoint slideshow is completely editable and you can effortlessly modify the font size, font type, and shapes according to your needs. This PPT slide can be easily reached in standard screen and widescreen aspect ratios. The set is also available in various formats like PDF, PNG, and JPG. So download and use it multiple times as per your knowledge.
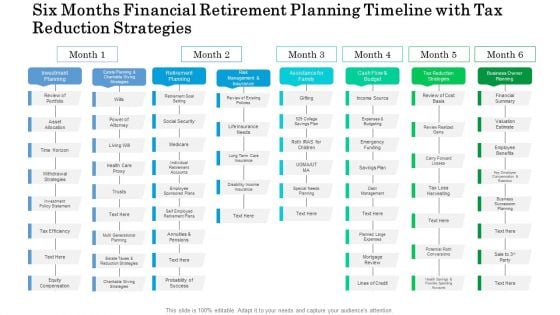
Six Months Financial Retirement Planning Timeline With Tax Reduction Strategies Rules
Presenting our jaw dropping six months financial retirement planning timeline with tax reduction strategies rules. You can alternate the color, font size, font type, and shapes of this PPT layout according to your strategic process. This PPT presentation is compatible with Google Slides and is available in both standard screen and widescreen aspect ratios. You can also download this well researched PowerPoint template design in different formats like PDF, JPG, and PNG. So utilize this visually appealing design by clicking the download button given below.
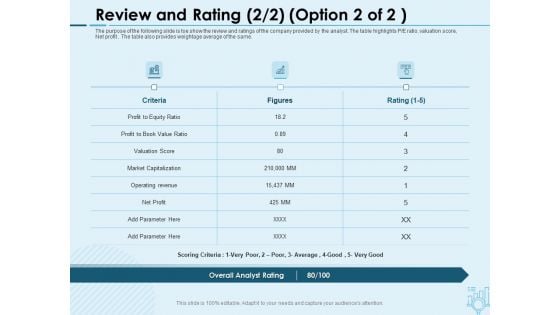
Assessing Stocks In Financial Market Review And Rating Revenue Ppt PowerPoint Presentation Styles Designs PDF
Presenting this set of slides with name assessing stocks in financial market review and rating revenue ppt powerpoint presentation styles designs pdf. The topics discussed in these slides are criteria, figures, rating, profit equity ratio, market capitalization, valuation score, operating revenue. This is a completely editable PowerPoint presentation and is available for immediate download. Download now and impress your audience.
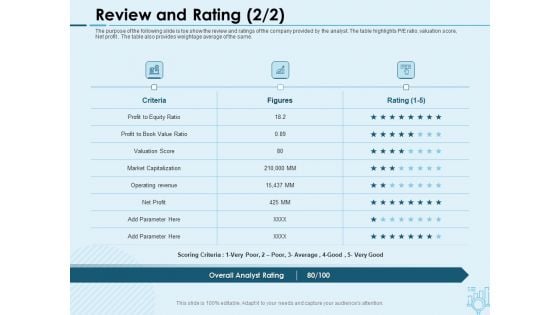
Assessing Stocks In Financial Market Review And Rating Value Ppt PowerPoint Presentation Inspiration Graphics Design PDF
Presenting this set of slides with name assessing stocks in financial market review and rating value ppt powerpoint presentation inspiration graphics design pdf. The topics discussed in these slides are criteria, figures, rating, profit equity ratio, market capitalization, valuation score, operating revenue. This is a completely editable PowerPoint presentation and is available for immediate download. Download now and impress your audience.
Business Monthly Financial Report Summary With Budget And Variance Icons PDF
The following slide highlights the monthly financial report with budget and variance illustrating profit and loss metrics, balance sheet metrics, revenue, expense, net income, return on assets, cash, current ratio, account payable and account receivable.Showcasing this set of slides titled Business Monthly Financial Report Summary With Budget And Variance Icons PDF The topics addressed in these templates are Return On Assets, Account Receivable, Loss Metrics All the content presented in this PPT design is completely editable. Download it and make adjustments in color, background, font etc. as per your unique business setting.
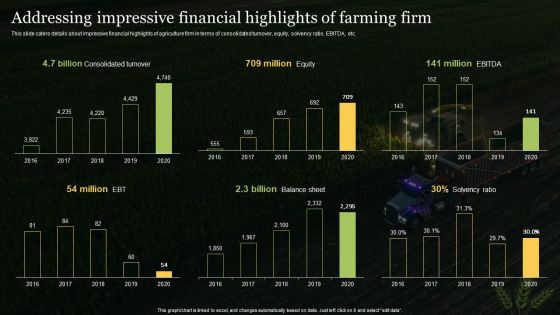
Agriculture Business Elevator Pitch Deck Addressing Impressive Financial Highlights Of Farming Firm Introduction PDF
This slide caters details about impressive financial highlights of agriculture firm in terms of consolidated turnover, equity, solvency ratio, EBITDA, etc. Make sure to capture your audiences attention in your business displays with our gratis customizable Agriculture Business Elevator Pitch Deck Addressing Impressive Financial Highlights Of Farming Firm Introduction PDF. These are great for business strategies, office conferences, capital raising or task suggestions. If you desire to acquire more customers for your tech business and ensure they stay satisfied, create your own sales presentation with these plain slides.
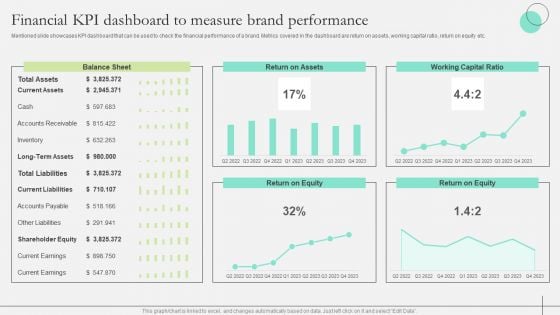
Comprehensive Guide To Strengthen Brand Equity Financial KPI Dashboard Measure Brand Structure PDF
Mentioned slide showcases KPI dashboard that can be used to check the financial performance of a brand. Metrics covered in the dashboard are return on assets, working capital ratio, return on equity etc. Take your projects to the next level with our ultimate collection of Comprehensive Guide To Strengthen Brand Equity Financial KPI Dashboard Measure Brand Structure PDF. Slidegeeks has designed a range of layouts that are perfect for representing task or activity duration, keeping track of all your deadlines at a glance. Tailor these designs to your exact needs and give them a truly corporate look with your own brand colors they will make your projects stand out from the rest
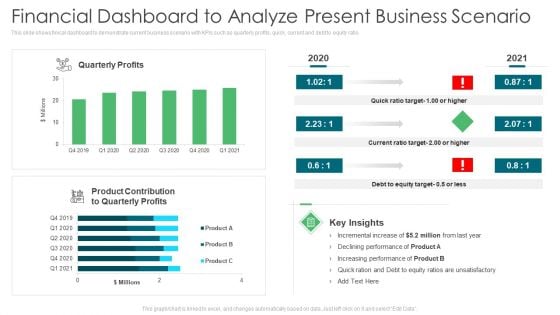
Environmental Assessment Financial Dashboard To Analyze Present Business Scenario Ppt Infographics Ideas PDF
This slide shows finical dashboard to demonstrate current business scenario with KPIs such as quarterly profits, quick, current and debt to equity ratio. Deliver an awe inspiring pitch with this creative environmental assessment financial dashboard to analyze present business scenario ppt infographics ideas pdf bundle. Topics like product contribution, increasing performance, equity target can be discussed with this completely editable template. It is available for immediate download depending on the needs and requirements of the user.
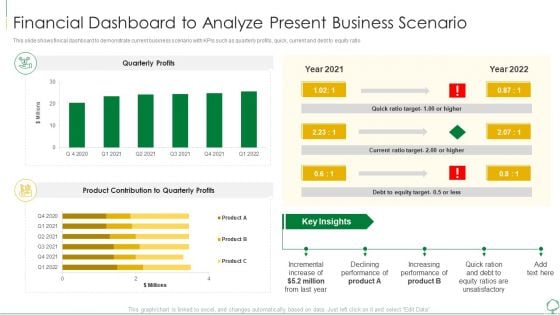
Environmental Examination Tools And Approaches Financial Dashboard To Analyze Sample PDF
This slide shows finical dashboard to demonstrate current business scenario with KPIs such as quarterly profits, quick, current and debt to equity ratio. Deliver and pitch your topic in the best possible manner with this environmental examination tools and approaches financial dashboard to analyze sample pdf. Use them to share invaluable insights on performance, product, equity and impress your audience. This template can be altered and modified as per your expectations. So, grab it now.
Tracking The Cashflow Improvements With Cash Guide To Corporate Financial Growth Plan Pictures Pdf
This slide showcases the KPIs that would help our business organization to track the improvements in the new cash management process. It includes quick ratio, cash balance, current ratio, days inventory outstanding, etc.Want to ace your presentation in front of a live audience Our Tracking The Cashflow Improvements With Cash Guide To Corporate Financial Growth Plan Pictures Pdf can help you do that by engaging all the users towards you.. Slidegeeks experts have put their efforts and expertise into creating these impeccable powerpoint presentations so that you can communicate your ideas clearly. Moreover, all the templates are customizable, and easy-to-edit and downloadable. Use these for both personal and commercial use. This slide showcases the KPIs that would help our business organization to track the improvements in the new cash management process. It includes quick ratio, cash balance, current ratio, days inventory outstanding, etc.
Tracking The Cashflow Improvements Cash Assessing Corporate Financial Techniques Clipart Pdf
This slide showcases the KPIs that would help our business organization to track the improvements in the new cash management process. It includes quick ratio, cash balance, current ratio, days inventory outstanding, etc. Slidegeeks is one of the best resources for PowerPoint templates. You can download easily and regulate Tracking The Cashflow Improvements Cash Assessing Corporate Financial Techniques Clipart Pdf for your personal presentations from our wonderful collection. A few clicks is all it takes to discover and get the most relevant and appropriate templates. Use our Templates to add a unique zing and appeal to your presentation and meetings. All the slides are easy to edit and you can use them even for advertisement purposes. This slide showcases the KPIs that would help our business organization to track the improvements in the new cash management process. It includes quick ratio, cash balance, current ratio, days inventory outstanding, etc.
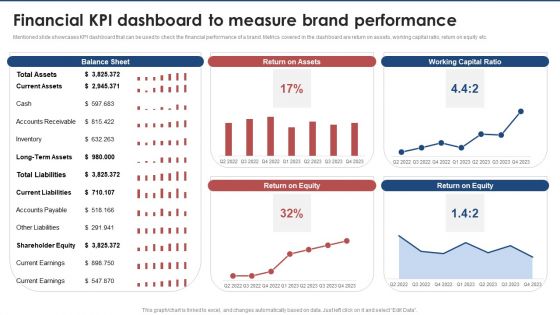
Financial Kpi Dashboard To Measure Brand Performance Brand Value Estimation Guide Inspiration PDF
Mentioned slide showcases KPI dashboard that can be used to check the financial performance of a brand. Metrics covered in the dashboard are return on assets, working capital ratio, return on equity etc.Are you in need of a template that can accommodate all of your creative concepts This one is crafted professionally and can be altered to fit any style. Use it with Google Slides or PowerPoint. Include striking photographs, symbols, depictions, and other visuals. Fill, move around, or remove text boxes as desired. Test out color palettes and font mixtures. Edit and save your work, or work with colleagues. Download Financial Kpi Dashboard To Measure Brand Performance Brand Value Estimation Guide Inspiration PDF and observe how to make your presentation outstanding. Give an impeccable presentation to your group and make your presentation unforgettable.
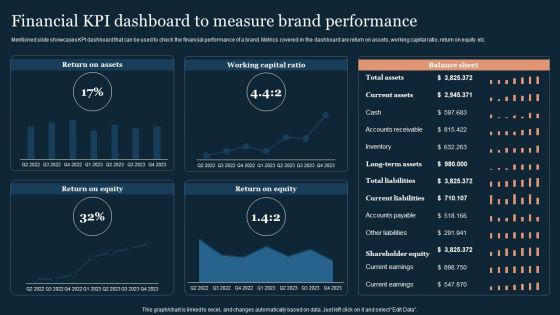
Guide To Develop And Estimate Brand Value Financial KPI Dashboard To Measure Brand Performance Formats PDF
Mentioned slide showcases KPI dashboard that can be used to check the financial performance of a brand. Metrics covered in the dashboard are return on assets, working capital ratio, return on equity etc.Coming up with a presentation necessitates that the majority of the effort goes into the content and the message you intend to convey. The visuals of a PowerPoint presentation can only be effective if it supplements and supports the story that is being told. Keeping this in mind our experts created Guide To Develop And Estimate Brand Value Financial KPI Dashboard To Measure Brand Performance Formats PDF to reduce the time that goes into designing the presentation. This way, you can concentrate on the message while our designers take care of providing you with the right template for the situation.
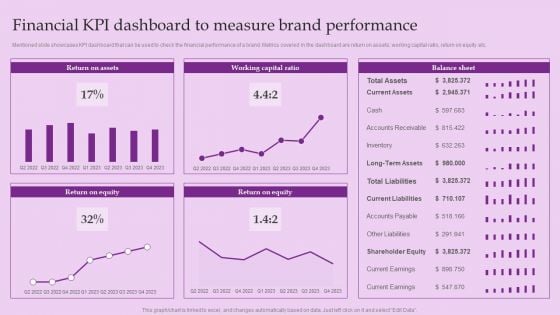
Financial KPI Dashboard To Measure Brand Performance Brand And Equity Evaluation Techniques Elements PDF
Mentioned slide showcases KPI dashboard that can be used to check the financial performance of a brand. Metrics covered in the dashboard are return on assets, working capital ratio, return on equity etc.Coming up with a presentation necessitates that the majority of the effort goes into the content and the message you intend to convey. The visuals of a PowerPoint presentation can only be effective if it supplements and supports the story that is being told. Keeping this in mind our experts created Financial KPI Dashboard To Measure Brand Performance Brand And Equity Evaluation Techniques Elements PDF to reduce the time that goes into designing the presentation. This way, you can concentrate on the message while our designers take care of providing you with the right template for the situation.
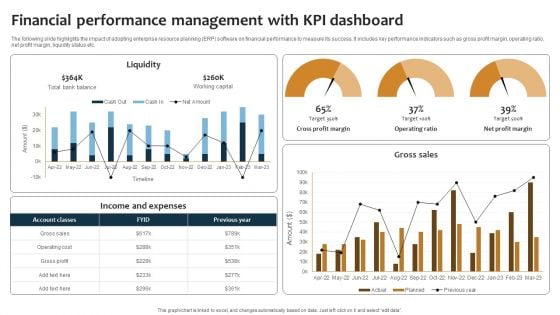
Improving Business Procedures Enterprise Resource Planning System Financial Performance Management Summary PDF
The following slide highlights the impact of adopting enterprise resource planning ERP software on financial performance to measure its success. It includes key performance indicators such as gross profit margin, operating ratio, net profit margin, liquidity status etc. Welcome to our selection of the Improving Business Procedures Enterprise Resource Planning System Financial Performance Management Summary PDF. These are designed to help you showcase your creativity and bring your sphere to life. Planning and Innovation are essential for any business that is just starting out. This collection contains the designs that you need for your everyday presentations. All of our PowerPoints are 100 percent editable, so you can customize them to suit your needs. This multi purpose template can be used in various situations. Grab these presentation templates today.
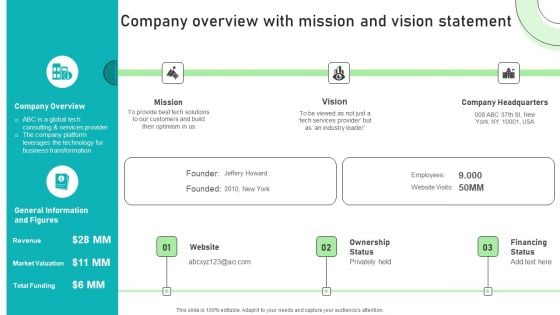
Adjusting Financial Strategies And Planning Company Overview With Mission And Vision Statement Background PDF
This slide provides glimpse about summary of shareholders dividend policy of the company. It includes payout ratio, ways of dividend payment, cash dividend, bonus share at no additional cost, etc. Make sure to capture your audiences attention in your business displays with our gratis customizable Adjusting Financial Strategies And Planning Company Overview With Mission And Vision Statement Background PDF. These are great for business strategies, office conferences, capital raising or task suggestions. If you desire to acquire more customers for your tech business and ensure they stay satisfied, create your own sales presentation with these plain slides.
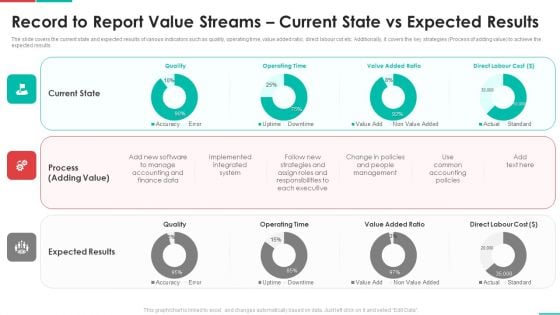
Roadmap For Financial Accounting Transformation Record To Report Value Streams Current State Professional PDF
The slide covers the current state and expected results of various indicators such as quality, operating time, value added ratio, direct labour cot etc. Additionally, it covers the key strategies Process of adding value to achieve the expected results. Deliver and pitch your topic in the best possible manner with this roadmap for financial accounting transformation record to report value streams current state professional pdf. Use them to share invaluable insights on current state, process, expected results and impress your audience. This template can be altered and modified as per your expectations. So, grab it now.
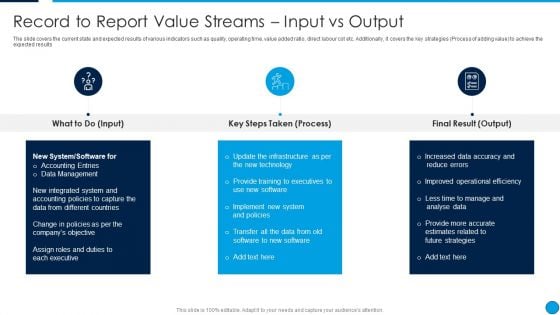
Summary Financial Record To Report Value Streams Input Vs Output Guidelines PDF
The slide covers the current state and expected results of various indicators such as quality, operating time, value added ratio, direct labour cot etc. Additionally, it covers the key strategies Process of adding value to achieve the expected results. This is a Summary Financial Record To Report Value Streams Input Vs Output Guidelines PDF template with various stages. Focus and dispense information on three stages using this creative set, that comes with editable features. It contains large content boxes to add your information on topics like New System, Accounting Entries, Data Management, Assign Roles And Duties. You can also showcase facts, figures, and other relevant content using this PPT layout. Grab it now.

Company Profit And Loss Dashboard With Income Statement Strategic Approaches To Corporate Financial
This slide provides a KPI dashboard that enables an organization to track revenue, expenses, and profit incurred in a specific period. It includes gross profit margin, OPEX ratio, operating profit margin, and net profit margin. Want to ace your presentation in front of a live audience Our Company Profit And Loss Dashboard With Income Statement Strategic Approaches To Corporate Financial can help you do that by engaging all the users towards you. Slidegeeks experts have put their efforts and expertise into creating these impeccable powerpoint presentations so that you can communicate your ideas clearly. Moreover, all the templates are customizable, and easy-to-edit and downloadable. Use these for both personal and commercial use. This slide provides a KPI dashboard that enables an organization to track revenue, expenses, and profit incurred in a specific period. It includes gross profit margin, OPEX ratio, operating profit margin, and net profit margin.
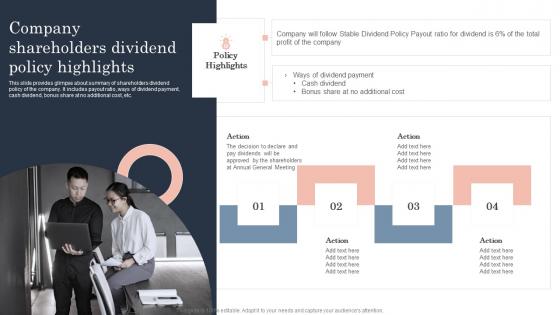
Company Shareholders Dividend Policy Guide To Corporate Financial Growth Plan Slides Pdf
This slide provides glimpse about summary of shareholders dividend policy of the company. It includes payout ratio, ways of dividend payment, cash dividend, bonus share at no additional cost, etc.If you are looking for a format to display your unique thoughts, then the professionally designed Company Shareholders Dividend Policy Guide To Corporate Financial Growth Plan Slides Pdf is the one for you. You can use it as a Google Slides template or a PowerPoint template. Incorporate impressive visuals, symbols, images, and other charts. Modify or reorganize the text boxes as you desire. Experiment with shade schemes and font pairings. Alter, share or cooperate with other people on your work. Download Company Shareholders Dividend Policy Guide To Corporate Financial Growth Plan Slides Pdf and find out how to give a successful presentation. Present a perfect display to your team and make your presentation unforgettable. This slide provides glimpse about summary of shareholders dividend policy of the company. It includes payout ratio, ways of dividend payment, cash dividend, bonus share at no additional cost, etc.

Conducting Monetary Inclusion With Mobile Financial Services Ppt PowerPoint Presentation Complete Deck With Slides
Induce strategic thinking by presenting this complete deck. Enthrall your audience by deploying this thought provoking PPT deck. It can be downloaded in both standard and widescreen aspect ratios, thus making it a complete package to use and deploy. Convey your thoughts and actions using the fourty six slides presented in this complete deck. Additionally, feel free to alter its components like color, graphics, design, etc, to create a great first impression. Grab it now by clicking on the download button below.


 Continue with Email

 Home
Home


