Financial Snapshot
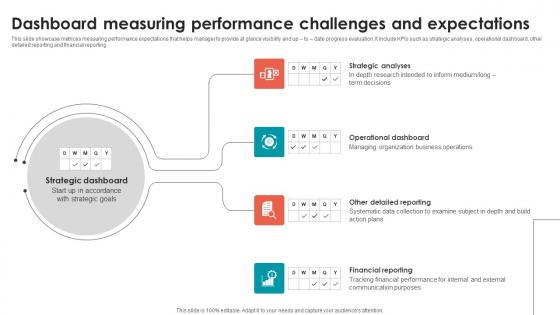
Dashboard Measuring Performance Challenges And Expectations Portrait Pdf
This slide showcase metrices measuring performance expectations that helps manager to provide at glance visibility and up to date progress evaluation. It include KPIs such as strategic analyses, operational dashboard, other detailed reporting and financial reporting. Showcasing this set of slides titled Dashboard Measuring Performance Challenges And Expectations Portrait Pdf. The topics addressed in these templates are Operational Dashboard, Strategic Analyses, Financial Reporting. All the content presented in this PPT design is completely editable. Download it and make adjustments in color, background, font etc. as per your unique business setting. This slide showcase metrices measuring performance expectations that helps manager to provide at glance visibility and up to date progress evaluation. It include KPIs such as strategic analyses, operational dashboard, other detailed reporting and financial reporting.
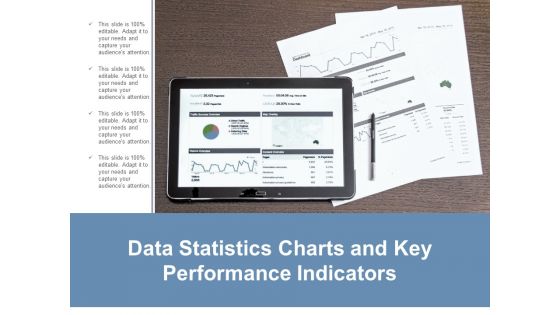
Data Statistics Charts And Key Performance Indicators Ppt Powerpoint Presentation Layouts Guide
This is a data statistics charts and key performance indicators ppt powerpoint presentation layouts guide. This is a four stage process. The stages in this process are business metrics, business kpi, business dashboard.

KPI Dashboard For Estimating Monthly Cash Flow Infographics Pdf
Following slide demonstrates KPI dashboard to forecast monthly business money flow for cash flow management planning. It includes components such as projected profit before tax, net operating cash flow, net financial cash flow, net investing cash flow, etc. Showcasing this set of slides titled KPI Dashboard For Estimating Monthly Cash Flow Infographics Pdf. The topics addressed in these templates are KPI Dashboard, Estimating Monthly Cash Flow, Net Financial Cash Flow. All the content presented in this PPT design is completely editable. Download it and make adjustments in color, background, font etc. as per your unique business setting. Following slide demonstrates KPI dashboard to forecast monthly business money flow for cash flow management planning. It includes components such as projected profit before tax, net operating cash flow, net financial cash flow, net investing cash flow, etc.
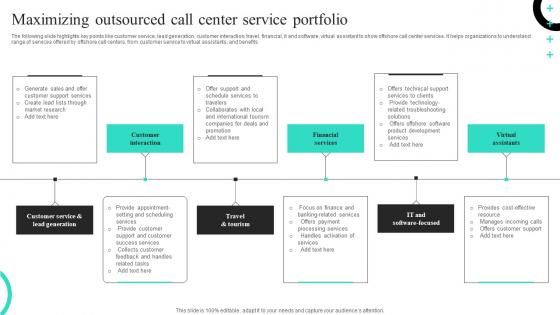
Maximizing Outsourced Call Center Service Portfolio Themes Pdf
The following slide highlights key points like customer service, lead generation, customer interaction, travel, financial, it and software, virtual assistant to show offshore call center services. It helps organizations to understand range of services offered by offshore call centers, from customer service to virtual assistants, and benefits. Pitch your topic with ease and precision using this Maximizing Outsourced Call Center Service Portfolio Themes Pdf. This layout presents information on Customer Interaction, Financial Services, Virtual Assistants, Call Center Service Portfolio. It is also available for immediate download and adjustment. So, changes can be made in the color, design, graphics or any other component to create a unique layout. The following slide highlights key points like customer service, lead generation, customer interaction, travel, financial, it and software, virtual assistant to show offshore call center services. It helps organizations to understand range of services offered by offshore call centers, from customer service to virtual assistants, and benefits.
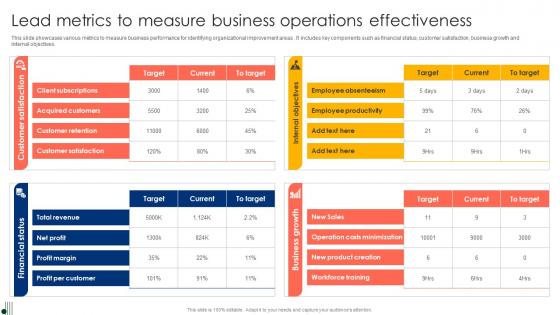
Lead Metrics To Measure Business Operations Effectiveness Ppt Styles Graphics Pdf
This slide showcases various metrics to measure business performance for identifying organizational improvement areas. It includes key components such as financial status, customer satisfaction, business growth and internal objectives. Pitch your topic with ease and precision using this Lead Metrics To Measure Business Operations Effectiveness Ppt Styles Graphics Pdf. This layout presents information on Financial Status, Customer Satisfaction, Business Growth. It is also available for immediate download and adjustment. So, changes can be made in the color, design, graphics or any other component to create a unique layout. This slide showcases various metrics to measure business performance for identifying organizational improvement areas. It includes key components such as financial status, customer satisfaction, business growth and internal objectives.

Key Performance Indicator Analytics Dashboard Ppt PowerPoint Presentation Model Example Topics
This is a key performance indicator analytics dashboard ppt powerpoint presentation model example topics. This is a five stage process. The stages in this process are kpi proposal, kpi plan, kpi scheme.
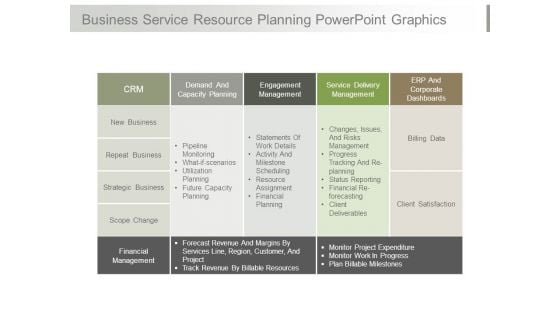
Business Service Resource Planning Powerpoint Graphics
This is a business service resource planning powerpoint graphics. This is a four stage process. The stages in this process are crm, demand and capacity planning, engagement management, service delivery management, erp and corporate dashboards, new business, repeat business, strategic business, scope change, pipeline monitoring, what if scenarios, utilization planning, future capacity planning, statements of work details, activity and milestone scheduling, resource assignment, financial planning, changes, issues, and risks management, progress tracking and re planning, status reporting, financial re forecasting, client deliverables, billing data, client satisfaction, financial management, forecast revenue and margins by services line region customer and project, track revenue by billable resources, monitor project expenditure, monitor work in progress, plan billable milestones.
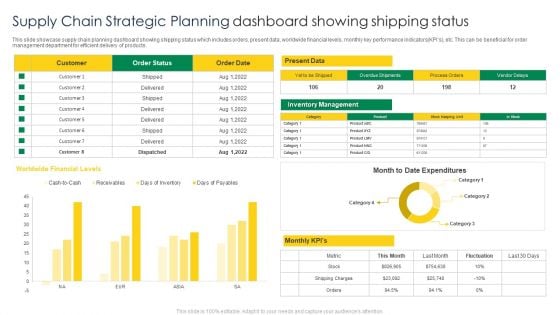
Supply Chain Strategic Planning Dashboard Showing Shipping Status Structure PDF
This slide showcase supply chain planning dashboard showing shipping status which includes orders, present data, worldwide financial levels, monthly key performance indicators KPIs, etc. This can be beneficial for order management department for efficient delivery of products. Showcasing this set of slides titled Supply Chain Strategic Planning Dashboard Showing Shipping Status Structure PDF. The topics addressed in these templates are Worldwide Financial Levels, Present Data, Customer. All the content presented in this PPT design is completely editable. Download it and make adjustments in color, background, font etc. as per your unique business setting.
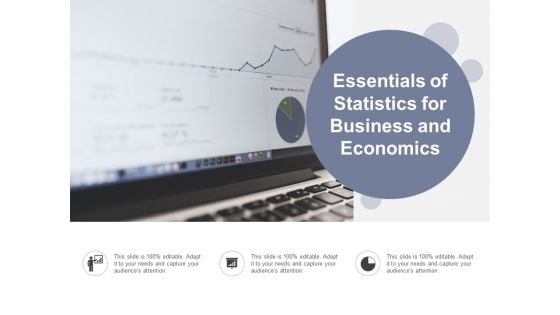
Essentials Of Statistics For Business And Economics Ppt Powerpoint Presentation Pictures Styles
This is a essentials of statistics for business and economics ppt powerpoint presentation pictures styles. This is a three stage process. The stages in this process are business metrics, business kpi, business dashboard.

Market Entry Strategy Clubs Industry Analytics Dashboard For Gym Health And Fitness Clubs Summary PDF
This slide covers the Key performance indicators for analysing social media platforms, email campaigns and website performance. Presenting market entry strategy clubs industry analytics dashboard for gym health and fitness clubs summary pdf to provide visual cues and insights. Share and navigate important information on seven stages that need your due attention. This template can be used to pitch topics like Analytics Dashboard for Gym Health and Fitness Clubs. In addtion, this PPT design contains high-resolution images, graphics, etc, that are easily editable and available for immediate download.
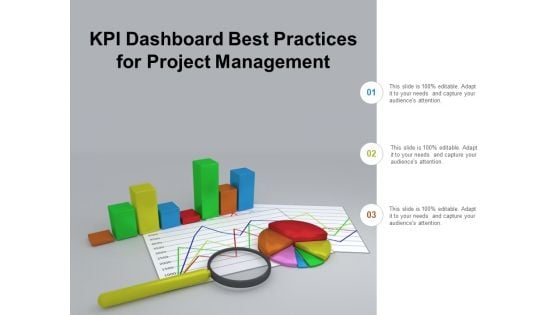
Kpi Dashboard Best Practices For Project Management Ppt Powerpoint Presentation Outline Samples
This is a kpi dashboard best practices for project management ppt powerpoint presentation outline samples. This is a three stage process. The stages in this process are business metrics, business kpi, business dashboard.
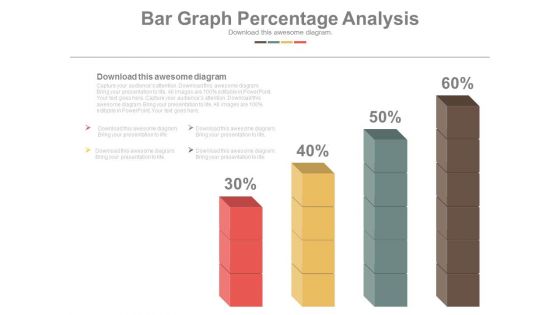
Bar Graph Displaying Profit Growth Powerpoint Slides
This PowerPoint template has been designed with six point?s bar graph with icons. This PPT slide can be used to prepare presentations for marketing reports and also for financial data analysis. You can download finance PowerPoint template to prepare awesome presentations.
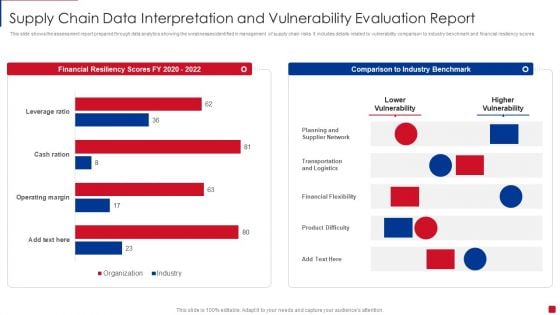
Supply Chain Data Interpretation And Vulnerability Evaluation Report Pictures PDF
This slide shows the assessment report prepared through data analytics showing the weaknesses identified in management of supply chain risks. It includes details related to vulnerability comparison to industry benchmark and financial resiliency scores Showcasing this set of slides titled Supply Chain Data Interpretation And Vulnerability Evaluation Report Pictures PDF. The topics addressed in these templates are Planning And Supplier Network, Transportation And Logistics, Financial Flexibility. All the content presented in this PPT design is completely editable. Download it and make adjustments in color, background, font etc. as per your unique business setting.
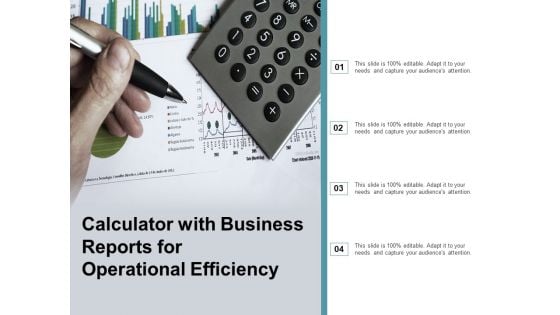
Calculator With Business Reports For Operational Efficiency Ppt Powerpoint Presentation Ideas Infographic Template
This is a calculator with business reports for operational efficiency ppt powerpoint presentation ideas infographic template. This is a four stage process. The stages in this process are business metrics, business kpi, business dashboard.
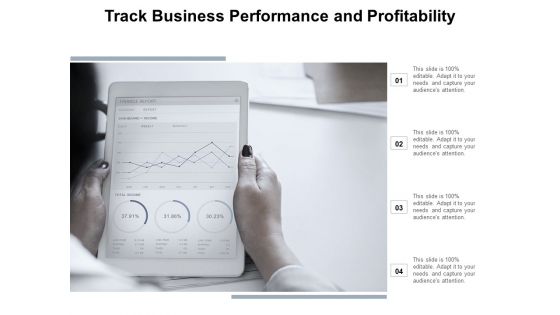
Track Business Performance And Profitability Ppt Powerpoint Presentation File Master Slide
This is a track business performance and profitability ppt powerpoint presentation file master slide. This is a four stage process. The stages in this process are business metrics, business kpi, business dashboard.
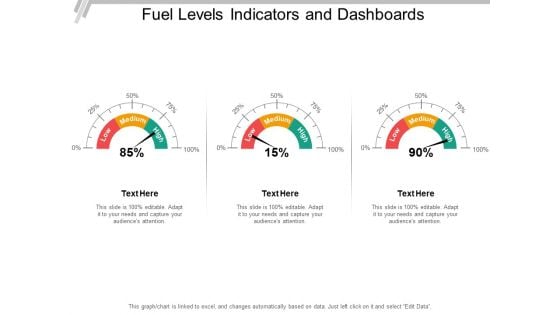
Fuel Levels Indicators And Dashboards Ppt PowerPoint Presentation Outline Skills
This is a fuel levels indicators and dashboards ppt powerpoint presentation outline skills. This is a three stage process. The stages in this process are fuel gauge, gas gauge, fuel containers.

HR Scoreboard Call Center Template PDF
The purpose of this slide is to outline the balanced HR scorecard in order to monitor day-to-day key operations. It includes several key performance indicators such as financial, customer, organizational structure, and capacity. Showcasing this set of slides titled HR Scoreboard Call Center Template PDF. The topics addressed in these templates are Financial Sustainability, Customer Experience, Internal Structures. All the content presented in this PPT design is completely editable. Download it and make adjustments in color, background, font etc. as per your unique business setting.
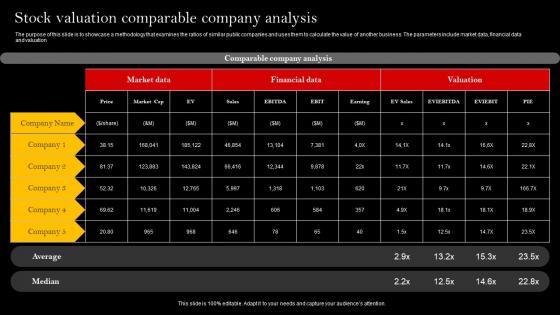
Stock Valuation Comparable Company Analysis Microsoft Pdf
The purpose of this slide is to showcase a methodology that examines the ratios of similar public companies and uses them to calculate the value of another business. The parameters include market data, financial data and valuation Pitch your topic with ease and precision using this Stock Valuation Comparable Company Analysis Microsoft Pdf This layout presents information on Market Data, Financial Data, Company Analysis It is also available for immediate download and adjustment. So, changes can be made in the color, design, graphics or any other component to create a unique layout. The purpose of this slide is to showcase a methodology that examines the ratios of similar public companies and uses them to calculate the value of another business. The parameters include market data, financial data and valuation
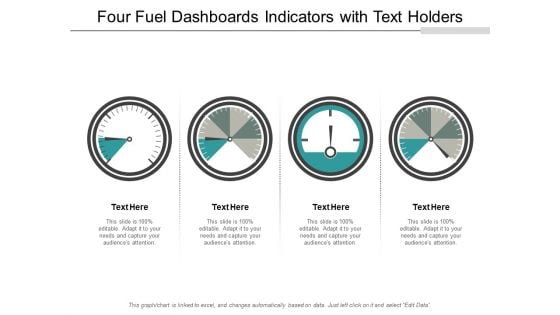
Four Fuel Dashboards Indicators With Text Holders Ppt PowerPoint Presentation File Graphics Design
This is a four fuel dashboards indicators with text holders ppt powerpoint presentation file graphics design. This is a four stage process. The stages in this process are fuel gauge, gas gauge, fuel containers.

Three Dashboard Speed Indicators With Text Holders Ppt PowerPoint Presentation Summary Layout
This is a three dashboard speed indicators with text holders ppt powerpoint presentation summary layout. This is a three stage process. The stages in this process are fuel gauge, gas gauge, fuel containers.
Costing Framework Six Steps With Icons Ppt PowerPoint Presentation Pictures Designs PDF
Presenting this set of slides with name costing framework six steps with icons ppt powerpoint presentation pictures designs pdf. This is a six stage process. The stages in this process are financial cost, inventory cost, development cost, manufacturing cost, tooling cost, sales cost. This is a completely editable PowerPoint presentation and is available for immediate download. Download now and impress your audience.
KPI Metrics Vector Icon Ppt PowerPoint Presentation Layouts Slide
This is a kpi metrics vector icon ppt powerpoint presentation layouts slide. This is a three stage process. The stages in this process are kpi proposal, kpi plan, kpi scheme.
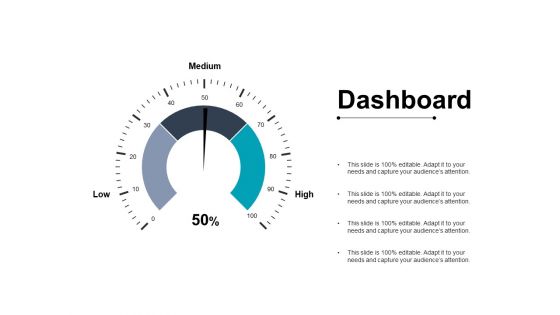
Dashboard Marketing Planning Ppt PowerPoint Presentation Slides Slideshow
This is a dashboard marketing planning ppt powerpoint presentation slides slideshow. This is a three stage process. The stages in this process are dashboard, finance, analysis, business, investment.
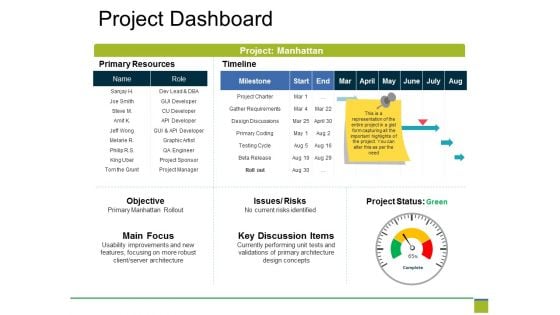
Project Dashboard Ppt PowerPoint Presentation Professional Show
This is a project dashboard ppt powerpoint presentation professional show. This is a six stage process. The stages in this process are primary resources, timeline, objective, main focus, key discussion items.
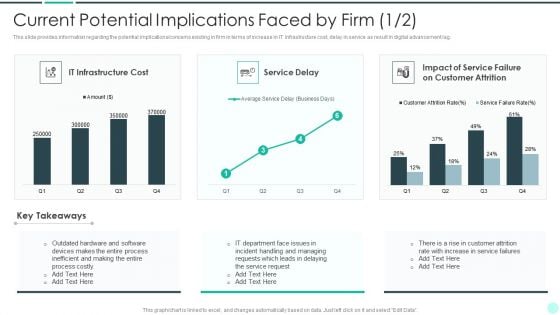
Executing Advance Data Analytics At Workspace Current Potential Implications Demonstration PDF
This slide provides information regarding the potential implications concerns existing in firm in terms of increase in issues related to employees such as lack of expertise, ineffectiveness in handling issues, reported financial losses due to financial threats and data breaches with records exposed. Deliver an awe inspiring pitch with this creative executing advance data analytics at workspace current potential implications demonstration pdf bundle. Topics like current potential implications faced by firm can be discussed with this completely editable template. It is available for immediate download depending on the needs and requirements of the user.
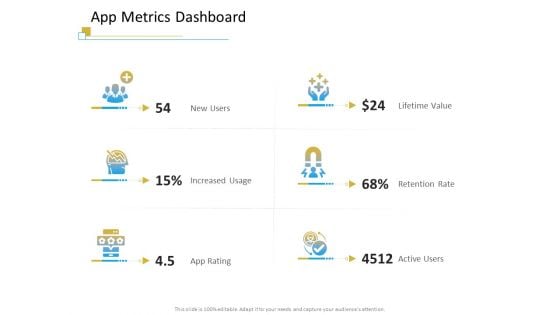
Successful Mobile Strategies For Business App Metrics Dashboard Microsoft PDF
Presenting successful mobile strategies for business app metrics dashboard microsoft pdf to provide visual cues and insights. Share and navigate important information on six stages that need your due attention. This template can be used to pitch topics like app metrics dashboard. In addtion, this PPT design contains high resolution images, graphics, etc, that are easily editable and available for immediate download.
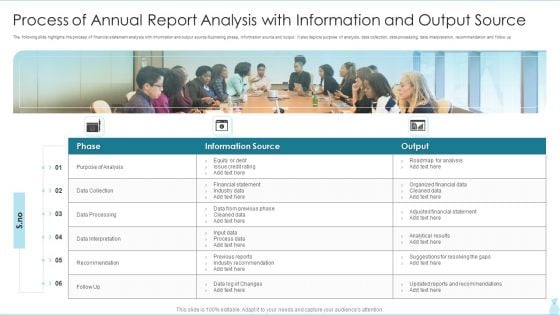
Process Of Annual Report Analysis With Information And Output Source Brochure PDF
The following slide highlights the process of financial statement analysis with information and output source illustrating phase, information source and output. It also depicts purpose of analysis, data collection, data processing, data interpretation, recommendation and follow up.Presenting Process Of Annual Report Analysis With Information And Output Source Brochure PDF to dispense important information. This template comprises six stages. It also presents valuable insights into the topics including Information Source, Financial Statement, Industry Data This is a completely customizable PowerPoint theme that can be put to use immediately. So, download it and address the topic impactfully.
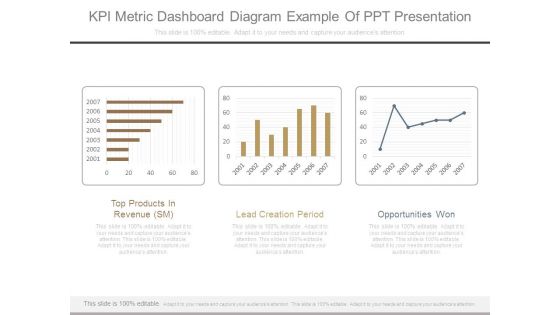
Kpi Metric Dashboard Diagram Example Of Ppt Presentation
This is a kpi metric dashboard diagram example of ppt presentation. This is a three stage process. The stages in this process are top products in revenue sm, lead creation period, opportunities won.
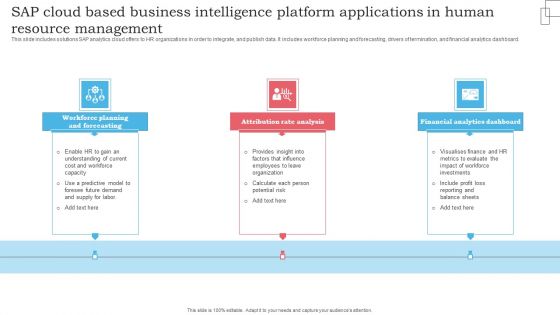
SAP Cloud Based Business Intelligence Platform Applications In Human Resource Management Microsoft PDF
This slide includes solutions SAP analytics cloud offers to HR organizations in order to integrate, and publish data. It includes workforce planning and forecasting, drivers of termination, and financial analytics dashboard. Presenting SAP Cloud Based Business Intelligence Platform Applications In Human Resource Management Microsoft PDF to dispense important information. This template comprises three stages. It also presents valuable insights into the topics including Workforce Planning Forecasting, Attribution Rate Analysis, Financial Analytics Dashboard. This is a completely customizable PowerPoint theme that can be put to use immediately. So, download it and address the topic impactfully.
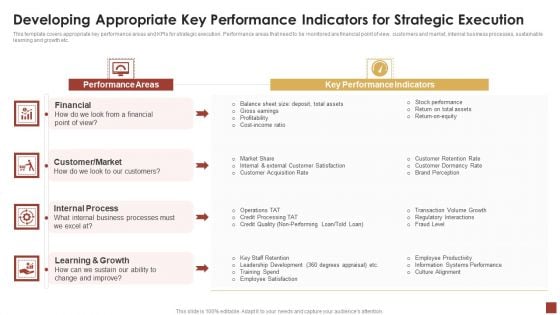
Strategical And Tactical Planning Developing Appropriate Key Performance Indicators Brochure PDF
This template covers appropriate key performance areas and KPIs for strategic execution. Performance areas that need to be monitored are financial point of view, customers and market, internal business processes, sustainable learning and growth etc. Deliver an awe inspiring pitch with this creative Strategical And Tactical Planning Developing Appropriate Key Performance Indicators Brochure PDF bundle. Topics like Performance Areas, Key Performance Indicators, Financial can be discussed with this completely editable template. It is available for immediate download depending on the needs and requirements of the user.
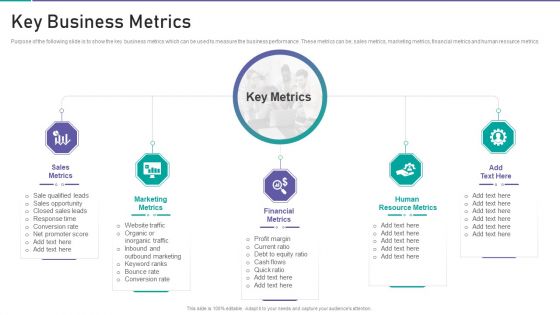
Corporate Organization Playbook Key Business Metrics Ppt Inspiration Elements PDF
Purpose of the following slide is to show the key business metrics which can be used to measure the business performance. These metrics can be sales metrics, marketing metrics, financial metrics and human resource metrics. Presenting corporate organization playbook key business metrics ppt inspiration elements pdf to provide visual cues and insights. Share and navigate important information on five stages that need your due attention. This template can be used to pitch topics like sales metrics, marketing metrics, financial metrics, human resource metrics. In addtion, this PPT design contains high resolution images, graphics, etc, that are easily editable and available for immediate download.
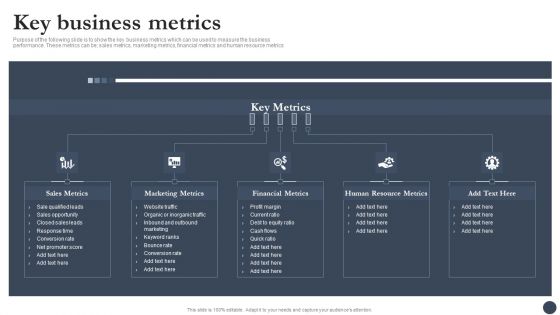
Strategic Playbook For Enterprise Administration Key Business Metrics Diagrams PDF
Purpose of the following slide is to show the key business metrics which can be used to measure the business performance. These metrics can be sales metrics, marketing metrics, financial metrics and human resource metrics. This is a Strategic Playbook For Enterprise Administration Key Business Metrics Diagrams PDF template with various stages. Focus and dispense information on five stages using this creative set, that comes with editable features. It contains large content boxes to add your information on topics like Marketing Metrics, Financial Metrics, Human Resource Metrics. You can also showcase facts, figures, and other relevant content using this PPT layout. Grab it now.
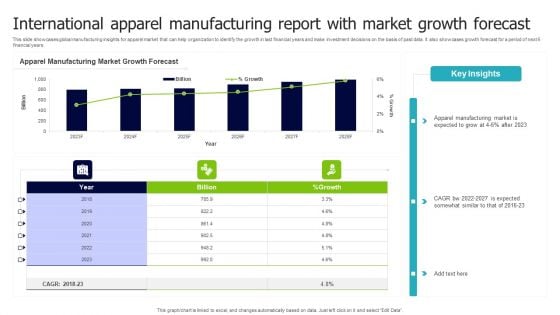
International Apparel Manufacturing Report With Market Growth Forecast Inspiration PDF
This slide showcases global manufacturing insights for apparel market that can help organization to identify the growth in last financial years and make investment decisions on the basis of past data. It also showcases growth forecast for a period of next 6 financial years. Pitch your topic with ease and precision using this International Apparel Manufacturing Report With Market Growth Forecast Inspiration PDF. This layout presents information on Apparel Manufacturing, Market Growth Forecast, Billion. It is also available for immediate download and adjustment. So, changes can be made in the color, design, graphics or any other component to create a unique layout.
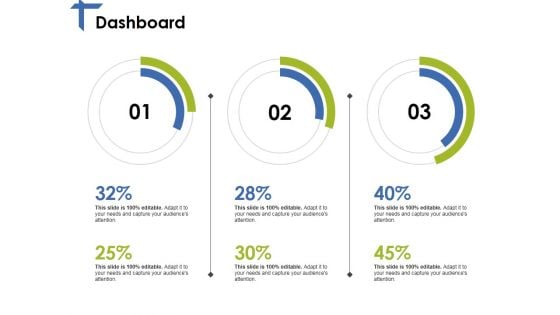
Dashboard Ppt PowerPoint Presentation Ideas Pictures
This is a dashboard ppt powerpoint presentation ideas pictures. This is a three stage process. The stages in this process are dashboard, finance, percentage, business, management.
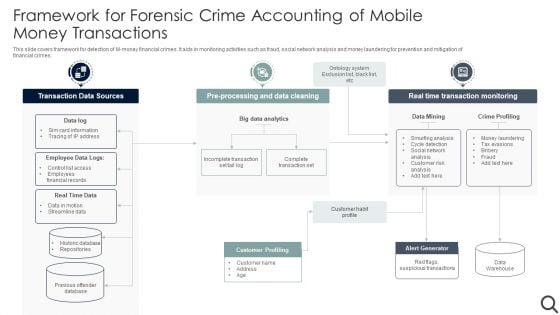
Framework For Forensic Crime Accounting Of Mobile Money Transactions Template PDF
This slide covers framework for detection of M money financial crimes. It aids in monitoring activities such as fraud, social network analysis and money laundering for prevention and mitigation of financial crimes. Showcasing this set of slides titled Framework For Forensic Crime Accounting Of Mobile Money Transactions Template PDF. The topics addressed in these templates are Big Data Analytics, Transaction Data Sources, Customer Profiling. All the content presented in this PPT design is completely editable. Download it and make adjustments in color, background, font etc. as per your unique business setting.
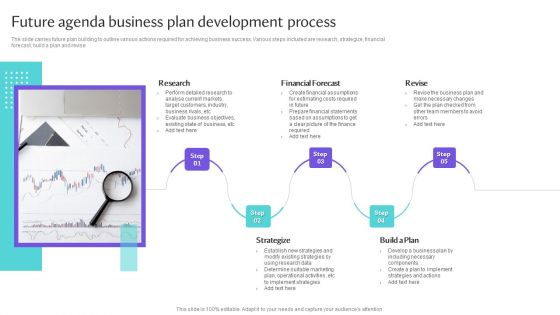
Future Agenda Business Plan Development Process Topics PDF
The slide carries future plan building to outline various actions required for achieving business success. Various steps included are research, strategize, financial forecast, build a plan and revise.Persuade your audience using this Future Agenda Business Plan Development Process Topics PDF. This PPT design covers five stages, thus making it a great tool to use. It also caters to a variety of topics including Financial Forecast, Establish Strategies, Determine Suitable Download this PPT design now to present a convincing pitch that not only emphasizes the topic but also showcases your presentation skills.
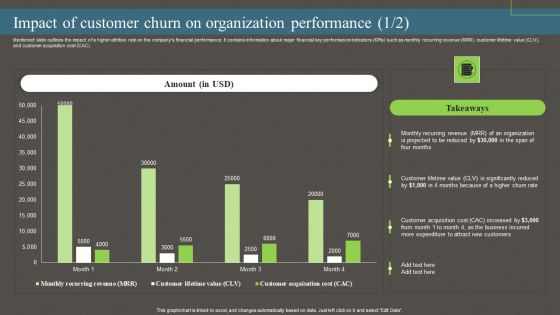
Impact Of Customer Churn On Organization Performance Ppt PowerPoint Presentation File Pictures PDF
Mentioned slide outlines the impact of a higher attrition rate on the companys financial performance. It contains information about major financial key performance indicators KPIs such as monthly recurring revenue MRR, customer lifetime value CLV, and customer acquisition cost CAC. The best PPT templates are a great way to save time, energy, and resources. Slidegeeks have 100 percent editable powerpoint slides making them incredibly versatile. With these quality presentation templates, you can create a captivating and memorable presentation by combining visually appealing slides and effectively communicating your message. Download Impact Of Customer Churn On Organization Performance Ppt PowerPoint Presentation File Pictures PDF from Slidegeeks and deliver a wonderful presentation.
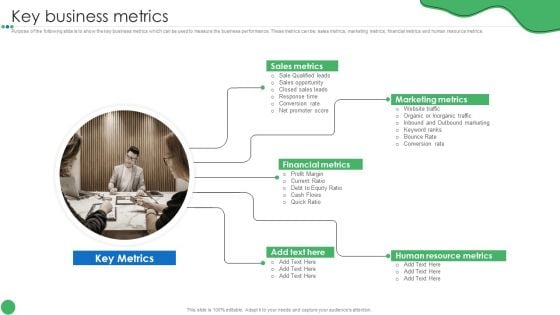
Key Business Metrics Guide To Enhance Organic Growth By Advancing Business Procedures Professional PDF
Purpose of the following slide is to show the key business metrics which can be used to measure the business performance. These metrics can be sales metrics, marketing metrics, financial metrics and human resource metrics.This is a Key Business Metrics Guide To Enhance Organic Growth By Advancing Business Procedures Professional PDF template with various stages. Focus and dispense information on five stages using this creative set, that comes with editable features. It contains large content boxes to add your information on topics like Marketing Metrics, Financial Metrics, Human Resource. You can also showcase facts, figures, and other relevant content using this PPT layout. Grab it now.
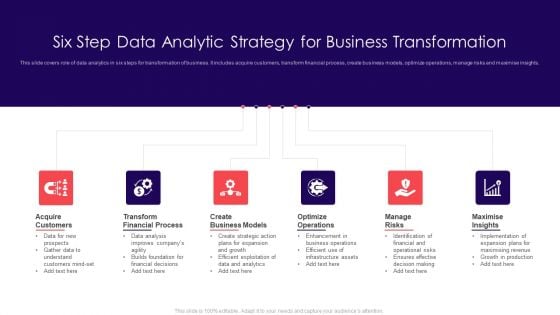
Six Step Data Analytic Strategy For Business Transformation Download PDF
This slide covers role of data analytics in six steps for transformation of business. It includes acquire customers, transform financial process, create business models, optimize operations, manage risks and maximise insights. Persuade your audience using this Six Step Data Analytic Strategy For Business Transformation Download PDF. This PPT design covers six stages, thus making it a great tool to use. It also caters to a variety of topics including Transform Financial Process, Acquire Customers, Create Business Models. Download this PPT design now to present a convincing pitch that not only emphasizes the topic but also showcases your presentation skills.
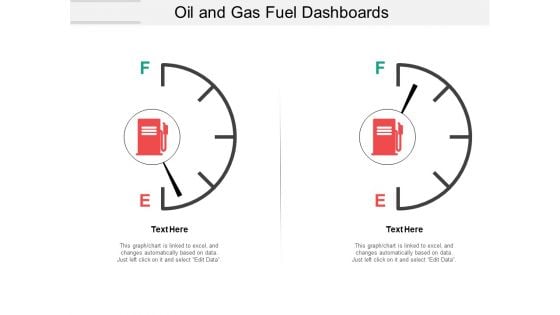
Oil And Gas Fuel Dashboards Ppt PowerPoint Presentation File Introduction
This is a oil and gas fuel dashboards ppt powerpoint presentation file introduction. This is a two stage process. The stages in this process are fuel gauge, gas gauge, fuel containers.

Car Dashboard And Speedometer Graphics Ppt PowerPoint Presentation File Graphics Template
This is a car dashboard and speedometer graphics ppt powerpoint presentation file graphics template. This is a four stage process. The stages in this process are fuel gauge, gas gauge, fuel containers.
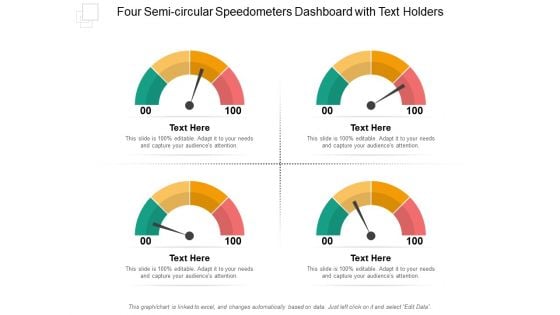
Four Semi Circular Speedometers Dashboard With Text Holders Ppt PowerPoint Presentation File Layouts
This is a four semi circular speedometers dashboard with text holders ppt powerpoint presentation file layouts. This is a four stage process. The stages in this process are fuel gauge, gas gauge, fuel containers.
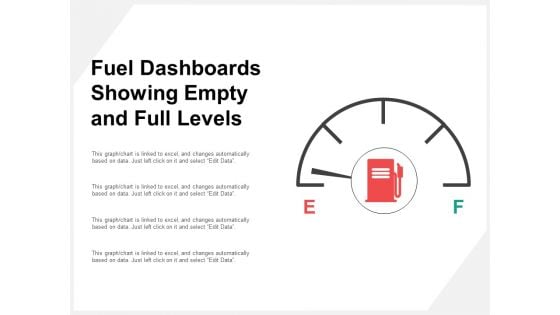
Fuel Dashboards Showing Empty And Full Levels Ppt PowerPoint Presentation Professional Slide Portrait
This is a fuel dashboards showing empty and full levels ppt powerpoint presentation professional slide portrait. This is a four stage process. The stages in this process are fuel gauge, gas gauge, fuel containers.
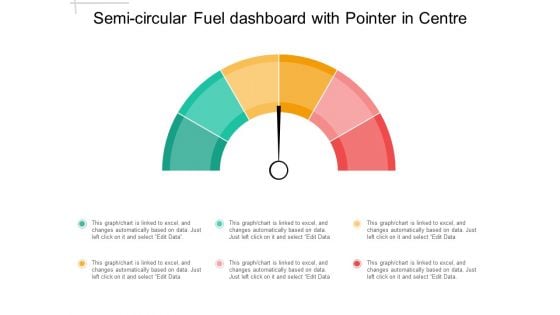
Semi Circular Fuel Dashboard With Pointer In Centre Ppt PowerPoint Presentation Outline Visuals
This is a semi circular fuel dashboard with pointer in centre ppt powerpoint presentation outline visuals. This is a three stage process. The stages in this process are fuel gauge, gas gauge, fuel containers.
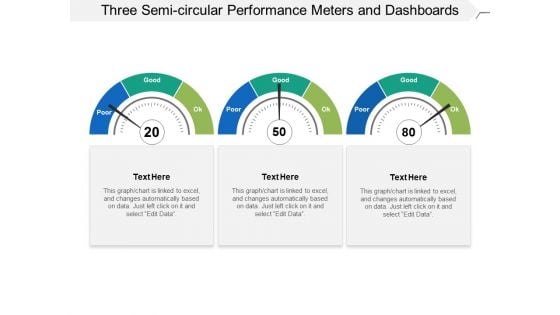
Three Semi Circular Performance Meters And Dashboards Ppt PowerPoint Presentation Slides Influencers
This is a three semi circular performance meters and dashboards ppt powerpoint presentation slides influencers. This is a three stage process. The stages in this process are fuel gauge, gas gauge, fuel containers.
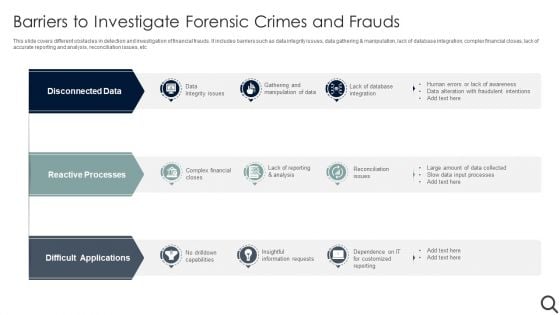
Barriers To Investigate Forensic Crimes And Frauds Graphics PDF
This slide covers different obstacles in detection and investigation of financial frauds. It includes barriers such as data integrity issues, data gathering and manipulation, lack of database integration, complex financial closes, lack of accurate reporting and analysis, reconciliation issues, etc. Presenting Barriers To Investigate Forensic Crimes And Frauds Graphics PDF to dispense important information. This template comprises three stages. It also presents valuable insights into the topics including Disconnected Data, Reactive Processes, Difficult Applications. This is a completely customizable PowerPoint theme that can be put to use immediately. So, download it and address the topic impactfully.
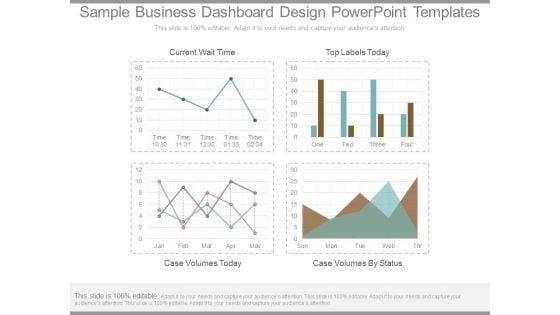
Sample Business Dashboard Design Powerpoint Templates
This is a sample business dashboard design powerpoint templates. This is a four stage process. The stages in this process are current wait time, top labels today, case volumes today, case volumes by status.
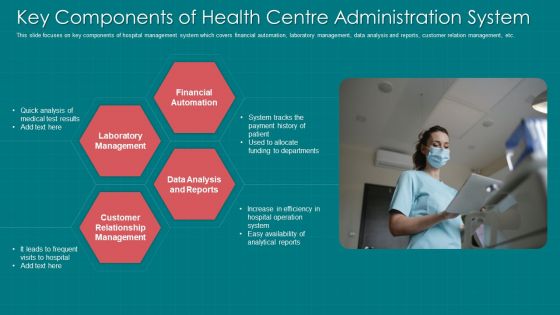
Key Components Of Health Centre Administration System Ideas PDF
This slide focuses on key components of hospital management system which covers financial automation, laboratory management, data analysis and reports, customer relation management, etc. Presenting key components of health centre administration system ideas pdf to dispense important information. This template comprises four stages. It also presents valuable insights into the topics including financial automation, laboratory management, customer relationship management, data analysis and reports. This is a completely customizable PowerPoint theme that can be put to use immediately. So, download it and address the topic impactfully.
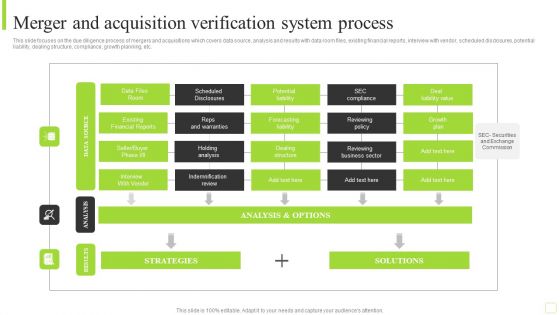
Merger And Acquisition Verification System Process Designs PDF
This slide focuses on the due diligence process of mergers and acquisitions which covers data source, analysis and results with data room files, existing financial reports, interview with vendor, scheduled disclosures, potential liability, dealing structure, compliance, growth planning, etc. Pitch your topic with ease and precision using this Merger And Acquisition Verification System Process Designs PDF. This layout presents information on Existing Financial Reports, Potential Liability, Reviewing Business Sector. It is also available for immediate download and adjustment. So, changes can be made in the color, design, graphics or any other component to create a unique layout.

How Security Concerns Affect Firm In Present Times Pictures PDF
This slide portrays information regarding the concerns that are currently existing in the organizations. It is essential for top level management to keep check on existing concerns as they have severe impact on firms growth in terms of huge financial losses and bad public image. Deliver an awe inspiring pitch with this creative how security concerns affect firm in present times pictures pdf bundle. Topics like reported financial losses due to increase security threats, data breaches and records exposed, security threat incidents can be discussed with this completely editable template. It is available for immediate download depending on the needs and requirements of the user.
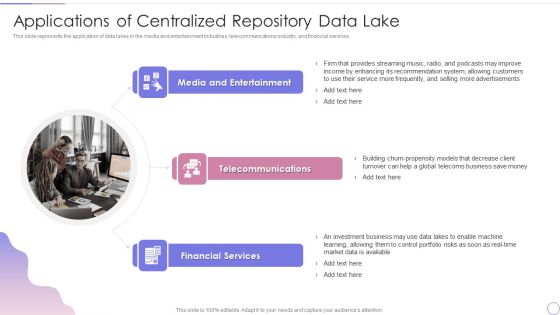
Data Lake Architecture Future Of Data Analysis Applications Of Centralized Structure PDF
This slide represents the application of data lakes in the media and entertainment industries, telecommunications industry, and financial services.This is a Data Lake Architecture Future Of Data Analysis Applications Of Centralized Structure PDF template with various stages. Focus and dispense information on three stages using this creative set, that comes with editable features. It contains large content boxes to add your information on topics like Telecommunications, Financial Services, Media And Entertainment. You can also showcase facts, figures, and other relevant content using this PPT layout. Grab it now.
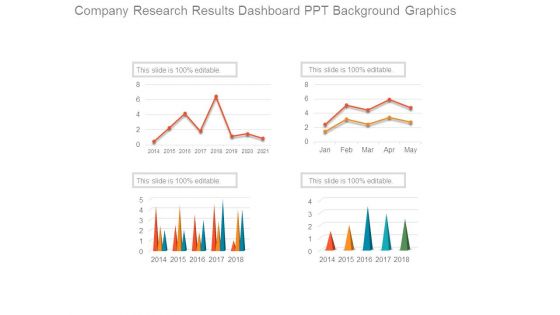
Company Research Results Dashboard Ppt Background Graphics
This is a company research results dashboard ppt background graphics. This is a four stage process. The stages in this process are growth, business, marketing, year.
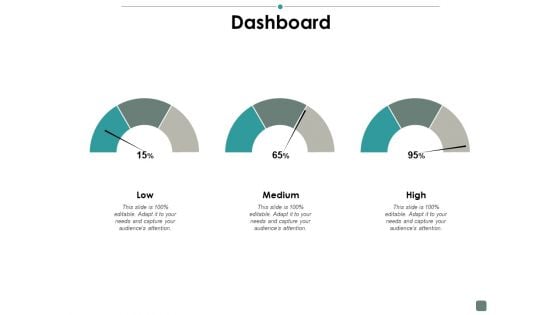
Dashboard Contribution Ppt PowerPoint Presentation Summary Ideas
This is a dashboard contribution ppt powerpoint presentation summary ideas. This is a three stage process. The stages in this process are finance, business, management, strategy, analysis.
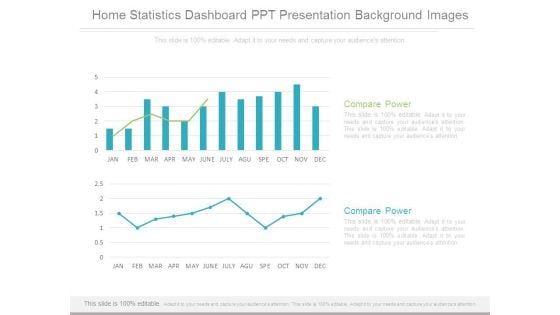
Home Statistics Dashboard Ppt Presentation Background Images
This is a home statistics dashboard ppt presentation background images. This is a two stage process. The stages in this process are compare power, finance, growth.

Interactive Dashboard Examples Ppt Samples Download
This is a interactive dashboard examples ppt samples download. This is a two stage process. The stages in this process are call quality, network utilization.
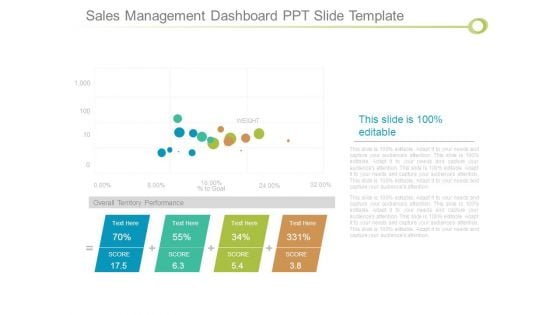
Sales Management Dashboard Ppt Slide Template
This is a sales management dashboard ppt slide template. This is a four stage process. The stages in this process are weight, goal, overall territory performance, score.
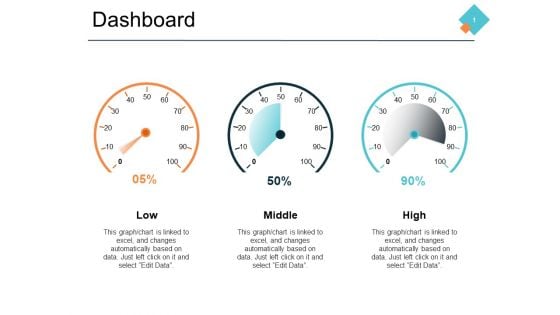
Dashboard Marketing Ppt PowerPoint Presentation Ideas Inspiration
This is a dashboard marketing ppt powerpoint presentation ideas inspiration. This is a three stage process. The stages in this process are finance, management, strategy, analysis, marketing.
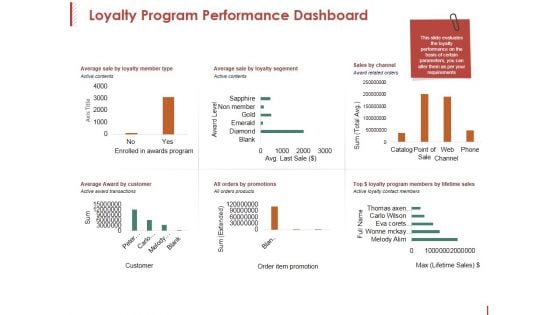
Loyalty Program Performance Dashboard Ppt PowerPoint Presentation Pictures Clipart
This is a loyalty program performance dashboard ppt powerpoint presentation pictures clipart. This is a six stage process. The stages in this process are axis title, award level, sum, active contents, channel.
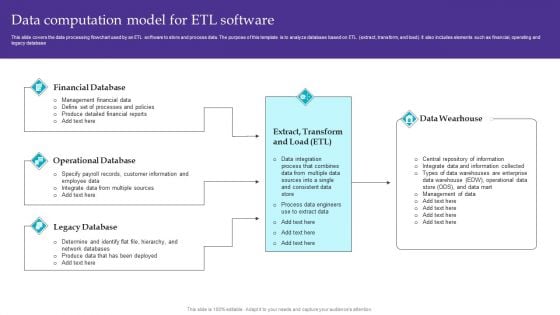
Data Computation Model For ETL Software Microsoft PDF
This slide covers the data processing flowchart used by an ETL software to store and process data. The purpose of this template is to analyze database based on ETL extract, transform, and load. It also includes elements such as financial, operating and legacy database Showcasing this set of slides titled Data Computation Model For ETL Software Microsoft PDF. The topics addressed in these templates are Operational Database, Financial Database, Legacy Database. All the content presented in this PPT design is completely editable. Download it and make adjustments in color, background, font etc. as per your unique business setting.
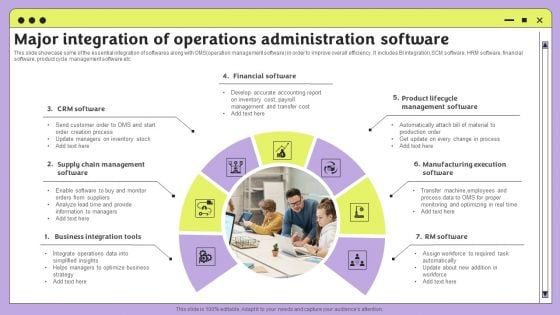
Major Integration Of Operations Administration Software Template PDF
This slide showcase some of the essential integration of softwares along with OMS operation management software in order to improve overall efficiency. It includes BI integration,SCM software, HRM software, financial software, product cycle management software etc. Persuade your audience using this Major Integration Of Operations Administration Software Template PDF. This PPT design covers seven stages, thus making it a great tool to use. It also caters to a variety of topics including Crm Software, Financial Software, Business Integration Tools. Download this PPT design now to present a convincing pitch that not only emphasizes the topic but also showcases your presentation skills.


 Continue with Email

 Home
Home


