Financial Snapshot
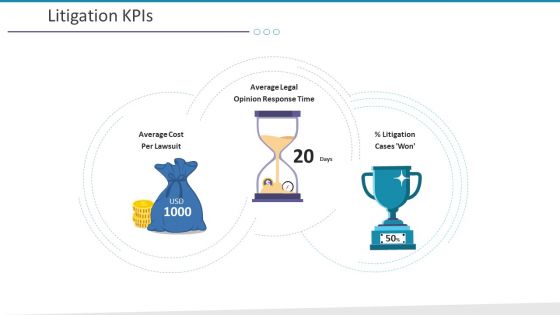
Investigation For Business Procurement Litigation Kpis Ppt Pictures Structure PDF
This is a investigation for business procurement litigation kpis ppt pictures structure pdf. template with various stages. Focus and dispense information on three stages using this creative set, that comes with editable features. It contains large content boxes to add your information on topics like average cost per lawsuit, average legal opinion response time. You can also showcase facts, figures, and other relevant content using this PPT layout. Grab it now.
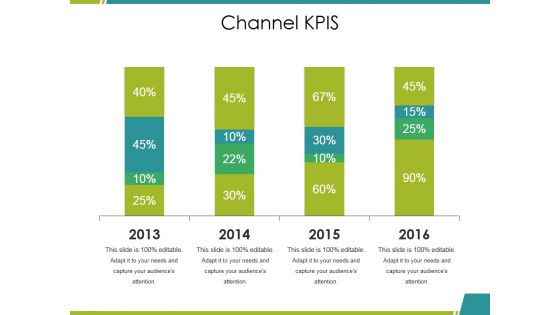
Channel Kpis Ppt PowerPoint Presentation Inspiration Aids
This is a channel kpis ppt powerpoint presentation inspiration aids. This is a four stage process. The stages in this process are business, marketing, graph, percentage, finance.
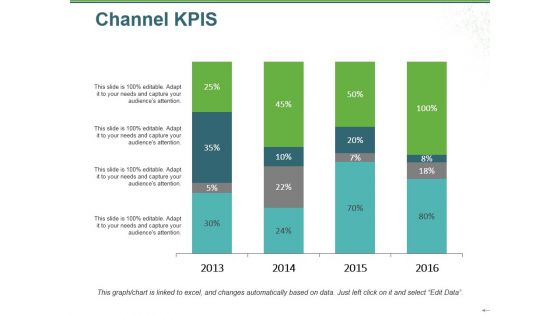
Channel Kpis Ppt PowerPoint Presentation Model Smartart
This is a channel kpis ppt powerpoint presentation model smartart. This is a four stage process. The stages in this process are business, marketing, finance, years, percentage.
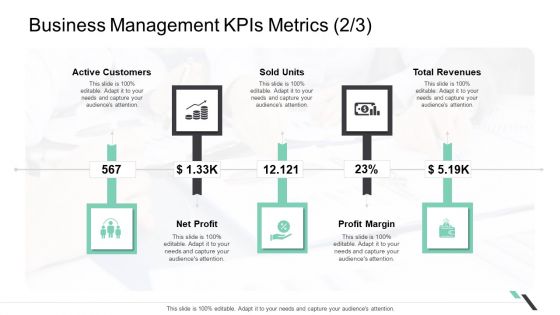
Business Management Kpis Metrics Net Profit Ppt Show Structure PDF
Presenting business management kpis metrics net profit ppt show structure pdf. to provide visual cues and insights. Share and navigate important information on five stages that need your due attention. This template can be used to pitch topics like active customers sold units, total revenues, profit margin, net profit. In addtion, this PPT design contains high resolution images, graphics, etc, that are easily editable and available for immediate download.
Bar Graph Icon For Research Analysis Ppt PowerPoint Presentation Summary Portfolio
Presenting this set of slides with name bar graph icon for research analysis ppt powerpoint presentation summary portfolio. This is a three stage process. The stages in this process are data visualization icon, research analysis, business focus. This is a completely editable PowerPoint presentation and is available for immediate download. Download now and impress your audience.
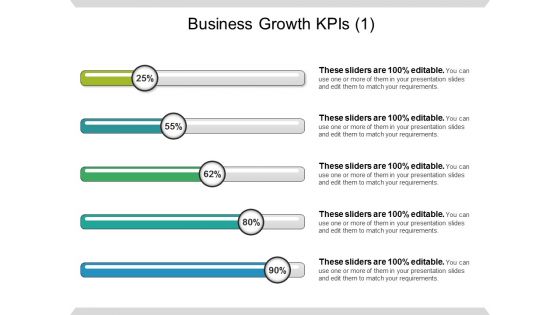
Business Growth Kpis Ppt PowerPoint Presentation File Good
This is a business growth kpis ppt powerpoint presentation file good. This is a five stage process. The stages in this process are cost reduction strategies.
Data Representation Vector Icon Ppt PowerPoint Presentation Infographic Template Samples
Presenting this set of slides with name data representation vector icon ppt powerpoint presentation infographic template samples. This is a one stage process. The stages in this process are data visualization icon, research analysis, business focus. This is a completely editable PowerPoint presentation and is available for immediate download. Download now and impress your audience.
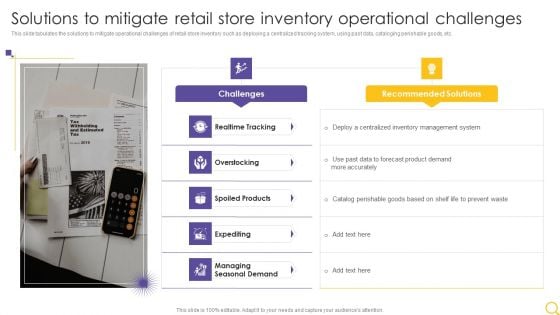
Retail Outlet Operational Efficiency Analytics Solutions To Mitigate Retail Store Inventory Pictures PDF
This slide tabulates the solutions to mitigate operational challenges of retail store inventory such as deploying a centralized tracking system, using past data, cataloging perishable goods, etc. Presenting Retail Outlet Operational Efficiency Analytics Solutions To Mitigate Retail Store Inventory Pictures PDF to provide visual cues and insights. Share and navigate important information on two stages that need your due attention. This template can be used to pitch topics like Challenges, Recommended Solutions, Realtime Tracking. In addtion, this PPT design contains high resolution images, graphics, etc, that are easily editable and available for immediate download.
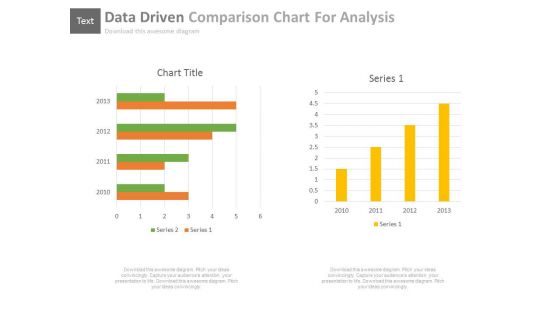
Data Driven Comparison Charts For Analysis Powerpoint Slides
You can download this PowerPoint template to display statistical data and analysis. This PPT slide contains data driven comparison charts. Draw an innovative business idea using this professional diagram.
Data Analysis Vector Icons Ppt Powerpoint Presentation Layouts Gridlines
This is a data analysis vector icons ppt powerpoint presentation layouts gridlines. This is a two stage process. The stages in this process are data presentation, content presentation, information presentation.
Data Interpretation Percentage Analysis Ppt Powerpoint Presentation Summary Icon
This is a data interpretation percentage analysis ppt powerpoint presentation summary icon. This is a six stage process. The stages in this process are data presentation, content presentation, information presentation.
Charts Representing Business Data Analysis Icon Introduction PDF
Presenting charts representing business data analysis icon introduction pdf. to dispense important information. This template comprises three stages. It also presents valuable insights into the topics including charts representing business data analysis icon. This is a completely customizable PowerPoint theme that can be put to use immediately. So, download it and address the topic impactfully.
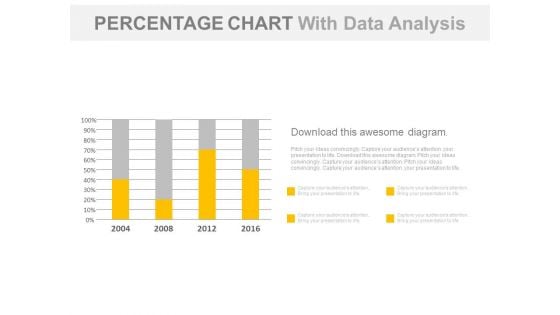
Year Based Chart With Percentage Data Analysis Powerpoint Slides
Our above business slide contains year based statistical chart. This PowerPoint template can be used to display percentage data analysis. Capture the attention of your audience with this slide.
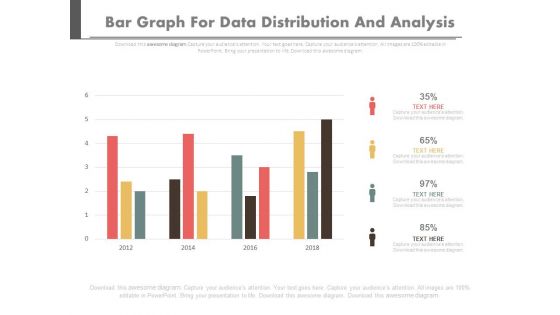
Bar Graph For Data Distribution And Analysis Powerpoint Slides
This PowerPoint template has been designed with bar graph. This PowerPoint diagram is useful for data distribution and analysis This diagram slide can be used to make impressive presentations.
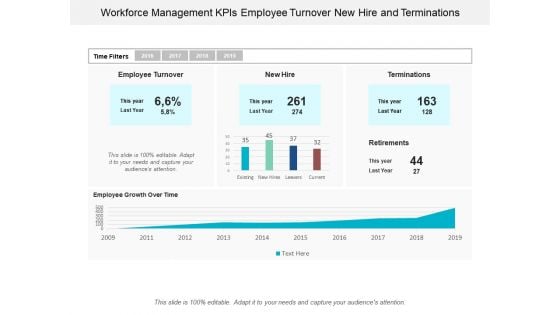
Workforce Management Kpis Employee Turnover New Hire And Terminations Ppt Powerpoint Presentation Portfolio Display
This is a workforce management kpis employee turnover new hire and terminations ppt powerpoint presentation portfolio display. This is a five stage process. The stages in this process are resource management, wealth management, capital management.
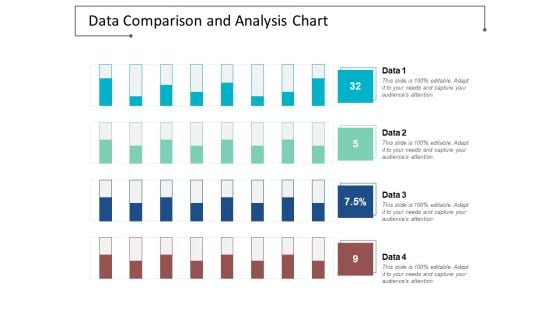
Data Comparison And Analysis Chart Ppt Powerpoint Presentation File Background Images
This is a data comparison and analysis chart ppt powerpoint presentation file background images. This is a four stage process. The stages in this process are data presentation, content presentation, information presentation.
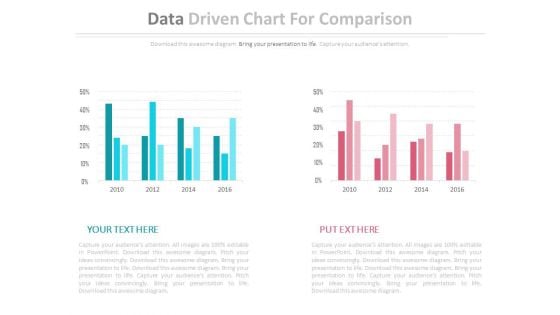
Two Data Driven Comparison Charts Powerpoint Slides
This PowerPoint template contains diagram of two data driven charts. You may use this PPT slide to depict strategic analysis for business. The color coding of this template is specifically designed to highlight you points.
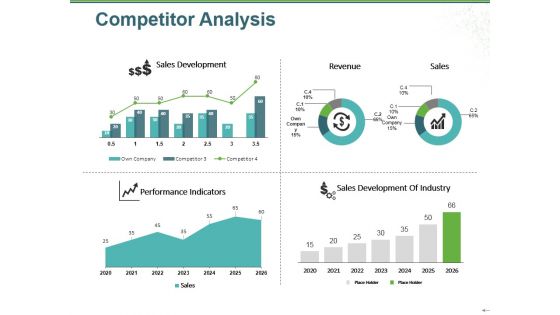
Competitor Analysis Ppt PowerPoint Presentation Pictures Visuals
This is a competitor analysis ppt powerpoint presentation pictures visuals. This is a four stage process. The stages in this process are sales development, performance indicators, sales development of industry, sales, revenue.

Economic Order Quantity Ppt PowerPoint Presentation Pictures Introduction
This is a economic order quantity ppt powerpoint presentation pictures introduction. This is a three stage process. The stages in this process are finance, strategy, marketing, compare, business.
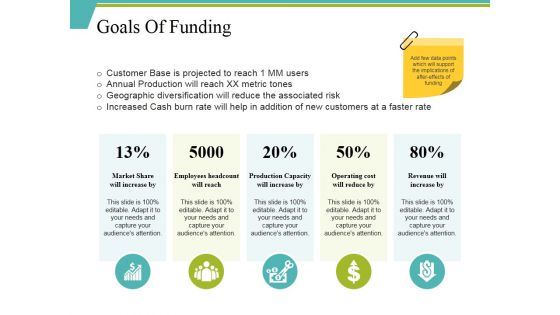
Goals Of Funding Ppt PowerPoint Presentation Pictures Format
This is a goals of funding ppt powerpoint presentation pictures format. This is a five stage process. The stages in this process are market share will increase by, operating cost will reduce by, revenue will increase by.
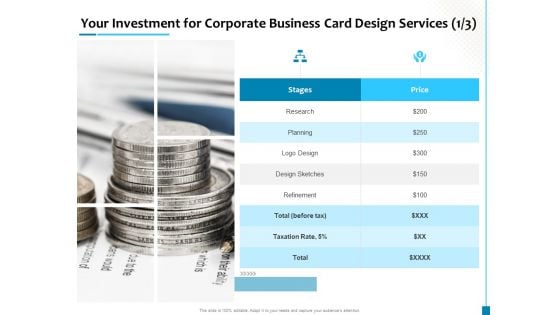
Your Investment For Corporate Business Card Design Services Logo Design Template PDF
Presenting your investment for corporate business card design services logo design template pdf to provide visual cues and insights. Share and navigate important information on one stages that need your due attention. This template can be used to pitch topics like corporate business, card design, planning, logo design, design sketches. In addtion, this PPT design contains high-resolution images, graphics, etc, that are easily editable and available for immediate download.

Thank You Ppt PowerPoint Presentation Picture
This is a thank you ppt powerpoint presentation picture. This is a one stage process. The stages in this process are address, contact numbers, email address.
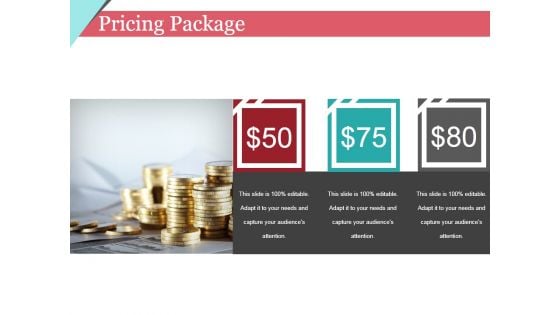
Pricing Package Ppt PowerPoint Presentation Pictures Templates
This is a pricing package ppt powerpoint presentation pictures templates. This is a three stage process. The stages in this process are dollar, symbol, finance, business.
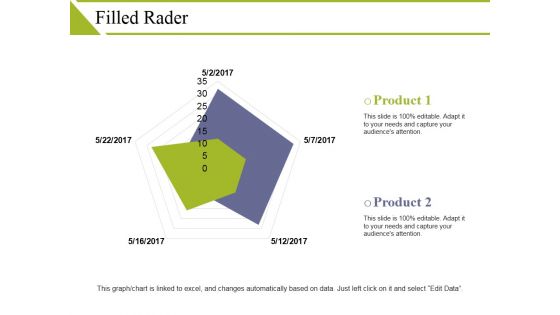
Filled Rader Ppt PowerPoint Presentation Pictures Format
This is a filled rader ppt powerpoint presentation pictures format. This is a two stage process. The stages in this process are product, radar, finance, business, management.
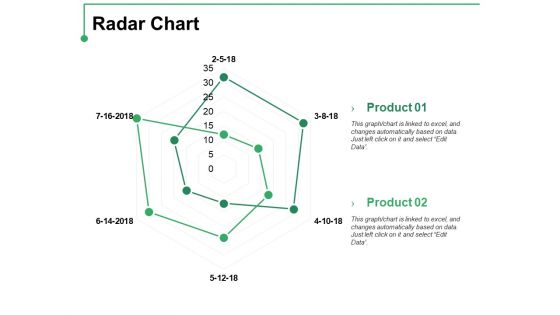
Radar Chart Ppt PowerPoint Presentation Pictures Themes
This is a radar chart ppt powerpoint presentation pictures themes. This is a two stage process. The stages in this process are product, radar chart, finance, business.
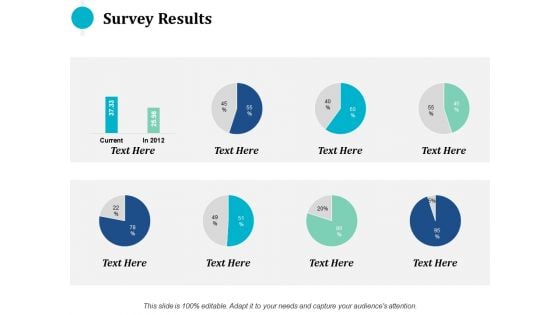
survey results ppt powerpoint presentation pictures guidelines
This is a survey results ppt powerpoint presentation pictures guidelines. This is a eight stage process. The stages in this process are finance, marketing, management, investment, analysis.

Picture Of Money Flowing Out Of Bag Ppt PowerPoint Presentation Portfolio Visual Aids
Presenting this set of slides with name picture of money flowing out of bag ppt powerpoint presentation portfolio visual aids. This is a one stage process. The stages in this process are loss, decrease graph, stock market. This is a completely editable PowerPoint presentation and is available for immediate download. Download now and impress your audience.

Cost Working Capital Business Process Mobility Employee Satisfaction Ppt PowerPoint Presentation Pictures Slides
This is a cost working capital business process mobility employee satisfaction ppt powerpoint presentation pictures slides. This is a three stage process. The stages in this process are cost working capital, business process mobility, employee satisfaction.
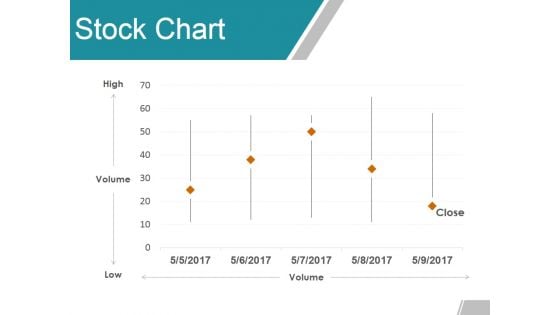
Stock Chart Ppt PowerPoint Presentation Summary Graphics Pictures
This is a stock chart ppt powerpoint presentation summary graphics pictures. This is a five stage process. The stages in this process are high, volume, low, close, finance.
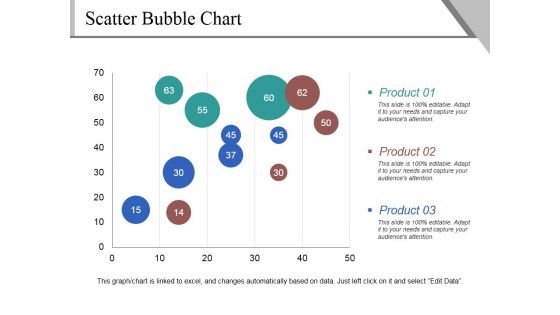
Scatter Bubble Chart Ppt PowerPoint Presentation Pictures Demonstration
This is a scatter bubble chart ppt powerpoint presentation pictures demonstration. This is a three stage process. The stages in this process are product, business, marketing, scatter chart.
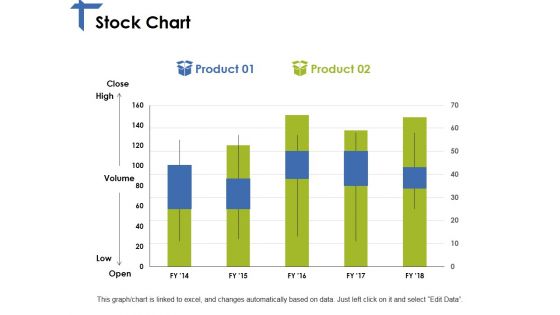
Stock Chart Ppt PowerPoint Presentation Slides Graphics Pictures
This is a stock chart ppt powerpoint presentation slides graphics pictures. This is a two stage process. The stages in this process are product, high, volume, low, open.
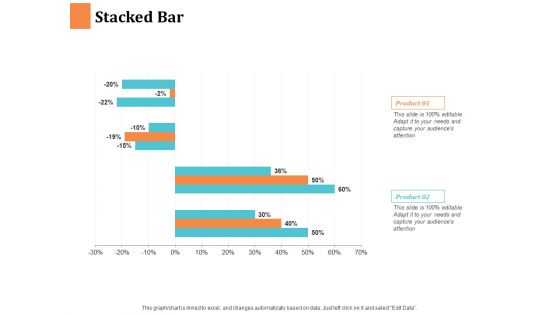
Stacked Bar Ppt PowerPoint Presentation Visual Aids Pictures
This is a stacked bar ppt powerpoint presentation visual aids pictures. This is a two stage process. The stages in this process are product, percentage, finance, business, marketing.
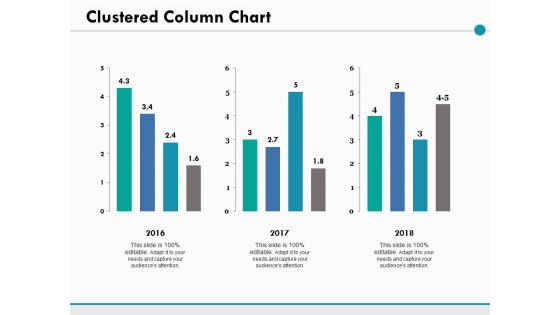
Clustered Column Chart Ppt PowerPoint Presentation Ideas Picture
This is a clustered column chart ppt powerpoint presentation ideas picture. This is a three stage process. The stages in this process are percentage, product, management, marketing.
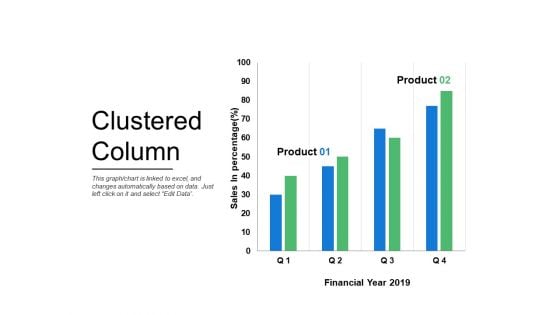
Clustered Column Graph Ppt PowerPoint Presentation Pictures Grid
This is a clustered column graph ppt powerpoint presentation pictures grid. This is a two stage process. The stages in this process are finance, marketing, management, investment, analysis.

Donation Based Crowdfunding Ppt PowerPoint Presentation Pictures Guide
This is a donation based crowdfunding ppt powerpoint presentation pictures guide. This is a five stage process. The stages in this process are art, music and recording art, films and performing art.
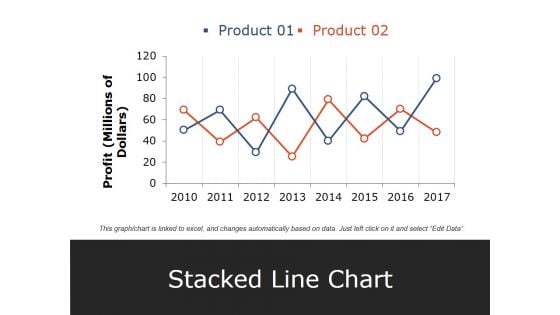
Stacked Line Chart Ppt PowerPoint Presentation Pictures Elements
This is a stacked line chart ppt powerpoint presentation pictures elements. This is a two stage process. The stages in this process are product, profit, stacked line chart, year, business.

Geographic Expansion Inorganic Opportunity Ppt PowerPoint Presentation Pictures Maker
This is a geographic expansion inorganic opportunity ppt powerpoint presentation pictures maker. This is a two stage process. The stages in this process are overview, infrastructure, key points, location, benefits.
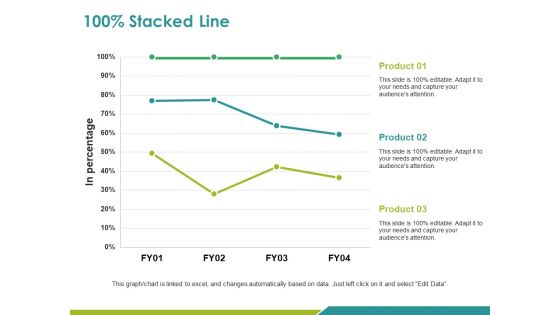
Stacked Line Ppt PowerPoint Presentation Pictures Example Topics
This is a stacked line ppt powerpoint presentation pictures example topics. This is a three stage process. The stages in this process are product, in percentage, stacked line, business, marketing.
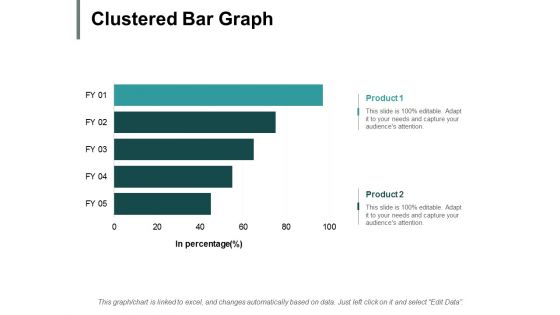
Clustered Bar Graph Ppt PowerPoint Presentation Pictures Example File
This is a clustered bar graph ppt powerpoint presentation pictures example file. This is a two stage process. The stages in this process are finance, marketing, management, investment, analysis.
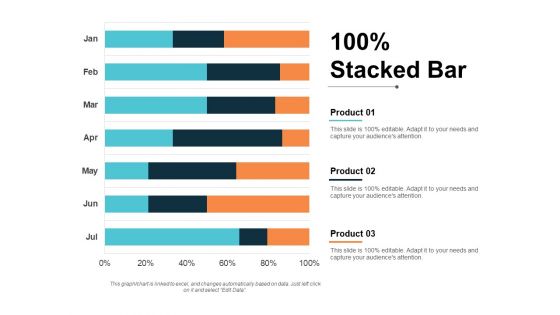
stacked bar finance ppt powerpoint presentation show graphics pictures
This is a stacked bar finance ppt powerpoint presentation show graphics pictures. This is a three stage process. The stages in this process are finance, marketing, management, investment, analysis.
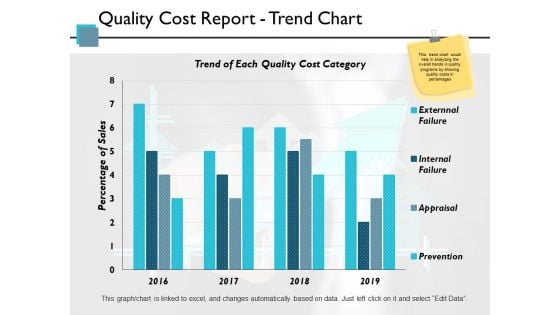
Quality Cost Report Trend Chart Ppt PowerPoint Presentation Pictures Themes
This is a quality cost report trend chart ppt powerpoint presentation pictures themes. This is a four stage process. The stages in this process are finance, strategy, marketing, management, business.
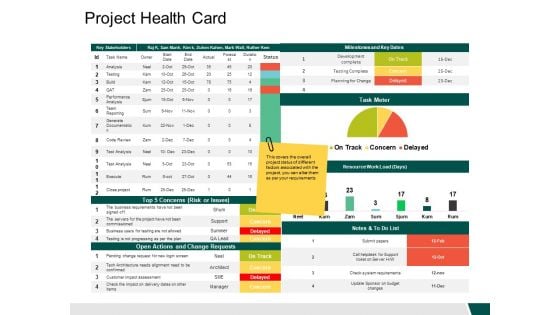
Project Health Card Slide Risk Ppt PowerPoint Presentation Pictures Mockup
This is a project health card slide risk ppt powerpoint presentation pictures mockup. This is a three stage process. The stages in this process are finance, business, management, strategy, analysis.
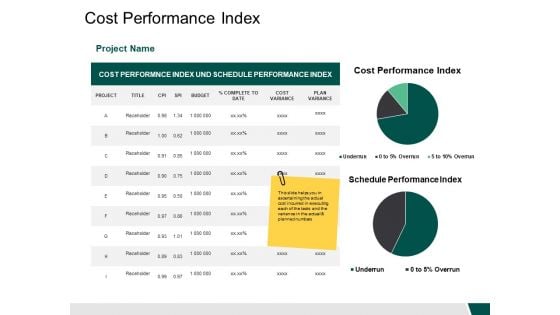
Cost Performance Index Project Ppt PowerPoint Presentation Pictures Design Ideas
This is a cost performance index project ppt powerpoint presentation pictures design ideas. This is a two stage process. The stages in this process are business, finance, strategy, analysis, marketing.
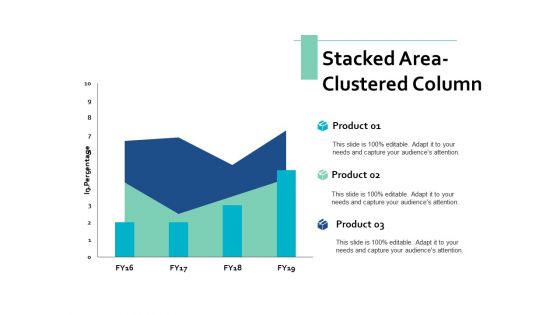
Stacked Area Clustered Column Ppt PowerPoint Presentation Pictures Professional
This is a stacked area clustered column ppt powerpoint presentation pictures professional. This is a three stage process. The stages in this process are finance, marketing, management, investment, analysis.
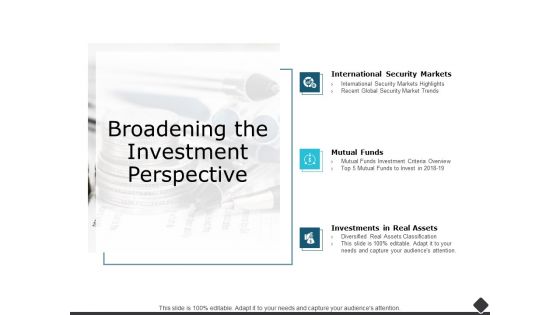
Broadening The Investment Perspective Ppt PowerPoint Presentation Pictures Rules
This is a broadening the investment perspective ppt powerpoint presentation pictures rules. This is a one stage process. The stages in this process are finance, marketing, management, investment, analysis.
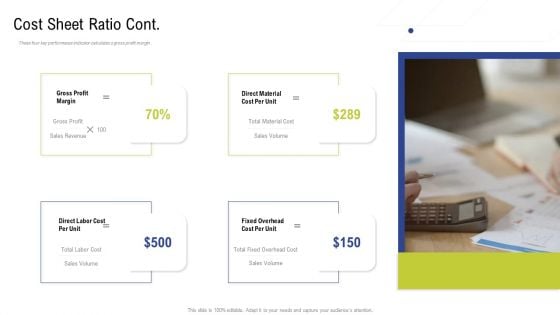
Factory Costs Components Cost Sheet Ratio Cont Ppt Gallery Images PDF
These four key performance indicator calculates a gross profit margin .This is a factory costs components cost sheet ratio cont ppt gallery images pdf. template with various stages. Focus and dispense information on four stages using this creative set, that comes with editable features. It contains large content boxes to add your information on topics like direct material cost per unit, gross profit margin, direct labor cost per unit, sales volume. You can also showcase facts, figures, and other relevant content using this PPT layout. Grab it now.
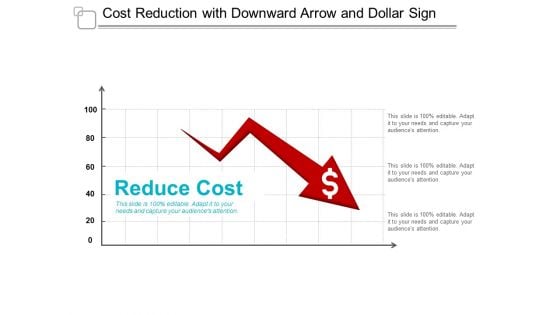
Cost Reduction With Downward Arrow And Dollar Sign Ppt Powerpoint Presentation Infographics Templates
This is a cost reduction with downward arrow and dollar sign ppt powerpoint presentation infographics templates. This is a three stage process. The stages in this process are data analysis, data science, information science.
Currency Signs In Human Hands Vector Icon Ppt Powerpoint Presentation Pictures Example Introduction
This is a currency signs in human hands vector icon ppt powerpoint presentation pictures example introduction. This is a one stage process. The stages in this process are icon save money, icon save expenses, icon save cost.
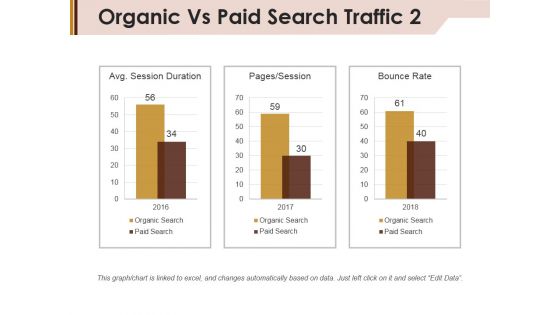
Organic Vs Paid Search Traffic Template 2 Ppt PowerPoint Presentation Pictures Layout Ideas
This is a organic vs paid search traffic template 2 ppt powerpoint presentation pictures layout ideas. This is a three stage process. The stages in this process are session duration, pages session, bounce rate, paid search.
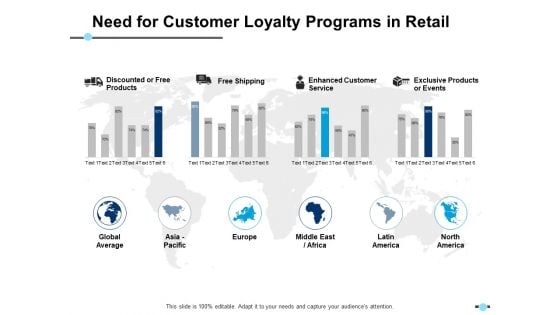
Need For Customer Loyalty Programs In Retail Enhanced Customer Service Ppt PowerPoint Presentation Outline Graphics Pictures
This is a need for customer loyalty programs in retail enhanced customer service ppt powerpoint presentation outline graphics pictures. This is a four stage process. The stages in this process are finance, strategy, analysis, marketing.
Retail Sales By Product Category Icons Ppt PowerPoint Presentation Pictures Layout Ideas
This is a retail sales by product category icons ppt powerpoint presentation pictures layout ideas. This is a two stage process. The stages in this process are finance, strategy, analysis, marketing.
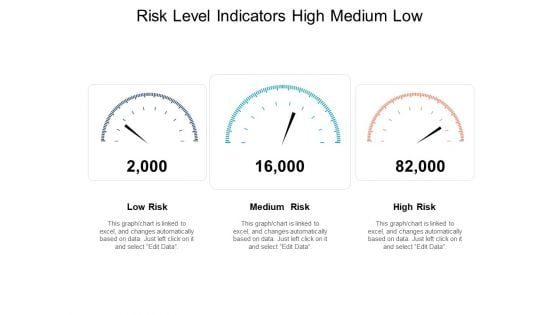
Risk Level Indicators High Medium Low Ppt PowerPoint Presentation Pictures Template
Presenting this set of slides with name risk level indicators high medium low ppt powerpoint presentation pictures template. This is a three stage process. The stages in this process are high low risk, risk con, warning. This is a completely editable PowerPoint presentation and is available for immediate download. Download now and impress your audience.
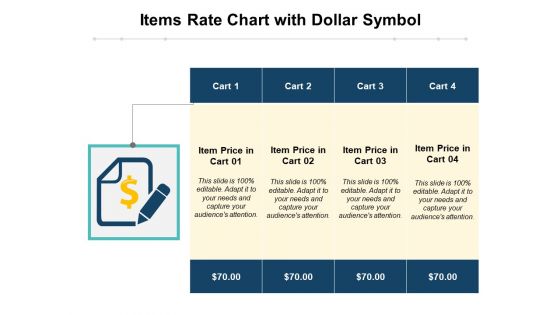
Items Rate Chart With Dollar Symbol Ppt PowerPoint Presentation Professional Pictures PDF
Presenting this set of slides with name items rate chart with dollar symbol ppt powerpoint presentation professional pictures pdf. This is a four stage process. The stages in this process are items rate chart with dollar symbol. This is a completely editable PowerPoint presentation and is available for immediate download. Download now and impress your audience.
Payback Card With Dollar Symbol Vector Icon Ppt PowerPoint Presentation Pictures Templates PDF
Presenting payback card with dollar symbol vector icon ppt powerpoint presentation pictures templates pdf to dispense important information. This template comprises three stages. It also presents valuable insights into the topics including payback card with dollar symbol vector icon. This is a completely customizable PowerPoint theme that can be put to use immediately. So, download it and address the topic impactfully.
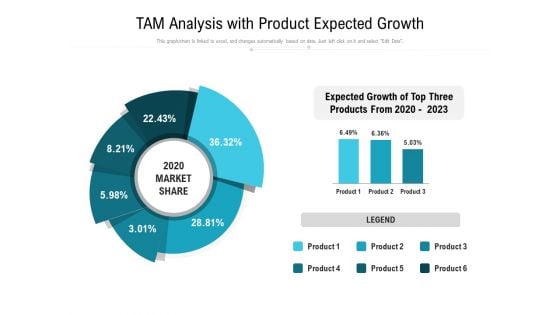
TAM Analysis With Product Expected Growth Ppt PowerPoint Presentation Pictures Samples PDF
Persuade your audience using this tam analysis with product expected growth ppt powerpoint presentation pictures samples pdf. This PPT design covers one stages, thus making it a great tool to use. It also caters to a variety of topics including expected growth of top three products from 2020 tO 2023, 2020 market share, legend. Download this PPT design now to present a convincing pitch that not only emphasizes the topic but also showcases your presentation skills.
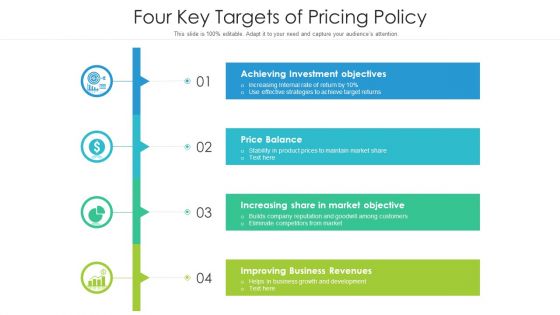
Four Key Targets Of Pricing Policy Ppt PowerPoint Presentation File Graphics Pictures PDF
Persuade your audience using this four key targets of pricing policy ppt powerpoint presentation file graphics pictures pdf. This PPT design covers four stages, thus making it a great tool to use. It also caters to a variety of topics including four key targets of pricing policy. Download this PPT design now to present a convincing pitch that not only emphasizes the topic but also showcases your presentation skills.
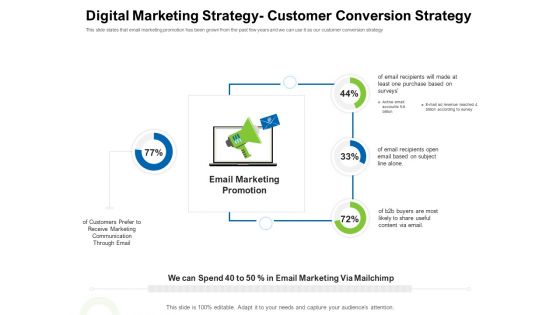
Strategies To Enter Physical Fitness Club Business Digital Marketing Strategy Customer Conversion Strategy Pictures PDF
This slide states that email marketing promotion has been grown from the past few years and we can use it as our customer conversion strategy Presenting strategies to enter physical fitness club business digital marketing strategy customer conversion strategy pictures pdf to provide visual cues and insights. Share and navigate important information on four stages that need your due attention. This template can be used to pitch topics like email, marketing, promotion, communication, buyers. In addtion, this PPT design contains high resolution images, graphics, etc, that are easily editable and available for immediate download.
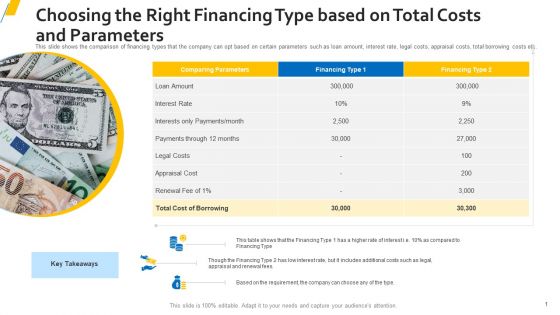
Choosing The Right Financing Type Based On Total Costs And Parameters Pictures PDF
This slide shows the comparison of financing types that the company can opt based on certain parameters such as loan amount, interest rate, legal costs, appraisal costs, total borrowing costs etc. This is a choosing the right financing type based on total costs and parameters pictures pdf. template with various stages. Focus and dispense information on two stages using this creative set, that comes with editable features. It contains large content boxes to add your information on topics like legal costs, appraisal cost, total cost of borrowing. You can also showcase facts, figures, and other relevant content using this PPT layout. Grab it now.
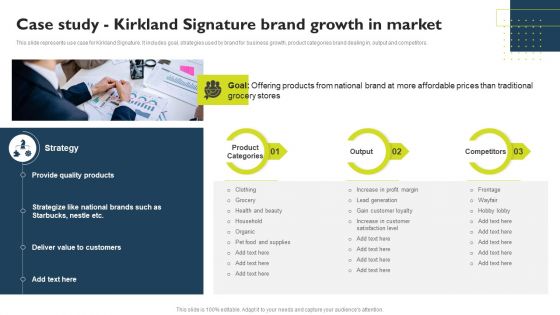
Successful Private Branding Case Study Kirkland Signature Brand Growth In Market Pictures PDF
This slide represents use case for Kirkland Signature. It includes goal, strategies used by brand for business growth, product categories brand dealing in, output and competitors. Slidegeeks is one of the best resources for PowerPoint templates. You can download easily and regulate Successful Private Branding Case Study Kirkland Signature Brand Growth In Market Pictures PDF for your personal presentations from our wonderful collection. A few clicks is all it takes to discover and get the most relevant and appropriate templates. Use our Templates to add a unique zing and appeal to your presentation and meetings. All the slides are easy to edit and you can use them even for advertisement purposes.
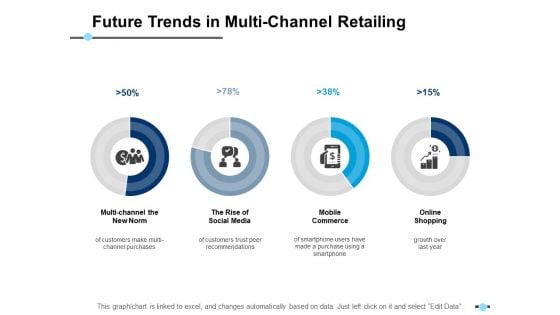
Future Trends In Multi Channel Retailing Multi Channel The New Norm Ppt PowerPoint Presentation Pictures Background Images
This is a future trends in multi channel retailing multi channel the new norm ppt powerpoint presentation pictures background images. This is a four stage process. The stages in this process are finance, management, strategy, analysis, marketing.


 Continue with Email

 Home
Home


