Financial Snapshot
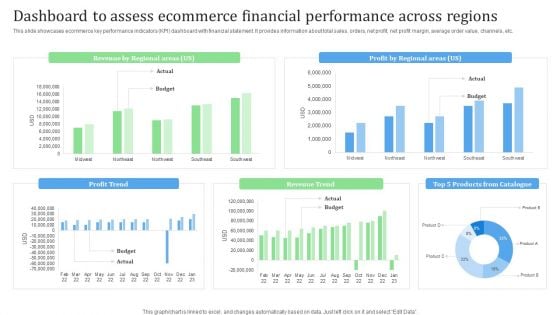
Dashboard To Assess Ecommerce Financial Performance Across Regions Financial Management Strategies Clipart PDF
This slide showcases ecommerce key performance indicators KPI dashboard with financial statement. It provides information about total sales, orders, net profit, net profit margin, average order value, channels, etc.Present like a pro with Dashboard To Assess Ecommerce Financial Performance Across Regions Financial Management Strategies Clipart PDF Create beautiful presentations together with your team, using our easy-to-use presentation slides. Share your ideas in real-time and make changes on the fly by downloading our templates. So whether you are in the office, on the go, or in a remote location, you can stay in sync with your team and present your ideas with confidence. With Slidegeeks presentation got a whole lot easier. Grab these presentations today.
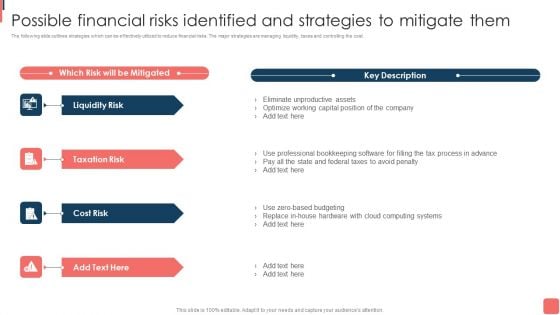
Effective Financial Planning Assessment Techniques Possible Financial Risks Identified And Strategies To Mitigate Demonstration PDF
The following slide outlines strategies which can be effectively utilized to reduce financial risks. The major strategies are managing liquidity, taxes and controlling the cost. The Effective Financial Planning Assessment Techniques Possible Financial Risks Identified And Strategies To Mitigate Demonstration PDF is a compilation of the most recent design trends as a series of slides. It is suitable for any subject or industry presentation, containing attractive visuals and photo spots for businesses to clearly express their messages. This template contains a variety of slides for the user to input data, such as structures to contrast two elements, bullet points, and slides for written information. Slidegeeks is prepared to create an impression.
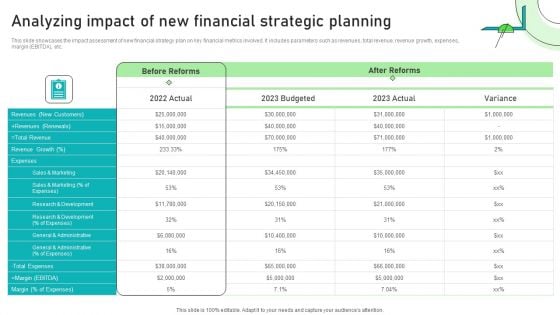
Adjusting Financial Strategies And Planning Analyzing Impact Of New Financial Strategic Planning Graphics PDF
This slide showcases the impact assessment of new financial strategy plan on key financial metrics involved. It includes parameters such as revenues, total revenue, revenue growth, expenses, margin EBITDA, etc. Are you in need of a template that can accommodate all of your creative concepts This one is crafted professionally and can be altered to fit any style. Use it with Google Slides or PowerPoint. Include striking photographs, symbols, depictions, and other visuals. Fill, move around, or remove text boxes as desired. Test out color palettes and font mixtures. Edit and save your work, or work with colleagues. Download Adjusting Financial Strategies And Planning Analyzing Impact Of New Financial Strategic Planning Graphics PDF and observe how to make your presentation outstanding. Give an impeccable presentation to your group and make your presentation unforgettable.
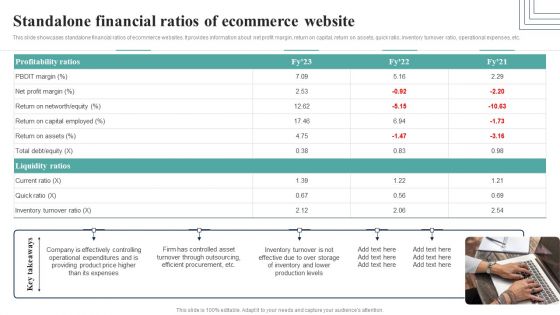
How Electronic Commerce Financial Procedure Can Be Enhanced Standalone Financial Ratios Of Ecommerce Website Template PDF
This slide showcases standalone financial ratios of ecommerce websites. It provides information about net profit margin, return on capital, return on assets, quick ratio, inventory turnover ratio, operational expenses, etc. The How Electronic Commerce Financial Procedure Can Be Enhanced Standalone Financial Ratios Of Ecommerce Website Template PDF is a compilation of the most recent design trends as a series of slides. It is suitable for any subject or industry presentation, containing attractive visuals and photo spots for businesses to clearly express their messages. This template contains a variety of slides for the user to input data, such as structures to contrast two elements, bullet points, and slides for written information. Slidegeeks is prepared to create an impression.
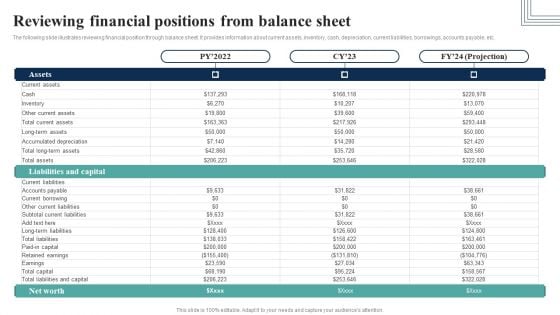
How Electronic Commerce Financial Procedure Can Be Enhanced Reviewing Financial Positions From Balance Sheet Ideas PDF
The following slide illustrates reviewing financial position through balance sheet. It provides information about current assets, inventory, cash, depreciation, current liabilities, borrowings, accounts payable, etc.This modern and well-arranged How Electronic Commerce Financial Procedure Can Be Enhanced Reviewing Financial Positions From Balance Sheet Ideas PDF provides lots of creative possibilities. It is very simple to customize and edit with the Powerpoint Software. Just drag and drop your pictures into the shapes. All facets of this template can be edited with Powerpoint no extra software is necessary. Add your own material, put your images in the places assigned for them, adjust the colors, and then you can show your slides to the world, with an animated slide included.
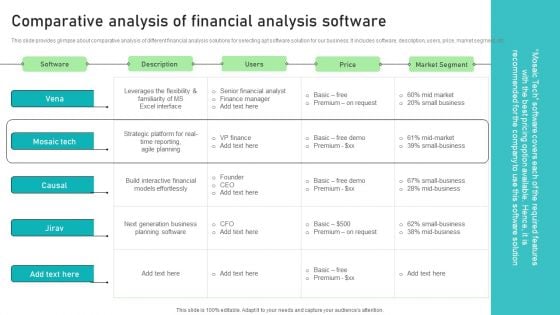
Adjusting Financial Strategies And Planning Comparative Analysis Of Financial Analysis Software Structure PDF
This slide provides glimpse about comparative analysis of different corporate investment portfolios for selecting appropriate investment portfolio. It includes KPIs such as return, risk, liquidity, time horizon, etc. Coming up with a presentation necessitates that the majority of the effort goes into the content and the message you intend to convey. The visuals of a PowerPoint presentation can only be effective if it supplements and supports the story that is being told. Keeping this in mind our experts created Adjusting Financial Strategies And Planning Comparative Analysis Of Financial Analysis Software Structure PDF to reduce the time that goes into designing the presentation. This way, you can concentrate on the message while our designers take care of providing you with the right template for the situation.
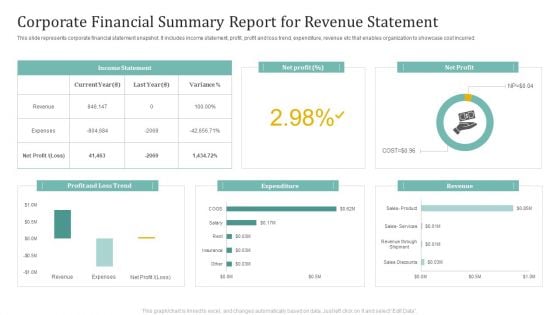
Corporate Financial Summary Report For Revenue Statement Ppt Ideas Graphic Images
This slide represents corporate financial statement snapshot. It includes income statement, profit, profit and loss trend, expenditure, revenue etc that enables organization to showcase cost incurred. Showcasing this set of slides titled Corporate Financial Summary Report For Revenue Statement Ppt Ideas Graphic Images. The topics addressed in these templates are Income Statement, Net Profit, Expenditure. All the content presented in this PPT design is completely editable. Download it and make adjustments in color, background, font etc. as per your unique business setting.
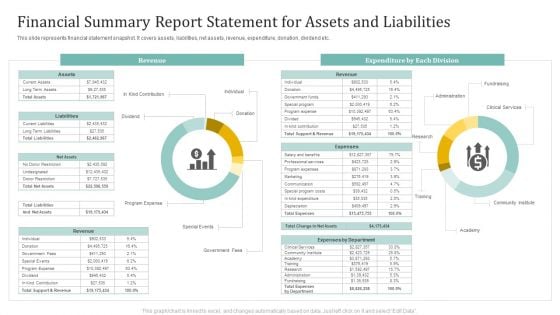
Financial Summary Report Statement For Assets And Liabilities Ppt Slides Guide PDF
This slide represents financial statement snapshot. It covers assets, liabilities, net assets, revenue, expenditure, donation, dividend etc. Pitch your topic with ease and precision using this Financial Summary Report Statement For Assets And Liabilities Ppt Slides Guide PDF. This layout presents information on Revenue, Expenditure Each Division, Fundraising. It is also available for immediate download and adjustment. So, changes can be made in the color, design, graphics or any other component to create a unique layout.
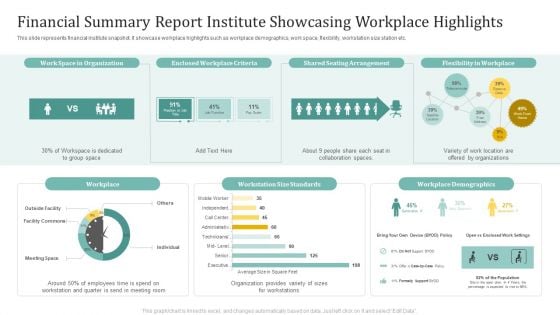
Financial Summary Report Institute Showcasing Workplace Highlights Ppt Infographics Inspiration PDF
This slide represents financial institute snapshot. It showcase workplace highlights such as workplace demographics, work space, flexibility, workstation size station etc. Pitch your topic with ease and precision using this Financial Summary Report Institute Showcasing Workplace Highlights Ppt Infographics Inspiration PDF. This layout presents information on Shared Seating Arrangement, Flexibility Workplace, Workplace. It is also available for immediate download and adjustment. So, changes can be made in the color, design, graphics or any other component to create a unique layout.
Business Financial Summary Report And Marketing Highlights Ppt File Icon PDF
This slide represents business snapshot for financial and marketing highlights. It includes business objectives, opportunities and challenges, financial highlights, marketing strategy, future steps and priorities. Showcasing this set of slides titled Business Financial Summary Report And Marketing Highlights Ppt File Icon PDF. The topics addressed in these templates are Location, Marketing Strategy, Financials, Objectives. All the content presented in this PPT design is completely editable. Download it and make adjustments in color, background, font etc. as per your unique business setting.
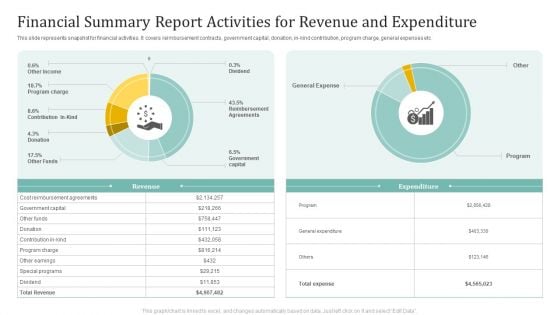
Financial Summary Report Activities For Revenue And Expenditure Ppt Inspiration Display PDF
This slide represents snapshot for financial activities. It covers reimbursement contracts, government capital, donation, in-kind contribution, program charge, general expenses etc. Pitch your topic with ease and precision using this Financial Summary Report Activities For Revenue And Expenditure Ppt Inspiration Display PDF. This layout presents information on Government Capital, Other Funds, Program Charge. It is also available for immediate download and adjustment. So, changes can be made in the color, design, graphics or any other component to create a unique layout.
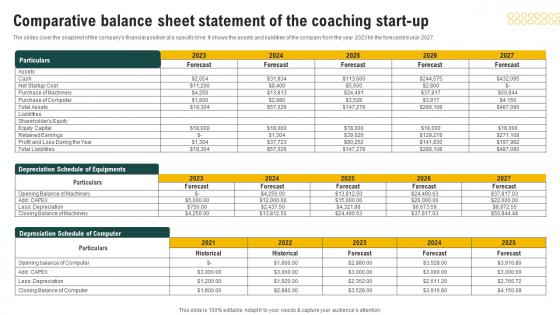
Comparative Balance Sheet Statement Coaching Business Plan Financial Projections Demonstration Pdf
The slides cover the snapshot of the companys financial position at a specific time. It shows the assets and liabilities of the company from the year 2023 till the forecasted year 2027. Boost your pitch with our creative Comparative Balance Sheet Statement Coaching Business Plan Financial Projections Demonstration Pdf. Deliver an awe-inspiring pitch that will mesmerize everyone. Using these presentation templates you will surely catch everyones attention. You can browse the ppts collection on our website. We have researchers who are experts at creating the right content for the templates. So you do not have to invest time in any additional work. Just grab the template now and use them. The slides cover the snapshot of the companys financial position at a specific time. It shows the assets and liabilities of the company from the year 2023 till the forecasted year 2027.
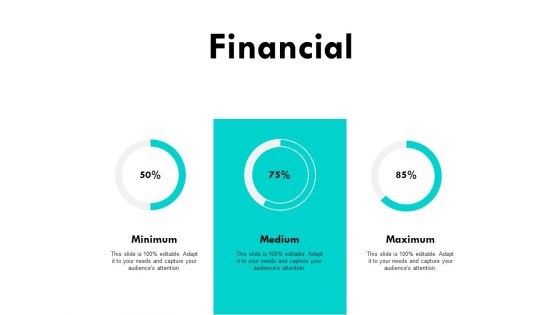
Financial Minimum Maximum Ppt PowerPoint Presentation Pictures Templates
Presenting this set of slides with namefinancial minimum maximum ppt powerpoint presentation pictures templates. The topics discussed in these slides are financial, minimum, maximum, marketing, strategy. This is a completely editable PowerPoint presentation and is available for immediate download. Download now and impress your audience.
Annual Financial Data Insights Dashboard Icon Introduction PDF
Showcasing this set of slides titled Annual Financial Data Insights Dashboard Icon Introduction PDF. The topics addressed in these templates are Annual Financial, Data Insights, Dashboard. All the content presented in this PPT design is completely editable. Download it and make adjustments in color, background, font etc. as per your unique business setting.
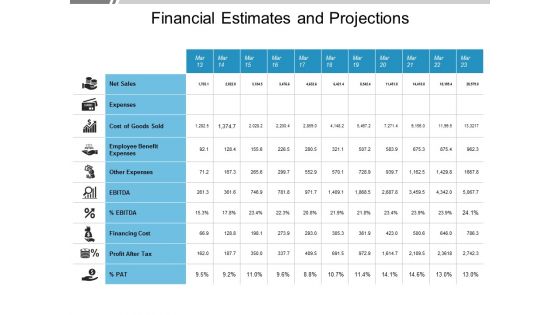
Financial Estimates And Projections Ppt PowerPoint Presentation Layouts Graphics Pictures
This is a financial estimates and projections ppt powerpoint presentation layouts graphics pictures. This is a ten stage process. The stages in this process are investment, funding, private equity, venture capital.
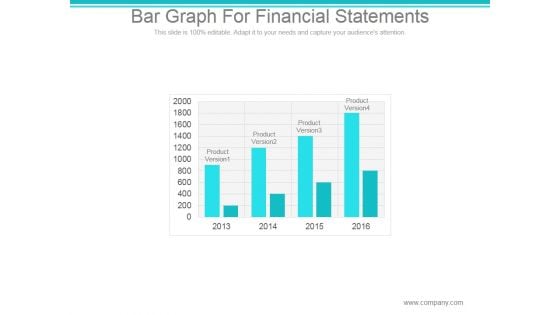
Bar Graph For Financial Statements Ppt PowerPoint Presentation Example
This is a bar graph for financial statements ppt powerpoint presentation example. This is a four stage process. The stages in this process are product version, finance, year.
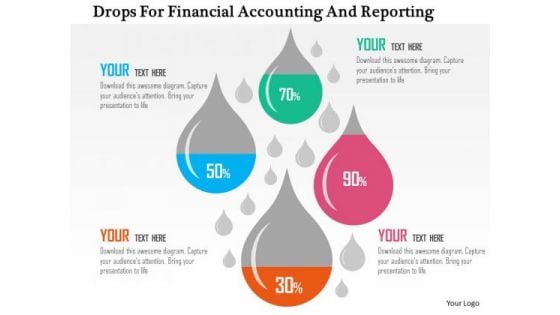
Business Diagram Drops For Financial Accounting And Reporting Presentation Template
This business diagram has been designed with drops displaying financial ratios. Download this diagram to depict financial and accounting ratios. Use this slide to build quality presentations for your viewers.
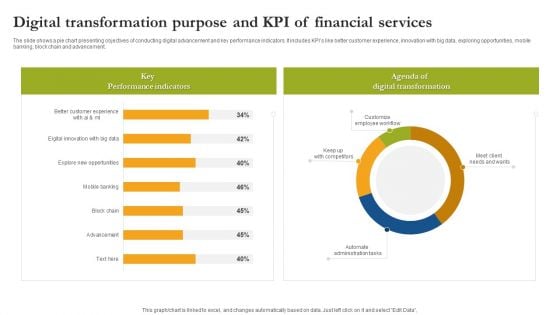
Digital Transformation Purpose And Kpi Of Financial Services Guidelines PDF
The slide shows a pie chart presenting objectives of conducting digital advancement and key performance indicators. It includes KPIs like better customer experience, innovation with big data, exploring opportunities, mobile banking, block chain and advancement. Showcasing this set of slides titled Digital Transformation Purpose And Kpi Of Financial Services Guidelines PDF. The topics addressed in these templates are Key Performance Indicators Digital Transformation, Customize Employee Workflow. All the content presented in this PPT design is completely editable. Download it and make adjustments in color, background, font etc. as per your unique business setting.
Assets And Revenue Financial Summary Ppt PowerPoint Presentation Icon Picture
This is a assets and revenue financial summary ppt powerpoint presentation icon picture. This is a six stage process. The stages in this process are business, strategy, marketing, finance, analysis.
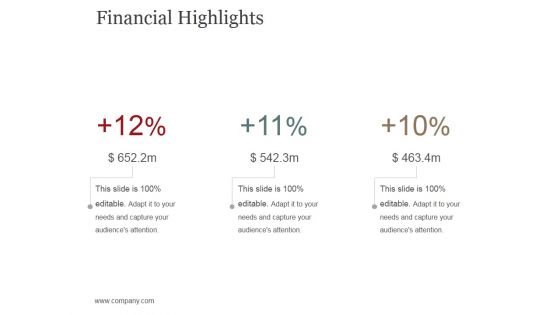
Financial Highlights Template 2 Ppt PowerPoint Presentation Pictures Examples
This is a financial highlights template 2 ppt powerpoint presentation pictures examples. This is a three stage process. The stages in this process are business, marketing, finance, management, analysis.
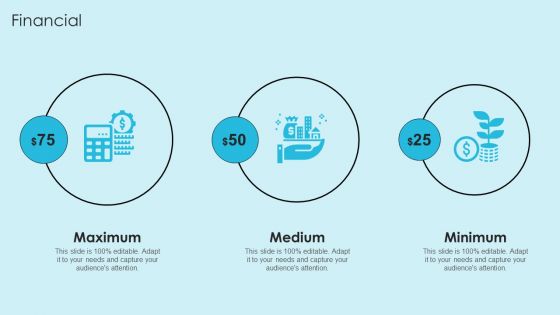
Online Marketing Techniques For Acquiring Clients Financial Pictures PDF
Create an editable Online Marketing Techniques For Acquiring Clients Financial Pictures PDF that communicates your idea and engages your audience. Whether you are presenting a business or an educational presentation, pre designed presentation templates help save time. Online Marketing Techniques For Acquiring Clients Financial Pictures PDF is highly customizable and very easy to edit, covering many different styles from creative to business presentations. Slidegeeks has creative team members who have crafted amazing templates. So, go and get them without any delay.
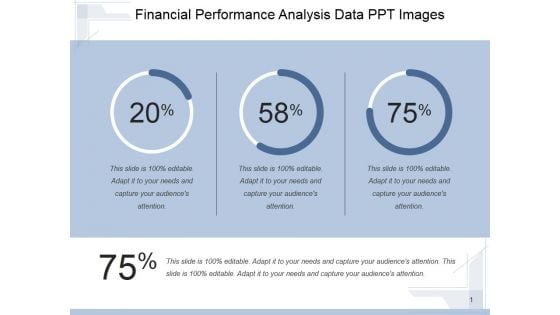
Financial Performance Analysis Data Ppt PowerPoint Presentation Topics
This is a financial performance analysis data ppt powerpoint presentation topics. This is a three stage process. The stages in this process are finance, percentage, marketing, business, growth.
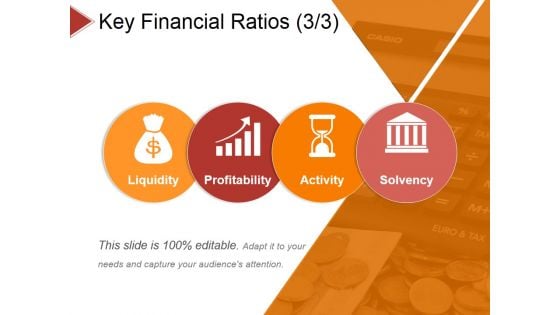
Key Financial Ratios Template 3 Ppt PowerPoint Presentation Summary Sample
This is a key financial ratios template 3 ppt powerpoint presentation summary sample. This is a four stage process. The stages in this process are liquidity, profitability, activity, solvency.
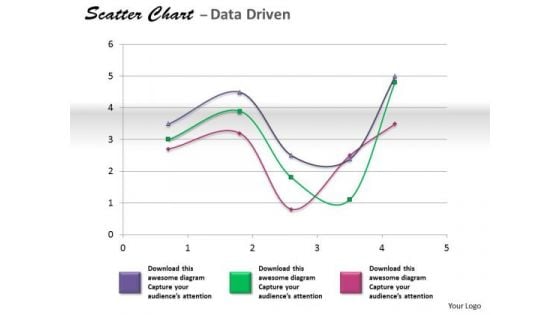
Financial Data Analysis Coordinate With Scatter Chart PowerPoint Templates
Get The Doers Into Action. Activate Them With Our financial data analysis coordinate with scatter chart Powerpoint Templates .
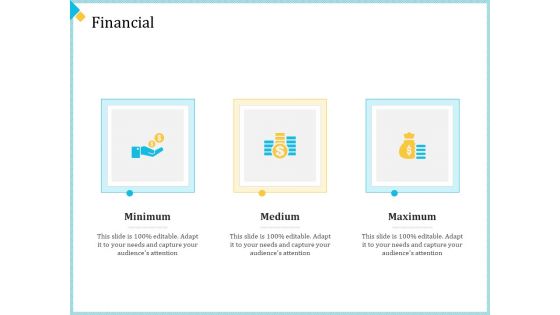
Establish Management Team Financial Ppt Pictures Graphics Download PDF
This is a establish management team financial ppt pictures graphics download pdf. template with various stages. Focus and dispense information on three stages using this creative set, that comes with editable features. It contains large content boxes to add your information on topics like minimum, medium, maximum. You can also showcase facts, figures, and other relevant content using this PPT layout. Grab it now.
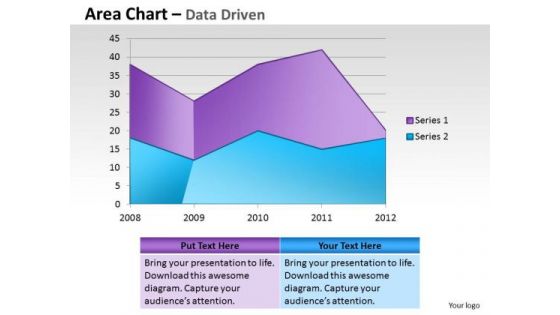
Financial Data Analysis Area Chart For Showing Trends PowerPoint Templates
Document Your Views On Our financial data analysis area chart for showing trends Powerpoint Templates . They Will Create A Strong Impression.
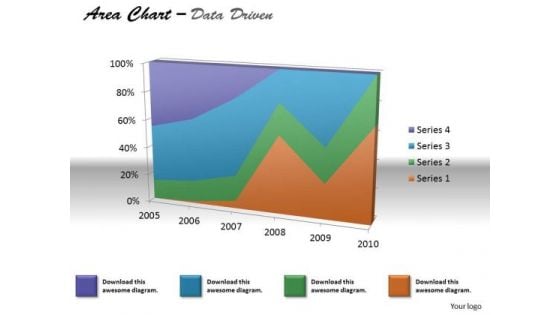
Financial Data Analysis Area Chart For Various Values PowerPoint Templates
Document The Process On Our financial data analysis area chart for various values Powerpoint Templates . Make A Record Of Every Detail.
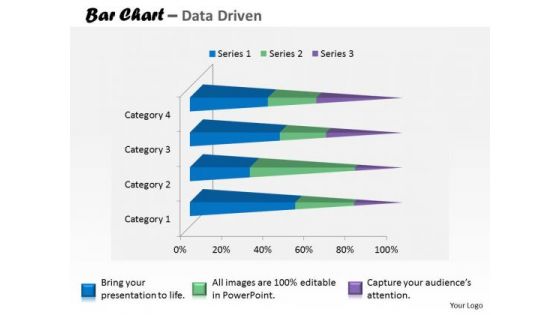
Financial Data Analysis Currency Trading Bar Chart PowerPoint Templates
Put In A Dollop Of Our financial data analysis currency trading bar chart Powerpoint Templates . Give Your Thoughts A Distinctive Flavor.
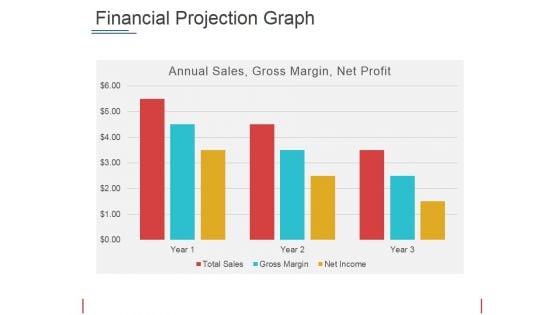
Financial Projection Graph Template 2 Ppt PowerPoint Presentation Show Picture
This is a financial projection graph template 2 ppt powerpoint presentation show picture. This is a three stage process. The stages in this process are annual sales, gross margin, net profit, years.
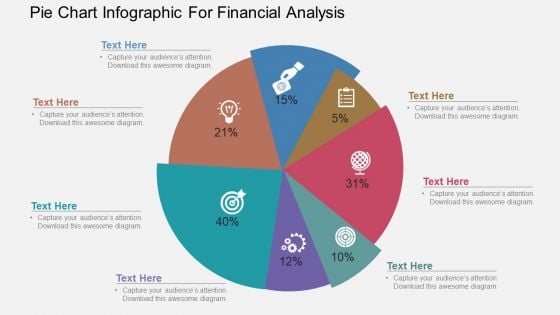
Pie Chart Infographic For Financial Analysis Powerpoint Template
Our above PowerPoint template has been designed with pie chart infographic. This slide is suitable to present financial analysis. Use this business diagram to present your work in a more smart and precise manner.
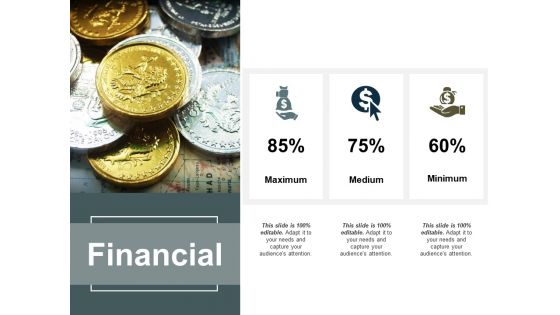
Financial Maximum Medium Ppt PowerPoint Presentation Layouts Pictures
This is a financial maximum medium ppt powerpoint presentation layouts pictures. This is a three stage process. The stages in this process are financial, maximum, medium, minimum, marketing.
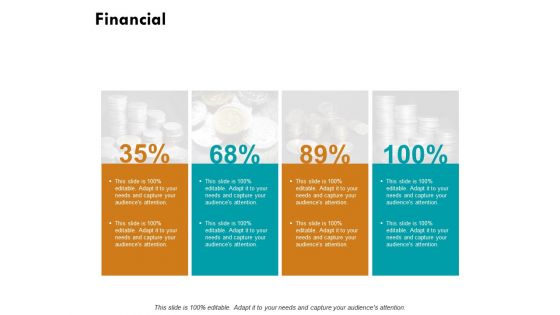
Financial Investment Ppt PowerPoint Presentation Pictures Infographic Template
This is a financial investment ppt powerpoint presentation pictures infographic template. This is a four stage process. The stages in this process are financial, minimum, maximum, marketing, strategy.
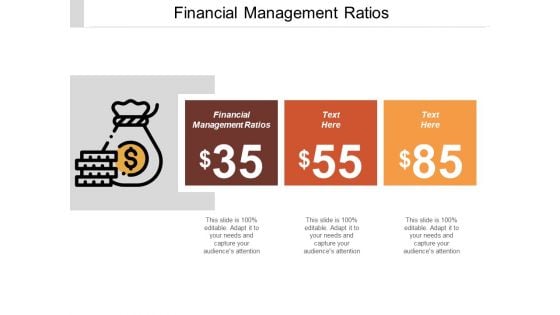
Financial Management Ratios Ppt PowerPoint Presentation Pictures Mockup Cpb
This is a financial management ratios ppt powerpoint presentation pictures mockup cpb. This is a three stage process. The stages in this process are financial management ratios.
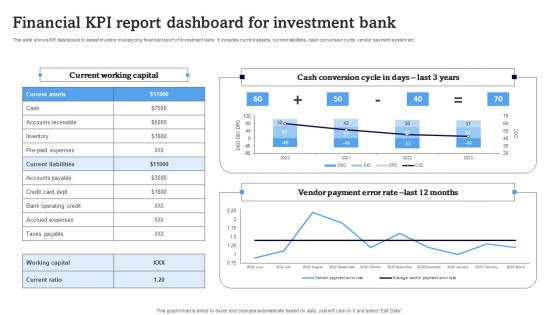
Financial KPI Report Dashboard For Investment Bank Structure Pdf
This slide shows KPI dashboard to assist investor in analyzing financial report of investment bank. It includes current assets, current liabilities, cash conversion cycle, vendor payment system etc. Showcasing this set of slides titled Financial KPI Report Dashboard For Investment Bank Structure Pdf. The topics addressed in these templates are Current Working Capital, Cash Conversion Cycle Days, Vendor Payment Error Rate. All the content presented in this PPT design is completely editable. Download it and make adjustments in color, background, font etc. as per your unique business setting. This slide shows KPI dashboard to assist investor in analyzing financial report of investment bank. It includes current assets, current liabilities, cash conversion cycle, vendor payment system etc.
Financial Bizbok Business Design Ppt PowerPoint Presentation Pictures Graphics
This is a financial bizbok business design ppt powerpoint presentation pictures graphics. This is a three stage process. The stages in this process are business, management, strategy, analysis, financial.
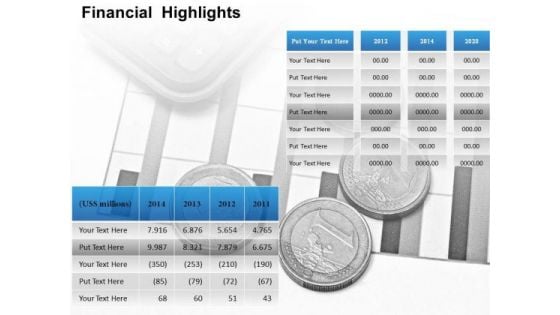
Business Cycle Diagram Financial Presentation Diagram Marketing Diagram
Get Out Of The Dock With Our Business Cycle Diagram Financial Presentation Diagram Marketing Diagram Powerpoint Templates. Your Mind Will Be Set Free. Play The Doctor With Our Business Cycle Diagram Financial Presentation Diagram Marketing Diagram Powerpoint Templates. Control Operations With Your Ideas.
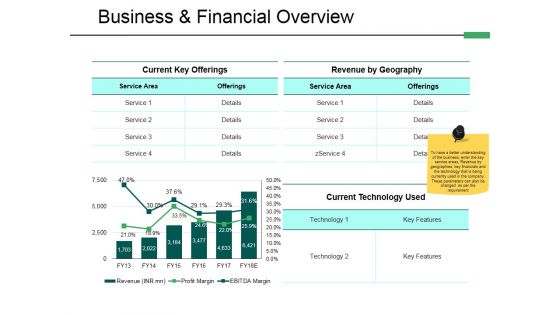
Business And Financial Overview Ppt PowerPoint Presentation Pictures Visuals
This is a business and financial overview ppt powerpoint presentation pictures visuals. This is a two stage process. The stages in this process are current key offerings, revenue by geography, current technology used, business financial overview.
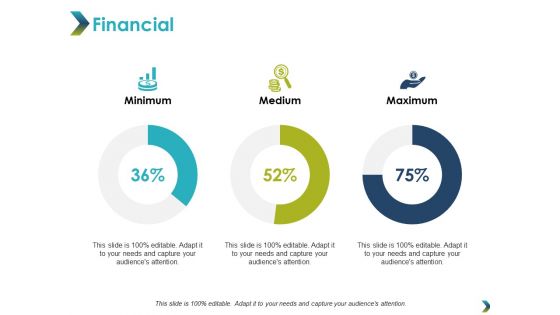
Financial Minimum Maximum Ppt PowerPoint Presentation Infographic Template Picture
This is a financial minimum maximum ppt powerpoint presentation infographic template picture. This is a three stage process. The stages in this process are financial, minimum, maximum, marketing, strategy.

Financial Marketing Analysis Ppt Powerpoint Presentation Pictures Graphics Example
This is a financial marketing analysis ppt powerpoint presentation pictures graphics example. This is a three stage process. The stages in this process are financial, marketing, management, investment, analysis.
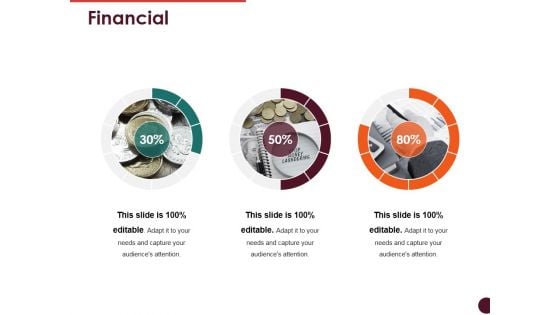
Financial Ppt PowerPoint Presentation Infographic Template Graphics Pictures
This is a financial ppt powerpoint presentation infographic template graphics pictures. This is a three stage process. The stages in this process are percentage, coin, business, finance, marketing.

Financial Projections Ppt PowerPoint Presentation Professional Graphics Pictures
This is a financial projections ppt powerpoint presentation professional graphics pictures. This is a three stage process. The stages in this process are dollar, business, finance, marketing, percentage.
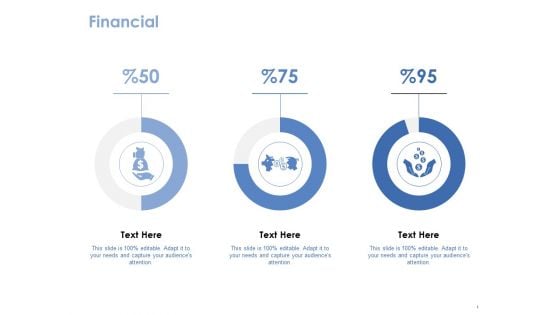
Financial Template 1 Ppt PowerPoint Presentation Pictures Files
This is a financial template 1 ppt powerpoint presentation pictures files. This is a three stage process. The stages in this process are business, finance, marketing, icons, strategy.

Financial Investment Marketing Ppt PowerPoint Presentation Pictures Elements
This is a financial investment marketing ppt powerpoint presentation pictures elements. This is a three stage process. The stages in this process are business, finance, analysis, investment, marketing.
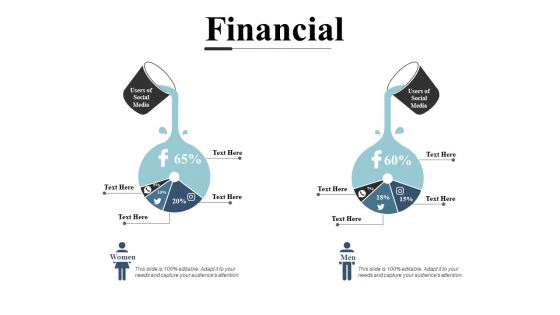
Financial Management Ppt PowerPoint Presentation Pictures File Formats
This is a financial management ppt powerpoint presentation pictures file formats. This is a two stage process. The stages in this process are business, finance, analysis, investment, marketing.
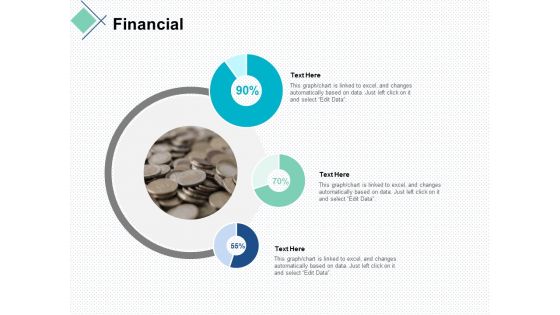
financial marketing business ppt powerpoint presentation pictures topics
This is a financial marketing business ppt powerpoint presentation pictures topics. This is a three stage process. The stages in this process are finance, marketing, management, investment, analysis.
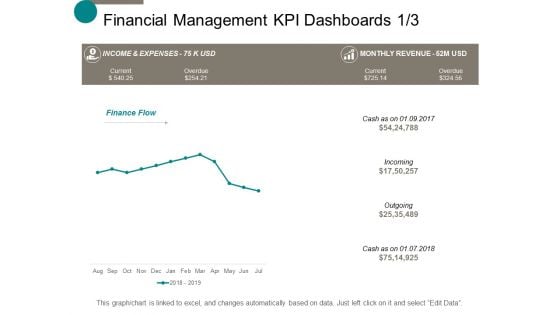
Financial Management Kpi Dashboards Business Ppt Powerpoint Presentation Show Gridlines
This is a financial management kpi dashboards business ppt powerpoint presentation show gridlines. This is a four stage process. The stages in this process are finance, marketing, management, investment, analysis.
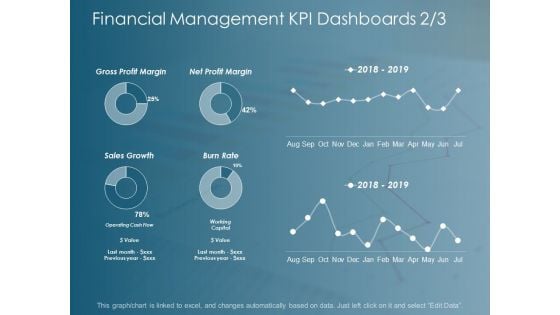
Financial Management Kpi Dashboards Business Ppt Powerpoint Presentation Inspiration Designs
This is a financial management kpi dashboards business ppt powerpoint presentation inspiration designs. This is a six stage process. The stages in this process are finance, marketing, management, investment, analysis.
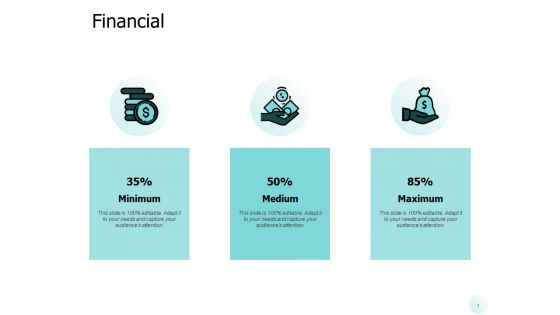
Financial Minimum Maximum Ppt PowerPoint Presentation Inspiration Pictures
Presenting this set of slides with name financial minimum maximum ppt powerpoint presentation inspiration pictures. This is a three stage process. The stages in this process are financial, minimum, maximum, marketing, strategy. This is a completely editable PowerPoint presentation and is available for immediate download. Download now and impress your audience.

Managing Construction Work Our Financial Ppt Show Pictures PDF
Presenting managing construction work our financial ppt show pictures pdf to provide visual cues and insights. Share and navigate important information on four stages that need your due attention. This template can be used to pitch topics like financial. In addtion, this PPT design contains high-resolution images, graphics, etc, that are easily editable and available for immediate download.

Financial Highlights Template 1 Ppt PowerPoint Presentation Gallery Templates
This is a financial highlights template 1 ppt powerpoint presentation gallery templates. This is a four stage process. The stages in this process are sales, operating expenses, operating income, net income.
Icon For Financial Analytics With Splunk Big Data Designs Pdf
Showcasing this set of slides titled Icon For Financial Analytics With Splunk Big Data Designs Pdf The topics addressed in these templates are Icon For Financial, Analytics With Splunk, Big Data All the content presented in this PPT design is completely editable. Download it and make adjustments in color, background, font etc. as per your unique business setting. Our Icon For Financial Analytics With Splunk Big Data Designs Pdf are topically designed to provide an attractive backdrop to any subject. Use them to look like a presentation pro.
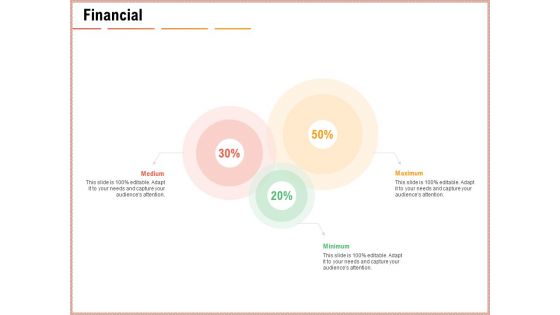
Net Promoter Score Dashboard Financial Ppt Styles Show PDF
Presenting net promoter score dashboard financial ppt styles show pdf to provide visual cues and insights. Share and navigate important information on three stages that need your due attention. This template can be used to pitch topics like financial, medium, minimum, maximum. In addtion, this PPT design contains high-resolution images, graphics, etc, that are easily editable and available for immediate download.
Investment Financial Bank Icon For Customer Needs Pictures Pdf
Pitch your topic with ease and precision using this Investment Financial Bank Icon For Customer Needs Pictures Pdf. This layout presents information on Investment Financial Bank Icon, Customer Needs. It is also available for immediate download and adjustment. So, changes can be made in the color, design, graphics or any other component to create a unique layout. Our Investment Financial Bank Icon For Customer Needs Pictures Pdf are topically designed to provide an attractive backdrop to any subject. Use them to look like a presentation pro.
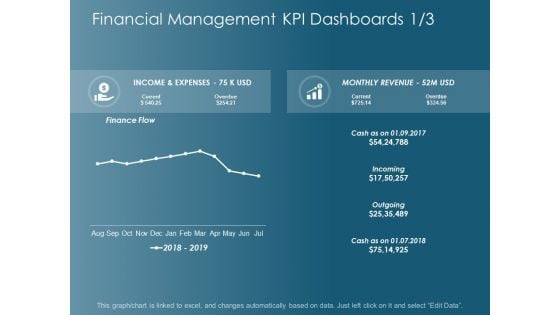
Financial Management Kpi Dashboards Marketing Ppt Powerpoint Presentation Inspiration Microsoft
This is a financial management kpi dashboards marketing ppt powerpoint presentation inspiration microsoft. This is a one stage process. The stages in this process are finance, marketing, management, investment, analysis.
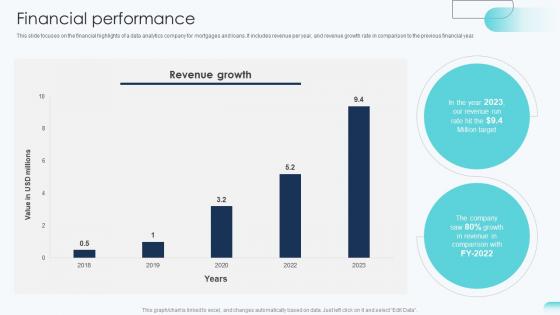
Financial Performance Big Data Analytics Investor Funding Elevator Pitch Deck
This slide focuses on the financial highlights of a data analytics company for mortgages and loans. It includes revenue per year, and revenue growth rate in comparison to the previous financial year. Present like a pro with Financial Performance Big Data Analytics Investor Funding Elevator Pitch Deck. Create beautiful presentations together with your team, using our easy-to-use presentation slides. Share your ideas in real-time and make changes on the fly by downloading our templates. So whether you are in the office, on the go, or in a remote location, you can stay in sync with your team and present your ideas with confidence. With Slidegeeks presentation got a whole lot easier. Grab these presentations today. This slide focuses on the financial highlights of a data analytics company for mortgages and loans. It includes revenue per year, and revenue growth rate in comparison to the previous financial year.
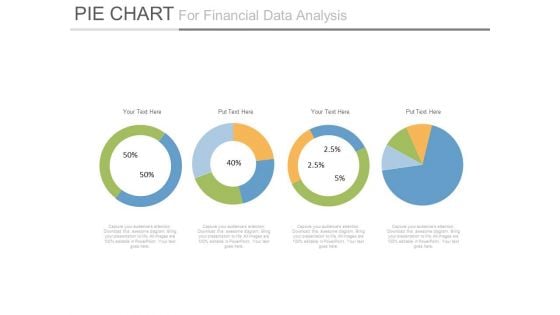
Pie Charts For Financial Ratio Analysis Powerpoint Slides
This PowerPoint template has been designed with diagram of pie charts. This PPT slide can be used to prepare presentations for profit growth report and also for financial data analysis. You can download finance PowerPoint template to prepare awesome presentations.
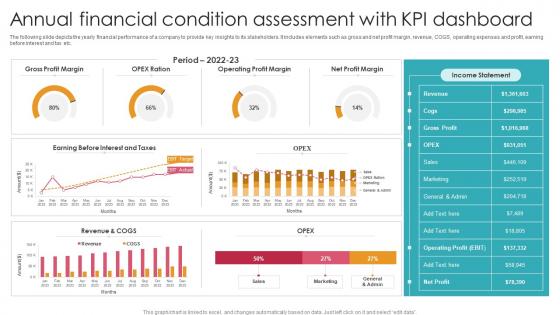
Annual Financial Condition Assessment With KPI Dashboard Ideas Pdf
The following slide depicts the yearly financial performance of a company to provide key insights to its stakeholders. It includes elements such as gross and net profit margin, revenue, COGS, operating expenses and profit, earning before interest and tax etc. Showcasing this set of slides titled Annual Financial Condition Assessment With KPI Dashboard Ideas Pdf. The topics addressed in these templates are Gross Profit Margin, Operating Profit Margin, Net Profit Margin. All the content presented in this PPT design is completely editable. Download it and make adjustments in color, background, font etc. as per your unique business setting. The following slide depicts the yearly financial performance of a company to provide key insights to its stakeholders. It includes elements such as gross and net profit margin, revenue, COGS, operating expenses and profit, earning before interest and tax etc.
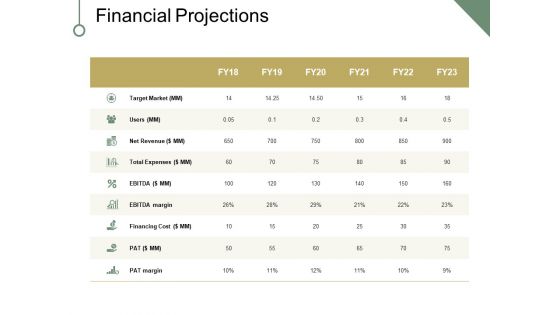
Financial Projections Ppt PowerPoint Presentation Pictures Graphic Images
This is a financial projections ppt powerpoint presentation pictures graphic images. This is a three stage process. The stages in this process are minimum, medium, maximum, business, marketing.
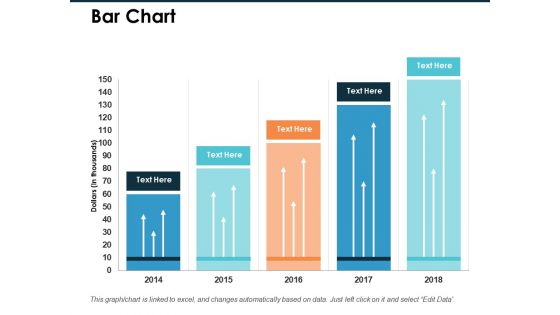
Bar Chart Financial Ppt PowerPoint Presentation Pictures Files
This is a bar chart financial ppt powerpoint presentation pictures files. This is a five stage process. The stages in this process are finance, marketing, management, investment, analysis.

Financial Investment Analysis Ppt PowerPoint Presentation Pictures Deck
This is a financial investment analysis ppt powerpoint presentation pictures deck. This is a two stage process. The stages in this process are finance, marketing, management, investment, analysis.


 Continue with Email

 Home
Home


