Financial Snapshot
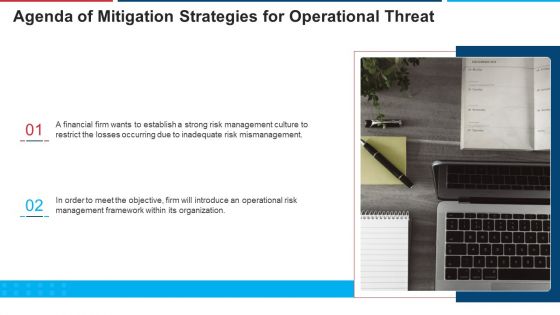
Agenda Of Mitigation Strategies For Operational Threat Ppt Pictures Display PDF
This is a agenda of mitigation strategies for operational threat ppt pictures display pdf template with various stages. Focus and dispense information on two stages using this creative set, that comes with editable features. It contains large content boxes to add your information on topics like management, financial, organization, framework, operational risk. You can also showcase facts, figures, and other relevant content using this PPT layout. Grab it now.
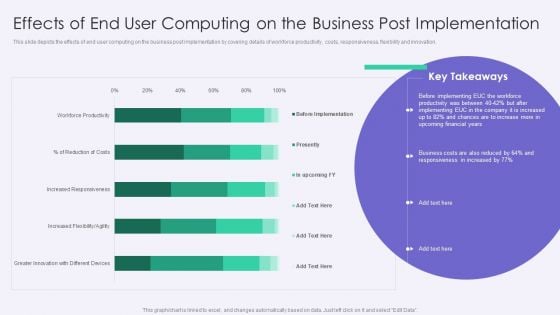
VID Effects Of End User Computing On The Business Post Implementation Pictures PDF
This slide depicts the effects of end user computing on the business post implementation by covering details of workforce productivity, costs, responsiveness, flexibility and innovation.Deliver and pitch your topic in the best possible manner with this VID Effects Of End User Computing On The Business Post Implementation Pictures PDF. Use them to share invaluable insights on Productivity Between, Upcoming Financial, Responsiveness Increased and impress your audience. This template can be altered and modified as per your expectations. So, grab it now.
KPIs And Metrics To Measure Pharmaceutical Drug Of Pharmaceutical Company Icons PDF
Mentioned slide showcases various key performance indicators KPIs which can be used to measure the development of pharmaceutical companies in different years. The key metrics are productivity, competency, quality of care and financial. Showcasing this set of slides titled KPIs And Metrics To Measure Pharmaceutical Drug Of Pharmaceutical Company Icons PDF. The topics addressed in these templates are Productivity, Competency, Quality Of Care. All the content presented in this PPT design is completely editable. Download it and make adjustments in color, background, font etc. as per your unique business setting.
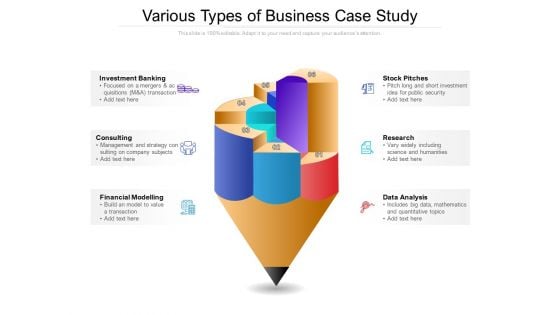
Various Types Of Business Case Study Ppt PowerPoint Presentation Gallery Backgrounds PDF
Persuade your audience using this various types of business case study ppt powerpoint presentation gallery backgrounds pdf. This PPT design covers six stages, thus making it a great tool to use. It also caters to a variety of topics including consulting, financial, data analysis. Download this PPT design now to present a convincing pitch that not only emphasizes the topic but also showcases your presentation skills.
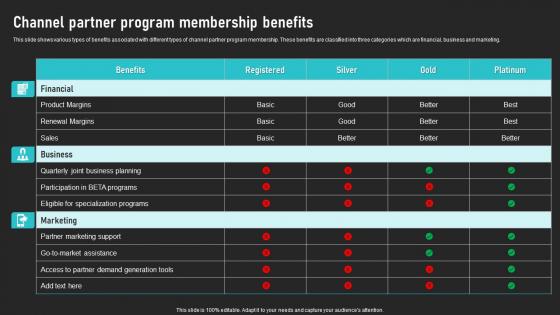
Channel Partner Program Membership Benefits Cooperative Sales Tactics Guidelines Pdf
This slide shows various types of benefits associated with different types of channel partner program membership. These benefits are classified into three categories which are financial, business and marketing. This modern and well-arranged Channel Partner Program Membership Benefits Cooperative Sales Tactics Guidelines Pdf provides lots of creative possibilities. It is very simple to customize and edit with the Powerpoint Software. Just drag and drop your pictures into the shapes. All facets of this template can be edited with Powerpoint no extra software is necessary. Add your own material, put your images in the places assigned for them, adjust the colors, and then you can show your slides to the world, with an animated slide included. This slide shows various types of benefits associated with different types of channel partner program membership. These benefits are classified into three categories which are financial, business and marketing.
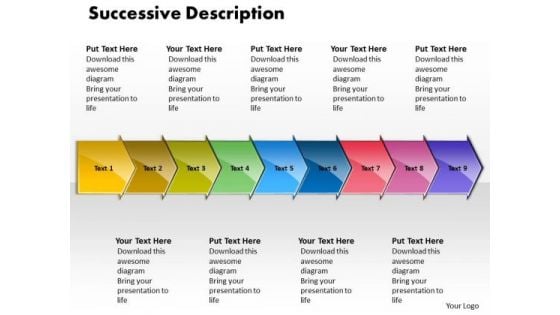
Ppt Successive Description 9 Circular Arrows PowerPoint 2010 Templates
PPT successive description 9 circular arrows powerpoint 2010 Templates-Highlight the key point in business process with these curved arrows of Nine stages diagram. It signifies appearance, attitude, bearing, condition, countenance, look, manner, mien etc.-PPT successive description 9 circular arrows powerpoint 2010 Templates-Arrow, Background, Process, Business, Chart, Diagram, Financial, Graphic, Gray, Icon, Illustration, Management, Orange, Perspective, Planning Process, Stages, Steps, Text Tackle the issue in it's entirety. Put up the overall picture with our Ppt Successive Description 9 Circular Arrows PowerPoint 2010 Templates.
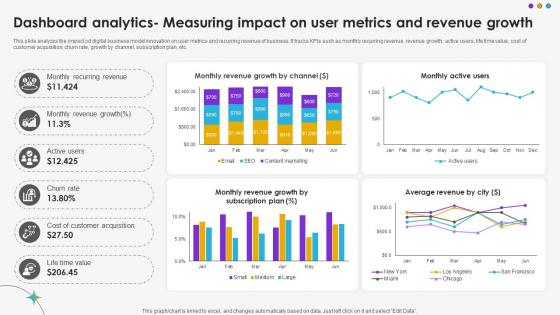
Dashboard Analytics Measuring Impact On User Metrics And Revenue Growth DT SS V
This slide analyzes the impact od digital business model innovation on user metrics and recurring revenue of business. It tracks KPIs such as monthly recurring revenue, revenue growth, active users, life time value, cost of customer acquisition, churn rate, growth by channel, subscription plan, etc.Are you searching for a Dashboard Analytics Measuring Impact On User Metrics And Revenue Growth DT SS V that is uncluttered, straightforward, and original Its easy to edit, and you can change the colors to suit your personal or business branding. For a presentation that expresses how much effort you have put in, this template is ideal With all of its features, including tables, diagrams, statistics, and lists, its perfect for a business plan presentation. Make your ideas more appealing with these professional slides. Download Dashboard Analytics Measuring Impact On User Metrics And Revenue Growth DT SS V from Slidegeeks today. This slide analyzes the impact od digital business model innovation on user metrics and recurring revenue of business. It tracks KPIs such as monthly recurring revenue, revenue growth, active users, life time value, cost of customer acquisition, churn rate, growth by channel, subscription plan, etc.
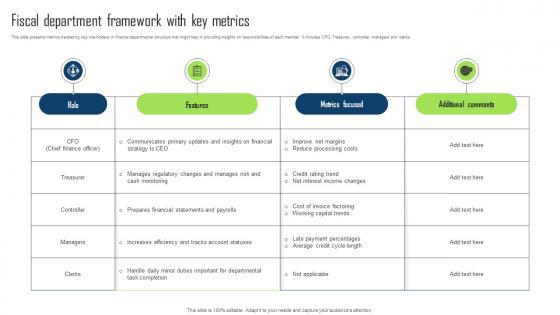
Fiscal Department Framework With Key Metrics Rules Pdf
This slide presents metrics tracked by key role holders in finance departmental structure that might help in providing insights on responsibilities of each member. It includes CFO, Treasurer, controller, managers and clerks. Showcasing this set of slides titled Fiscal Department Framework With Key Metrics Rules Pdf. The topics addressed in these templates are Fiscal Department, Framework With Key Metrics, Insights On Responsibilities. All the content presented in this PPT design is completely editable. Download it and make adjustments in color, background, font etc. as per your unique business setting. This slide presents metrics tracked by key role holders in finance departmental structure that might help in providing insights on responsibilities of each member. It includes CFO, Treasurer, controller, managers and clerks.
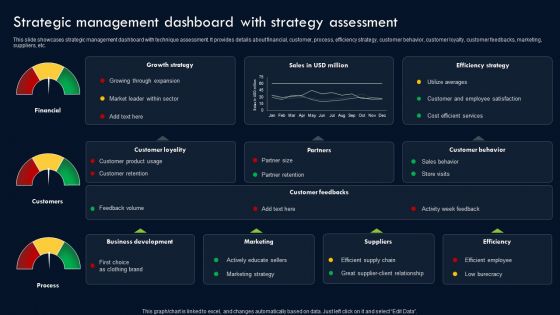
Transforming Sustainability Into Competitive Strategic Management Dashboard With Strategy Assessment Summary PDF
This slide showcases strategic management dashboard with technique assessment. It provides details about financial, customer, process, efficiency strategy, customer behavior, customer loyalty, customer feedbacks, marketing, suppliers, etc. From laying roadmaps to briefing everything in detail, our templates are perfect for you. You can set the stage with your presentation slides. All you have to do is download these easy-to-edit and customizable templates. Transforming Sustainability Into Competitive Strategic Management Dashboard With Strategy Assessment Summary PDF will help you deliver an outstanding performance that everyone would remember and praise you for. Do download this presentation today.
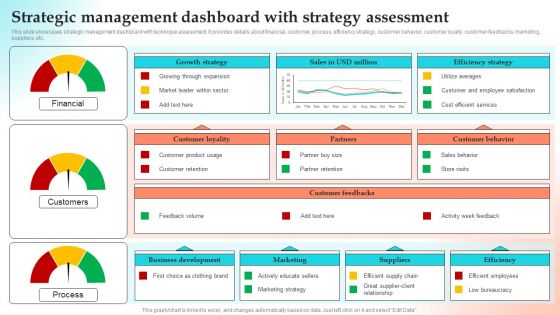
Implementing Strategies To Gain Competitive Advantage Strategic Management Dashboard With Strategy Assessment Inspiration PDF
This slide showcases strategic management dashboard with technique assessment. It provides details about financial, customer, process, efficiency strategy, customer behavior, customer loyalty, customer feedbacks, marketing, suppliers, etc. From laying roadmaps to briefing everything in detail, our templates are perfect for you. You can set the stage with your presentation slides. All you have to do is download these easy to edit and customizable templates. Implementing Strategies To Gain Competitive Advantage Strategic Management Dashboard With Strategy Assessment Inspiration PDF will help you deliver an outstanding performance that everyone would remember and praise you for. Do download this presentation today.
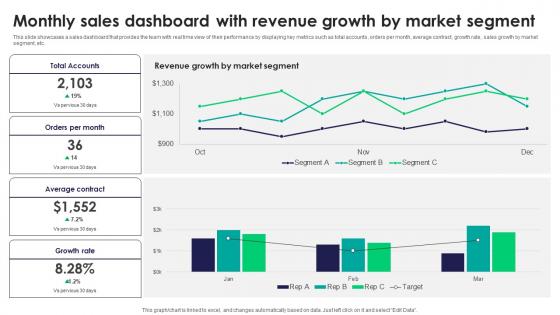
Monthly Sales Dashboard With Revenue Growth By Tactics For Improving Field Sales Team SA SS V
This slide showcases a sales dashboard that provides the team with real time view of their performance by displaying key metrics such as total accounts, orders per month, average contract, growth rate, sales growth by market segment, etc. The Monthly Sales Dashboard With Revenue Growth By Tactics For Improving Field Sales Team SA SS V is a compilation of the most recent design trends as a series of slides. It is suitable for any subject or industry presentation, containing attractive visuals and photo spots for businesses to clearly express their messages. This template contains a variety of slides for the user to input data, such as structures to contrast two elements, bullet points, and slides for written information. Slidegeeks is prepared to create an impression. This slide showcases a sales dashboard that provides the team with real time view of their performance by displaying key metrics such as total accounts, orders per month, average contract, growth rate, sales growth by market segment, etc.

Monthly Sales Dashboard With Revenue Efficient Sales Territory Management To Build SA SS V
This slide showcases a sales dashboard that provides the team with real time view of their performance by displaying key metrics such as total accounts, orders per month, average contract, growth rate, sales growth by market segment, etc. The Monthly Sales Dashboard With Revenue Efficient Sales Territory Management To Build SA SS V is a compilation of the most recent design trends as a series of slides. It is suitable for any subject or industry presentation, containing attractive visuals and photo spots for businesses to clearly express their messages. This template contains a variety of slides for the user to input data, such as structures to contrast two elements, bullet points, and slides for written information. Slidegeeks is prepared to create an impression. This slide showcases a sales dashboard that provides the team with real time view of their performance by displaying key metrics such as total accounts, orders per month, average contract, growth rate, sales growth by market segment, etc.
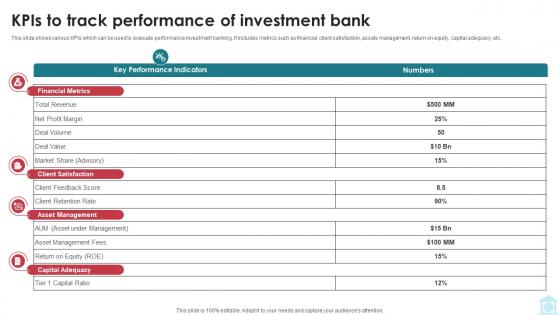
Kpis To Track Performance Of Investment Bank Mastering Investment Banking Fin SS V
This slide shows various KPIs which can be used to evaluate performance investment banking. It includes metrics such as financial, client satisfaction, assets management, return on equity, capital adequacy, etc. Here you can discover an assortment of the finest PowerPoint and Google Slides templates. With these templates, you can create presentations for a variety of purposes while simultaneously providing your audience with an eye-catching visual experience. Download Kpis To Track Performance Of Investment Bank Mastering Investment Banking Fin SS V to deliver an impeccable presentation. These templates will make your job of preparing presentations much quicker, yet still, maintain a high level of quality. Slidegeeks has experienced researchers who prepare these templates and write high-quality content for you. Later on, you can personalize the content by editing the Kpis To Track Performance Of Investment Bank Mastering Investment Banking Fin SS V This slide shows various KPIs which can be used to evaluate performance investment banking. It includes metrics such as financial, client satisfaction, assets management, return on equity, capital adequacy, etc.

KPIs To Track Performance Of Investment Bank Understanding Investment Banking Framework Fin SS V
This slide shows various KPIs which can be used to evaluate performance investment banking. It includes metrics such as financial, client satisfaction, assets management, return on equity, capital adequacy, etc. Here you can discover an assortment of the finest PowerPoint and Google Slides templates. With these templates, you can create presentations for a variety of purposes while simultaneously providing your audience with an eye-catching visual experience. Download KPIs To Track Performance Of Investment Bank Understanding Investment Banking Framework Fin SS V to deliver an impeccable presentation. These templates will make your job of preparing presentations much quicker, yet still, maintain a high level of quality. Slidegeeks has experienced researchers who prepare these templates and write high-quality content for you. Later on, you can personalize the content by editing the KPIs To Track Performance Of Investment Bank Understanding Investment Banking Framework Fin SS V. This slide shows various KPIs which can be used to evaluate performance investment banking. It includes metrics such as financial, client satisfaction, assets management, return on equity, capital adequacy, etc.
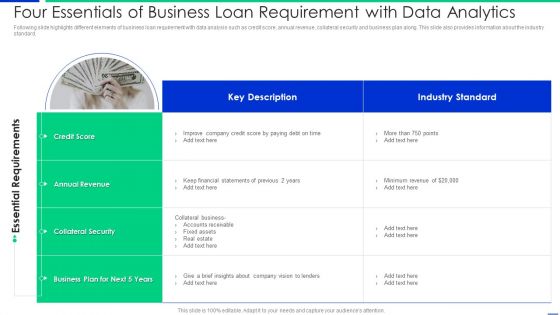
Four Essentials Of Business Loan Requirement With Data Analytics Information PDF
Following slide highlights different elements of business loan requirement with data analysis such as credit score, annual revenue, collateral security and business plan along. This slide also provides information about the industry standard Showcasing this set of slides titled four essentials of business loan requirement with data analytics information pdf. The topics addressed in these templates are financial, collateral security, annual revenue. All the content presented in this PPT design is completely editable. Download it and make adjustments in color, background, font etc. as per your unique business setting.
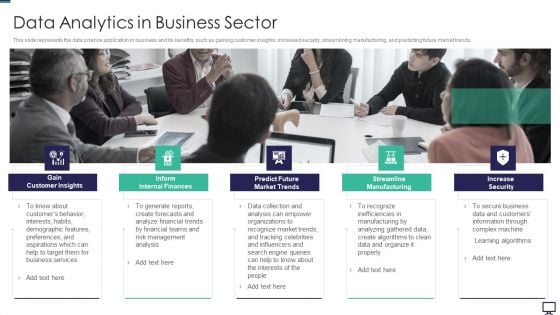
Data Analytics In Business Sector Ppt Show Smartart PDF
This slide represents the data science application in business and its benefits, such as gaining customer insights, increased security, streamlining manufacturing, and predicting future market trends. This is a data analytics in business sector ppt show smartart pdf template with various stages. Focus and dispense information on five stages using this creative set, that comes with editable features. It contains large content boxes to add your information on topics like demographic, target, business services, management, financial. You can also showcase facts, figures, and other relevant content using this PPT layout. Grab it now.
Advanced Human Resource Value Chain With Kpis Icons PDF
This slide shows advanced HR value chain with KPIs to demonstrate its role in achieving goals. It includes aspects such as HR enablers, activities, outcomes, strategic focus , and KPI for financial, process and customer. Showcasing this set of slides titled Advanced Human Resource Value Chain With Kpis Icons PDF. The topics addressed in these templates are Strategic Focus, Process Kpis, Customer Kpis. All the content presented in this PPT design is completely editable. Download it and make adjustments in color, background, font etc. as per your unique business setting.
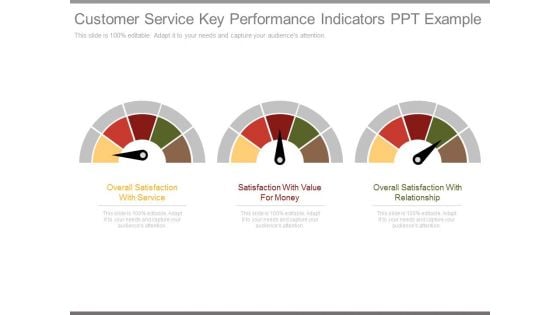
Customer Service Key Performance Indicators Ppt Example
This is a customer service key performance indicators ppt example. This is a three stage process. The stages in this process are overall satisfaction with service, satisfaction with value for money, overall satisfaction with relationship.
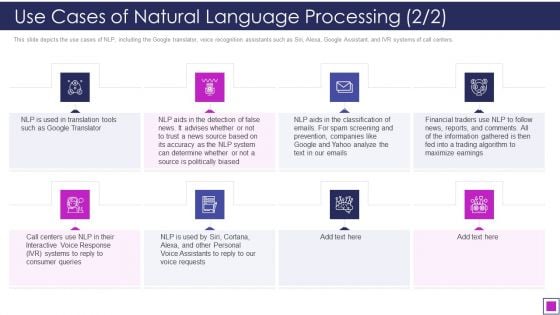
Use Cases Of Natural Language Processing Emails Ppt Portfolio Graphics Pictures PDF
This slide depicts the use cases of NLP, including the Google translator, voice recognition assistants such as Siri, Alexa, Google Assistant, and IVR systems of call centers. This is a use cases of natural language processing emails ppt portfolio graphics pictures pdf template with various stages. Focus and dispense information on eight stages using this creative set, that comes with editable features. It contains large content boxes to add your information on topics like source, system, analyze, information, financial. You can also showcase facts, figures, and other relevant content using this PPT layout. Grab it now.
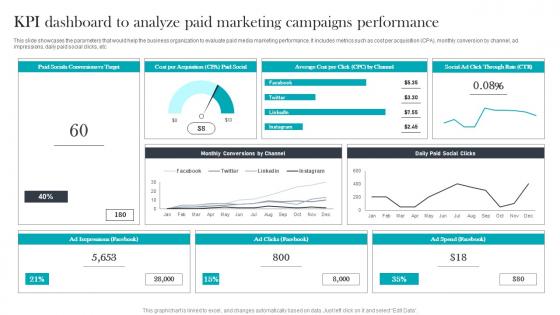
KPI Dashboard To Analyze Paid Media Advertising For Optimizing Customer Brochure Pdf
This slide showcases the parameters that would help the business organization to evaluate paid media marketing performance. It includes metrics such as cost per acquisition CPA, monthly conversion by channel, ad impressions, daily paid social clicks, etc Make sure to capture your audiences attention in your business displays with our gratis customizable KPI Dashboard To Analyze Paid Media Advertising For Optimizing Customer Brochure Pdf. These are great for business strategies, office conferences, capital raising or task suggestions. If you desire to acquire more customers for your tech business and ensure they stay satisfied, create your own sales presentation with these plain slides. This slide showcases the parameters that would help the business organization to evaluate paid media marketing performance. It includes metrics such as cost per acquisition CPA, monthly conversion by channel, ad impressions, daily paid social clicks, etc
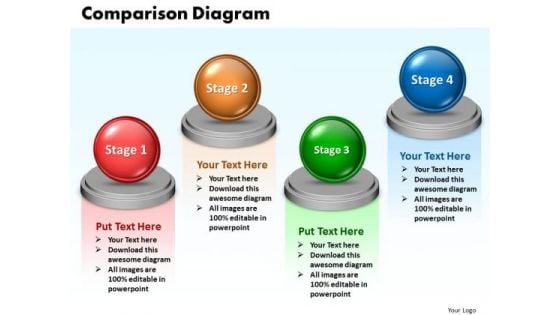
Ppt Comparison Network Diagram PowerPoint Template 4 Phase Templates
PPT comparison network diagram powerpoint template 4 phase Templates-This PowerPoint diagram slide shows four opposing views. You can use the This PowerPoint diagram slide to represent views from different functions on an issue.-PPT comparison network diagram powerpoint template 4 phase Templates-Abstract, Achievement, Business, Chart, Comparison, Concepts, Data, Descriptive, Design, Development, Diagram, Element, Figure, Finance, Financial, Graph, Graphic, Growth, Icon, Ideas, Improvement, Investment, Market, Money, Progress, Raise, Real, Report, Revenue, Sale, Shape, Sign, Silhouette, Stock, Success, Symbol, Technology Reveal the depth of your knowledge. Showcase your erudition on our Ppt Comparison Network Diagram PowerPoint Template 4 Phase Templates.
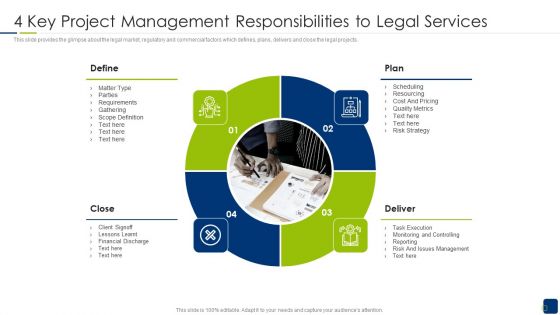
4 Key Project Management Responsibilities To Legal Services Structure PDF
This slide provides the glimpse about the legal market, regulatory and commercial factors which defines, plans, delivers and close the legal projects. This is a 4 key project management responsibilities to legal services structure pdf template with various stages. Focus and dispense information on four stages using this creative set, that comes with editable features. It contains large content boxes to add your information on topics like requirements, financial, risk, management, metrics. You can also showcase facts, figures, and other relevant content using this PPT layout. Grab it now.
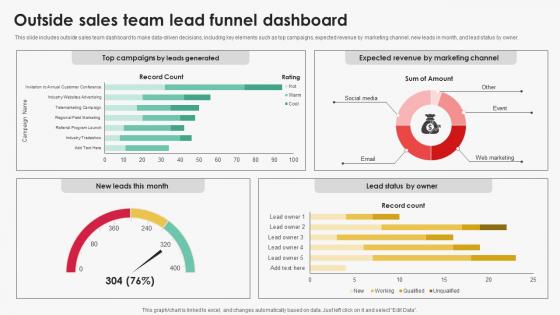
Outside Sales Team Lead Funnel Dashboard Efficient Sales Territory Management To Build SA SS V
This slide includes outside sales team dashboard to make data-driven decisions, including key elements such as top campaigns, expected revenue by marketing channel, new leads in month, and lead status by owner. Retrieve professionally designed Outside Sales Team Lead Funnel Dashboard Efficient Sales Territory Management To Build SA SS V to effectively convey your message and captivate your listeners. Save time by selecting pre-made slideshows that are appropriate for various topics, from business to educational purposes. These themes come in many different styles, from creative to corporate, and all of them are easily adjustable and can be edited quickly. Access them as PowerPoint templates or as Google Slides themes. You do not have to go on a hunt for the perfect presentation because Slidegeeks got you covered from everywhere. This slide includes outside sales team dashboard to make data-driven decisions, including key elements such as top campaigns, expected revenue by marketing channel, new leads in month, and lead status by owner.
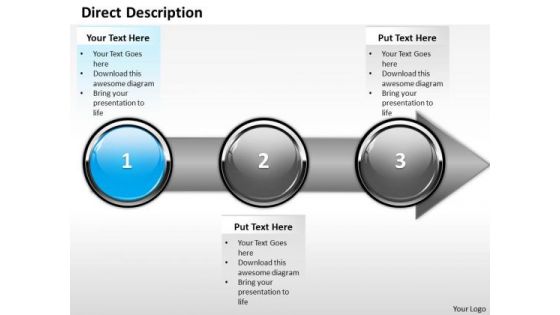
Ppt Consecutive Demonstration Of Arrow Process Using Stage 1 PowerPoint Templates
PPT consecutive demonstration of arrow process using stage 1 PowerPoint Templates-With this pre-designed process arrows diagram you can visualize almost any type of concept, chronological process or steps of your strategies.-PPT consecutive demonstration of arrow process using stage 1 PowerPoint Templates-Arrow, Bank, Benefit, Business, Calculate, Calculation, Capitalist, Communication, Company, Concern, Connection, Data, Diagram, Digital, Drawing, Earnings, Economic, Finance, Financial, Flow, Forecast, Gain, Goal, Graph, Growth, Illustration, Increase, Information, Interest, Investing, Management, Market, Money, Move, Network, Objective, Plan, Process, Profit, Progress, Report, Rise, Risk, Shares, Statistics, Stock, System, Technology Keep them enthused with our Ppt Consecutive Demonstration Of Arrow Process Using Stage 1 PowerPoint Templates. You will come out on top.
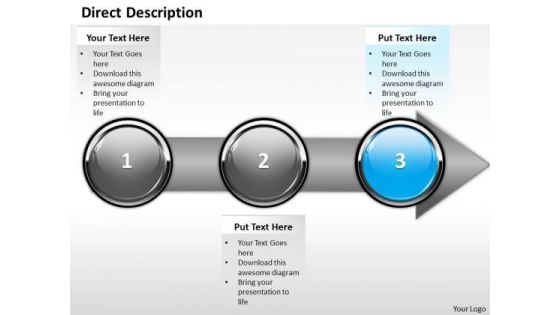
Ppt Direct Description Of Arrow Process Using Stage 3 PowerPoint Templates
PPT direct description of arrow process using stage 3 PowerPoint Templates-With this pre-designed process arrows diagram you can visualize almost any type of concept, chronological process or steps of your strategies.-PPT direct description of arrow process using stage 3 PowerPoint Templates-Arrow, Bank, Benefit, Business, Calculate, Calculation, Capitalist, Communication, Company, Concern, Connection, Data, Diagram, Digital, Drawing, Earnings, Economic, Finance, Financial, Flow, Forecast, Gain, Goal, Graph, Growth, Illustration, Increase, Information, Interest, Investing, Management, Market, Money, Move, Network, Objective, Plan, Process, Profit, Progress, Report, Rise, Risk, Shares, Statistics, Stock, System, Technology Our Ppt Direct Description Of Arrow Process Using Stage 3 PowerPoint Templates will soon be your favourites. They will delight you with their charm.
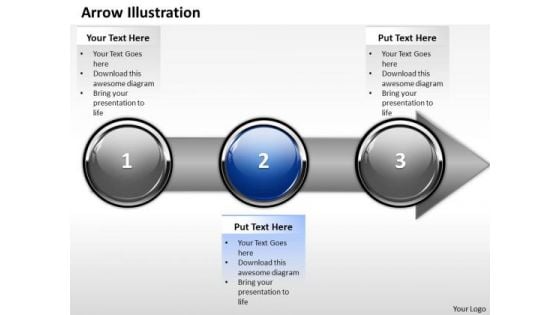
Ppt Direct Illustration Of Banking Process Using Stage 2 PowerPoint Templates
PPT direct illustration of banking process using stage 2 PowerPoint Templates-With this pre-designed process arrows diagram you can visualize almost any type of concept, chronological process or steps of your strategies.-PPT direct illustration of banking process using stage 2 PowerPoint Templates-Arrow, Bank, Benefit, Business, Calculate, Calculation, Capitalist, Communication, Company, Concern, Connection, Data, Diagram, Digital, Drawing, Earnings, Economic, Finance, Financial, Flow, Forecast, Gain, Goal, Graph, Growth, Illustration, Increase, Information, Interest, Investing, Management, Market, Money, Move, Network, Objective, Plan, Process, Profit, Progress, Report, Rise, Risk, Shares, Statistics, Stock, System, Technology Our Ppt Direct Illustration Of Banking Process Using Stage 2 PowerPoint Templates have a glossy look. Your thoughts will also acquire a sheen.
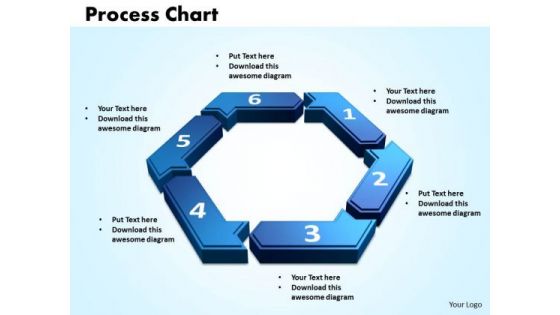
PowerPoint Designs Process Chart Strategy Ppt Slide
PowerPoint Designs process Chart Strategy PPT Slide-This Process Chart can be used as data flow diagram to show the flow of the data as it moves from beginning process to end result.-3d, arrow, art, business, chart, circle, concept, connection, cycle, development, diagram, direction, element, environment, finance, financial, flow, graphic, group, investment, isolated, market,, movement, organization, passive income, perspective, presentation, process chart, recycle, report, sign, step, success, symbol, teamwork-PowerPoint Designs process Chart Strategy PPT Slide Our PowerPoint Designs Process Chart Strategy Ppt Slide have a glossy look. Your thoughts will also acquire a sheen.
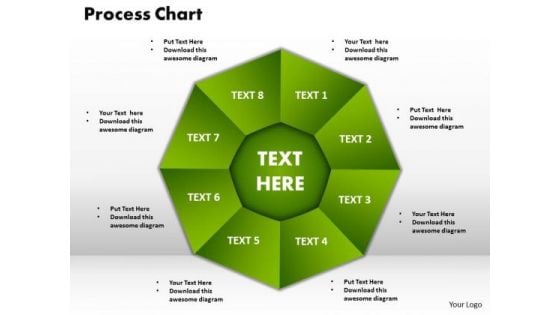
PowerPoint Slide Designs Process Chart Company Ppt Slides
PowerPoint Slide Designs process chart Company PPT Slides-This Process Chart can be used as data flow diagram to show the flow of the data as it moves from beginning process to end result.-3d, art, business, chart, circle, concept, connection, cycle, development, diagram, direction, element, environment, finance, financial, flow, graphic, group, investment, isolated, market,, movement, organization, passive income, perspective, presentation, process chart, recycle, report, sign, step, success, symbol, teamwork-PowerPoint Slide Designs process chart Company PPT Slides Excite emotions with our PowerPoint Slide Designs Process Chart Company Ppt Slides. Give them a real feel for your thoughts.
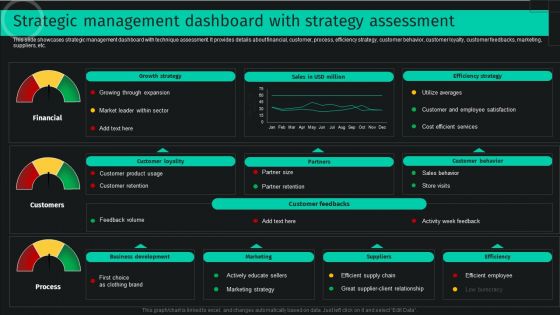
Strategic Management Dashboard With Strategy Assessment Sample PDF
This slide showcases strategic management dashboard with technique assessment. It provides details about financial, customer, process, efficiency strategy, customer behavior, customer loyalty, customer feedbacks, marketing, suppliers, etc. Do you have to make sure that everyone on your team knows about any specific topic I yes, then you should give Strategic Management Dashboard With Strategy Assessment Sample PDF a try. Our experts have put a lot of knowledge and effort into creating this impeccable Strategic Management Dashboard With Strategy Assessment Sample PDF. You can use this template for your upcoming presentations, as the slides are perfect to represent even the tiniest detail. You can download these templates from the Slidegeeks website and these are easy to edit. So grab these today.
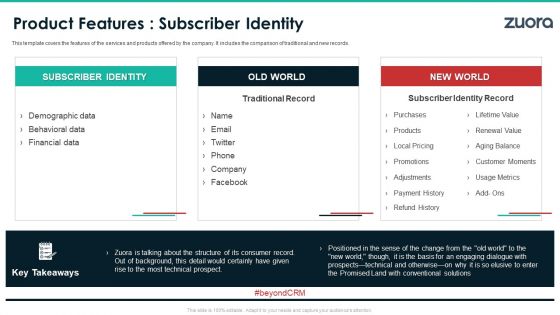
Zuora Capital Raising Elevator Product Features Subscriber Identity Pictures PDF
This template covers the features of the services and products offered by the company. It includes the comparison of traditional and new records. This is a zuora capital raising elevator product features subscriber identity pictures pdf template with various stages. Focus and dispense information on three stages using this creative set, that comes with editable features. It contains large content boxes to add your information on topics like technical, financial. You can also showcase facts, figures, and other relevant content using this PPT layout. Grab it now.
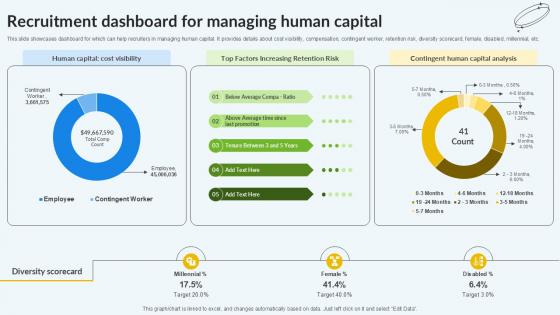
Recruitment Dashboard For Managing Human Capital PPT Example
This slide showcases dashboard for which can help recruiters in managing human capital. It provides details about cost visibility, compensation, contingent worker, retention risk, diversity scorecard, female, disabled, millennial, etc. The Recruitment Dashboard For Managing Human Capital PPT Example is a compilation of the most recent design trends as a series of slides. It is suitable for any subject or industry presentation, containing attractive visuals and photo spots for businesses to clearly express their messages. This template contains a variety of slides for the user to input data, such as structures to contrast two elements, bullet points, and slides for written information. Slidegeeks is prepared to create an impression. This slide showcases dashboard for which can help recruiters in managing human capital. It provides details about cost visibility, compensation, contingent worker, retention risk, diversity scorecard, female, disabled, millennial, etc.
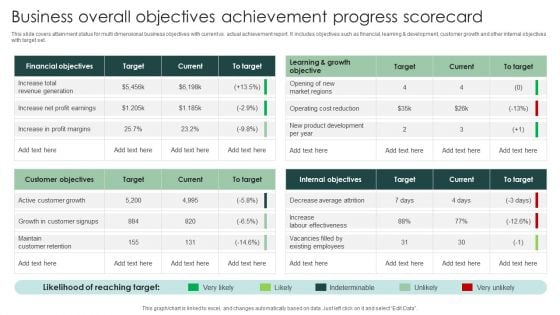
Business Overall Objectives Achievement Progress Scorecard Pictures PDF
This slide covers attainment status for multi dimensional business objectives with current vs. actual achievement report. It includes objectives such as financial, learning development, customer growth and other internal objectives with target set.Showcasing this set of slides titled Business Overall Objectives Achievement Progress Scorecard Pictures PDF. The topics addressed in these templates are Revenue Generation, Customer Retention, Existing Employees. All the content presented in this PPT design is completely editable. Download it and make adjustments in color, background, font etc. as per your unique business setting.
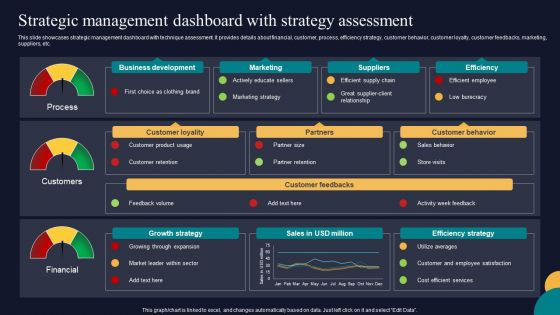
Strategic Management Dashboard With Strategy Assessment Tactics To Gain Sustainable Competitive Edge Pictures PDF
This slide showcases strategic management dashboard with technique assessment. It provides details about financial, customer, process, efficiency strategy, customer behavior, customer loyalty, customer feedbacks, marketing, suppliers, etc. Formulating a presentation can take up a lot of effort and time, so the content and message should always be the primary focus. The visuals of the PowerPoint can enhance the presenters message, so our Strategic Management Dashboard With Strategy Assessment Tactics To Gain Sustainable Competitive Edge Pictures PDF was created to help save time. Instead of worrying about the design, the presenter can concentrate on the message while our designers work on creating the ideal templates for whatever situation is needed. Slidegeeks has experts for everything from amazing designs to valuable content, we have put everything into Strategic Management Dashboard With Strategy Assessment Tactics To Gain Sustainable Competitive Edge Pictures PDF.
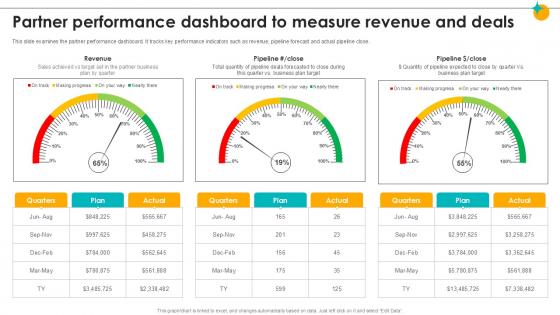
Partner Performance Dashboard To Measure Revenue Partner Relationship Ppt Template
This slide examines the partner performance dashboard. It tracks key performance indicators such as revenue, pipeline forecast and actual pipeline close. Are you in need of a template that can accommodate all of your creative concepts This one is crafted professionally and can be altered to fit any style. Use it with Google Slides or PowerPoint. Include striking photographs, symbols, depictions, and other visuals. Fill, move around, or remove text boxes as desired. Test out color palettes and font mixtures. Edit and save your work, or work with colleagues. Download Partner Performance Dashboard To Measure Revenue Partner Relationship Ppt Template and observe how to make your presentation outstanding. Give an impeccable presentation to your group and make your presentation unforgettable. This slide examines the partner performance dashboard. It tracks key performance indicators such as revenue, pipeline forecast and actual pipeline close.
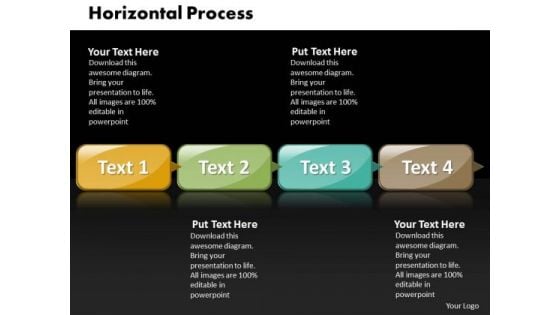
Ppt Horizontal Picture Style PowerPoint 2010 4 Phase Diagram Templates
PPT horizontal picture style powerpoint 2010 4 phase diagram Templates-Display the direction of the specific activities involved and how to put these in a proper manner for achieving the desired goal.-PPT horizontal picture style powerpoint 2010 4 phase diagram Templates-Banner, Box, Business, Button, Chrome, Collection, Control, Design, Direction, Element, Empty, Financial, Flow, Graph, Green, Header, Horizontal, Style, Illustration, Image, Information, Process, Red, Retail, Round, Sale, Set, Shapes Fill in the blanks with our Ppt Horizontal Picture Style PowerPoint 2010 4 Phase Diagram Templates. Your thoughts will have a continuous flow.
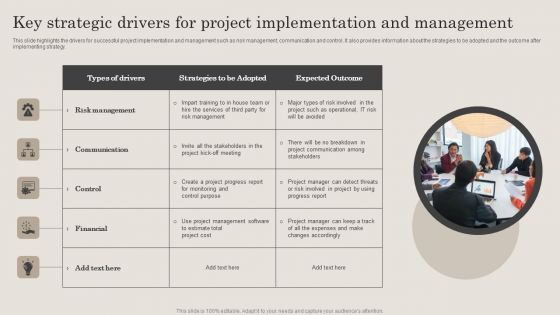
Key Strategic Drivers For Project Implementation And Management Pictures PDF
This slide highlights the drivers for successful project implementation and management such as risk management, communication and control. It also provides information about the strategies to be adopted and the outcome after implementing strategy. Presenting Key Strategic Drivers For Project Implementation And Management Pictures PDF to dispense important information. This template comprises five stages. It also presents valuable insights into the topics including Communication, Risk Management, Financial. This is a completely customizable PowerPoint theme that can be put to use immediately. So, download it and address the topic impactfully.
Major Standard Compliances For Online Security Pictures PDF
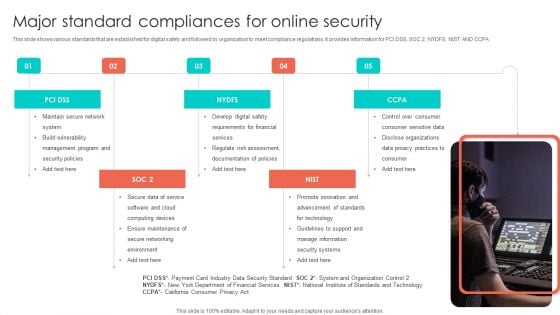
This slide shows various standards that are established for digital safety and followed by organization to meet compliance regulations. It provides information for PCI DSS, SOC 2, NYDFS, NIST AND CCPA. Persuade your audience using this Major Standard Compliances For Online Security Pictures PDF. This PPT design covers five stages, thus making it a great tool to use. It also caters to a variety of topics including Develop Digital Safety, Requirements For Financial, Regulate Risk Assessment. Download this PPT design now to present a convincing pitch that not only emphasizes the topic but also showcases your presentation skills.
Assessment Criteria Checklist For Inclusive Business Association Pictures PDF
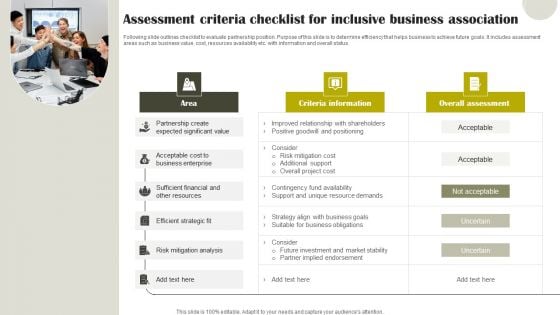
Following slide outlines checklist to evaluate partnership position. Purpose of this slide is to determine efficiency that helps business to achieve future goals. It includes assessment areas such as business value, cost, resources availability etc. with information and overall status. Presenting Assessment Criteria Checklist For Inclusive Business Association Pictures PDF to dispense important information. This template comprises three stages. It also presents valuable insights into the topics including Criteria Information, Risk Mitigation Analysis, Sufficient Financial. This is a completely customizable PowerPoint theme that can be put to use immediately. So, download it and address the topic impactfully.
Big Data Analytics Dashboard To Track Developing Strategic Insights Using Big Data Analytics SS V
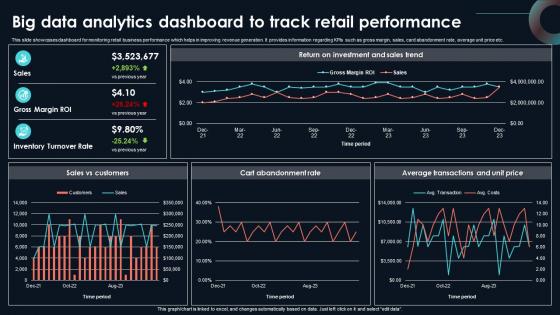
This slide showcases dashboard for monitoring retail business performance which helps in improving revenue generation. It provides information regarding KPIs such as gross margin, sales, card abandonment rate, average unit price etc. If your project calls for a presentation, then Slidegeeks is your go-to partner because we have professionally designed, easy-to-edit templates that are perfect for any presentation. After downloading, you can easily edit Big Data Analytics Dashboard To Track Developing Strategic Insights Using Big Data Analytics SS V and make the changes accordingly. You can rearrange slides or fill them with different images. Check out all the handy templates This slide showcases dashboard for monitoring retail business performance which helps in improving revenue generation. It provides information regarding KPIs such as gross margin, sales, card abandonment rate, average unit price etc.
Cash Market Investor Deck Exit Strategy For Secondary Market Investors Ppt Infographics Pictures PDF
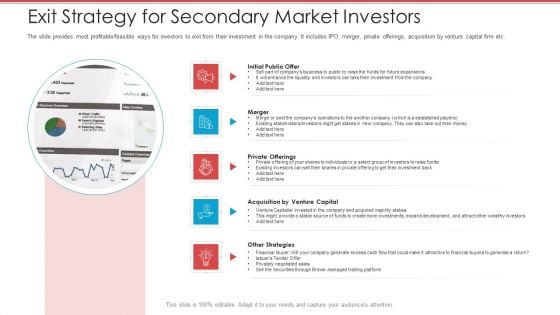
The slide provides most profitable feasible ways for investors to exit from their investment in the company. It includes IPO, merger, private offerings, acquisition by venture capital firm etc. This is a cash market investor deck exit strategy for secondary market investors ppt infographics pictures pdf template with various stages. Focus and dispense information on five stages using this creative set, that comes with editable features. It contains large content boxes to add your information on topics like existing investors, expand development, financial, strategies, privately negotiated sales. You can also showcase facts, figures, and other relevant content using this PPT layout. Grab it now.
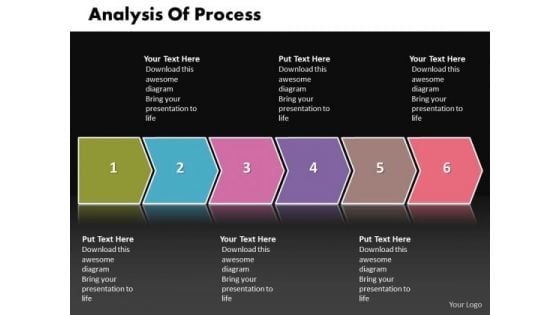
Ppt Step By Picture Of The Process For Analysis PowerPoint Templates
PPT step by picture of the process for analysis PowerPoint Templates-Use This Linearly Demonstrated PowerPoint Diagram having four steps displaying as a hexagonal boxes on the arrow pointing towards east direction. It signifies the completion of the procedure and attaining success.-PPT step by picture of the process for analysis PowerPoint Templates-3d, Arrow, Background, Banner, Business, Chart, Colorful, Diagram, Direction, Element, Financial, Flow, Gradient, Illustration, Isolated, Mirrored, Placeholder, Presentation, Process, Steps Far is no problem for our Ppt Step By Picture Of The Process For Analysis PowerPoint Templates. They will cover any distance with you.
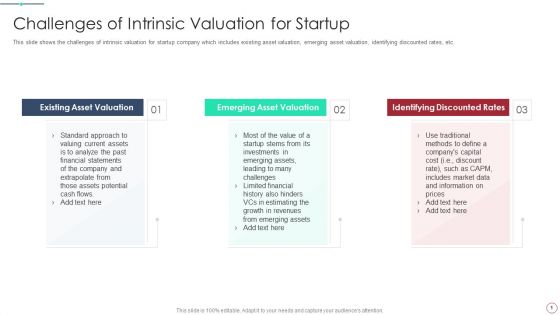
Initial Phase Investor Value For New Business Challenges Of Intrinsic Valuation For Startup Pictures PDF
This slide shows the challenges of intrinsic valuation for startup company which includes existing asset valuation, emerging asset valuation, identifying discounted rates, etc. This is a initial phase investor value for new business challenges of intrinsic valuation for startup pictures pdf template with various stages. Focus and dispense information on three stages using this creative set, that comes with editable features. It contains large content boxes to add your information on topics like valuation, standard, approach, statements, financial. You can also showcase facts, figures, and other relevant content using this PPT layout. Grab it now.
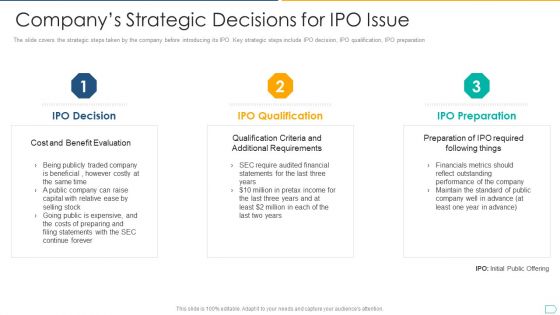
Pitchbook For IPO Deal Companys Strategic Decisions For IPO Issue Elements PDF
The slide covers the strategic steps taken by the company before introducing its IPO. Key strategic steps include IPO decision, IPO qualification, IPO preparation. This is a pitchbook for ipo deal companys strategic decisions for ipo issue elements pdf template with various stages. Focus and dispense information on three stages using this creative set, that comes with editable features. It contains large content boxes to add your information on topics like requirements, financial, costs, performance, metrics. You can also showcase facts, figures, and other relevant content using this PPT layout. Grab it now.
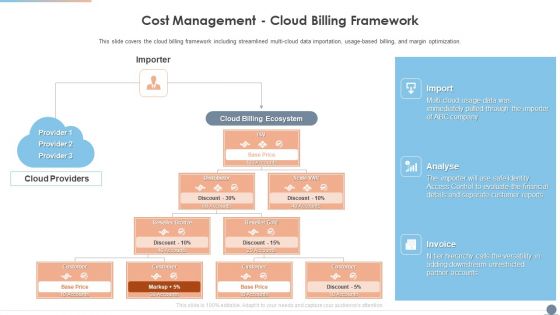
Multi Cloud Complexity Management Cost Management Cloud Billing Framework Rules PDF
This slide covers the cloud billing framework including streamlined multi cloud data importation, usage-based billing, and margin optimization. This is a Multi Cloud Complexity Management Cost Management Cloud Billing Framework Rules PDF template with various stages. Focus and dispense information on four stages using this creative set, that comes with editable features. It contains large content boxes to add your information on topics like Analyse, Evaluate, Financial. You can also showcase facts, figures, and other relevant content using this PPT layout. Grab it now.
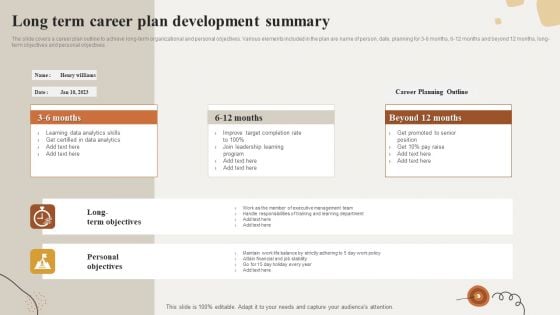
Long Term Career Plan Development Summary Diagrams PDF
The slide covers a career plan outline to achieve long-term organizational and personal objectives. Various elements included in the plan are name of person, date, planning for 3-6 months, 6-12 months and beyond 12 months, long-term objectives and personal objectives. Persuade your audience using this Long Term Career Plan Development Summary Diagrams PDF. This PPT design covers three stages, thus making it a great tool to use. It also caters to a variety of topics including Target, Data Analytics, Training, Financial. Download this PPT design now to present a convincing pitch that not only emphasizes the topic but also showcases your presentation skills.
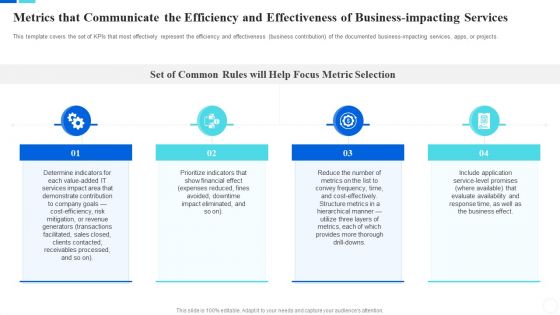
Communicate Company Value To Your Stakeholders Metrics That Communicate The Efficiency Download PDF
This template covers the set of KPIs that most effectively represent the efficiency and effectiveness business contribution of the documented business-impacting services, apps, or projects. This is a communicate company value to your stakeholders metrics that communicate the efficiency download pdf template with various stages. Focus and dispense information on four stages using this creative set, that comes with editable features. It contains large content boxes to add your information on topics like determine, services, financial, expenses, reduce. You can also showcase facts, figures, and other relevant content using this PPT layout. Grab it now.

IT Value Story Significant To Corporate Leadership Metrics That Communicate The Efficiency Background PDF
This template covers the set of KPIs that most effectively represent the efficiency and effectiveness business contribution of the documented business-impacting services, apps, or projects. Presenting it value story significant to corporate leadership metrics that communicate the efficiency background pdf to provide visual cues and insights. Share and navigate important information on four stages that need your due attention. This template can be used to pitch topics like determine, financial, expenses, metrics. In addtion, this PPT design contains high resolution images, graphics, etc, that are easily editable and available for immediate download.
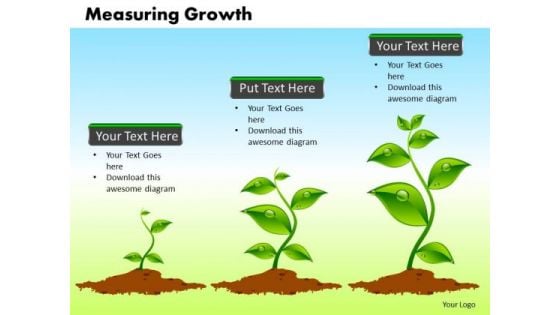
Business Process PowerPoint Templates Business Measuring Growth Ppt Slides
Business Process PowerPoint Templates Business Measuring Growth PPT Slides-This Diagram shows growing plants that is a conceptual representation for measuring growth -Business Process PowerPoint Templates Business Measuring Growth PPT Slides-This template can be used for presentations relating to Accounting, Accounts, Analysis, Business, Capital, Cash, Coins, Concept, Conceptual, Corporate, Data, Detail, Earnings, Evaluate, Finance, Financial, Gains, Golden, Green, Growing, Growth, Hand, Income, Increasing, Indicator, Measuring With our Business Process PowerPoint Templates Business Measuring Growth Ppt Slides there is no dearth of ideas. They crop up everywhere.
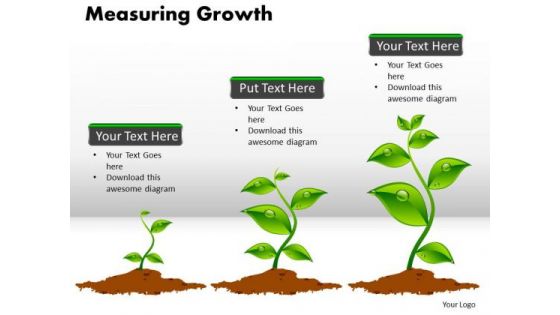
Business Process PowerPoint Templates Sales Measuring Growth Ppt Slides
Business Process PowerPoint Templates Sales Measuring Growth PPT Slides-This Diagram shows growing plants that is a conceptual representation for measuring growth -Business Process PowerPoint Templates Sales Measuring Growth PPT Slides-This template can be used for presentations relating to Accounting, Accounts, Analysis, Business, Capital, Cash, Coins, Concept, Conceptual, Corporate, Data, Detail, Earnings, Evaluate, Finance, Financial, Gains, Golden, Green, Growing, Growth, Hand, Income, Increasing, Indicator, Measuring Dont muddle through your presentation. Be in control with our Business Process PowerPoint Templates Sales Measuring Growth Ppt Slides. You will be at the top of your game.
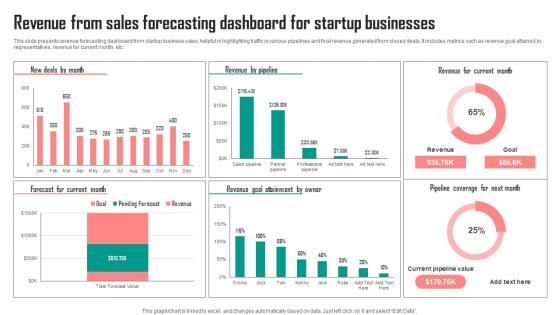
Revenue From Sales Forecasting Dashboard For Startup Businesses Graphics Pdf
This slide presents revenue forecasting dashboard from startup business sales, helpful in highlighting traffic in various pipelines and final revenue generated from closed deals. It includes metrics such as revenue goal attained by representatives, revenue for current month, etc. Showcasing this set of slides titled Revenue From Sales Forecasting Dashboard For Startup Businesses Graphics Pdf. The topics addressed in these templates are Owner, Current Month, Businesses. All the content presented in this PPT design is completely editable. Download it and make adjustments in color, background, font etc. as per your unique business setting. This slide presents revenue forecasting dashboard from startup business sales, helpful in highlighting traffic in various pipelines and final revenue generated from closed deals. It includes metrics such as revenue goal attained by representatives, revenue for current month, etc.
Ppt Linear Flow Illustration Practice The PowerPoint Macro Steps Of An Action Templates
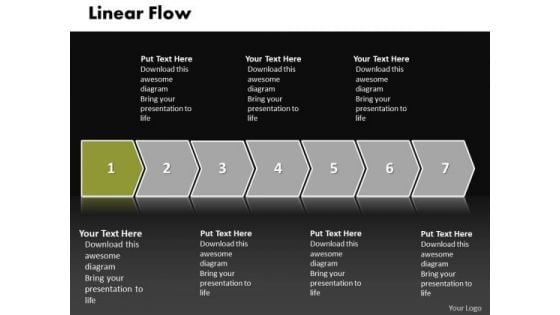
PPT linear flow illustration practice the powerpoint macro steps of an action Templates-This image represents the concept of structured analysis technique that employs a set of visual representations of the data that moves through the organization. This helps you to lay the base of your trend of thought-PPT linear flow illustration practice the powerpoint macro steps of an action Templates-3d, Arrow, Background, Banner, Business, Chart, Colorful, Diagram, Direction, Element, Financial, Flow, Gradient, Illustration, Isolated, Mirrored, Placeholder, Presentation, Process, Steps Our Ppt Linear Flow Illustration Practice The PowerPoint Macro Steps Of An Action Templates cater for different factions. They assist in finding common ground.
Eight Stages Of Pie Chart Data Interpretation Detailed Business Plan PowerPoint Templates
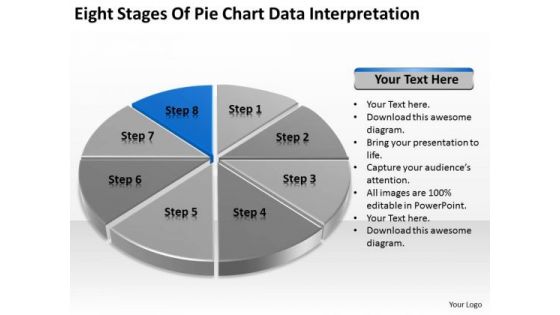
We present our eight stages of pie chart data interpretation detailed business plan PowerPoint templates.Download and present our Competition PowerPoint Templates because You can Stir your ideas in the cauldron of our PowerPoint Templates and Slides. Cast a magic spell on your audience. Download and present our Marketing PowerPoint Templates because You should Kick up a storm with our PowerPoint Templates and Slides. The heads of your listeners will swirl with your ideas. Download and present our Arrows PowerPoint Templates because Your ideas provide food for thought. Our PowerPoint Templates and Slides will help you create a dish to tickle the most discerning palate. Present our Circle Charts PowerPoint Templates because You can Stir your ideas in the cauldron of our PowerPoint Templates and Slides. Cast a magic spell on your audience. Download our Business PowerPoint Templates because You can Score a slam dunk with our PowerPoint Templates and Slides. Watch your audience hang onto your every word.Use these PowerPoint slides for presentations relating to chart, graph, pie, 3d, diagram, graphic, icon, control, business, data, profit, market, sales, display, corporate, concept, render, success, presentation, finance, report, marketing, accounting, management, piece, strategy, money, growth, company, competition, progress, account, sheet, part, information, investment, improvement, banking, index, financial, reflect, results, performance, exchange. The prominent colors used in the PowerPoint template are Blue, Black, Gray. Exult in the comfort of our Eight Stages Of Pie Chart Data Interpretation Detailed Business Plan PowerPoint Templates. Experience the convenience they deliver.
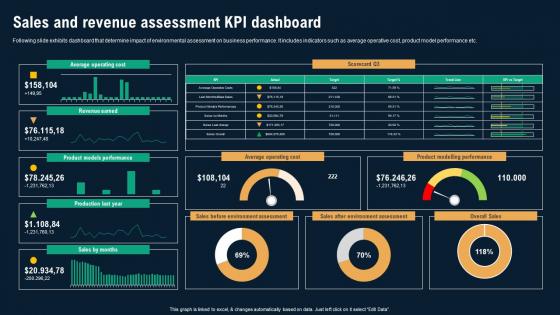
Sales And Revenue Assessment KPI Dashboard Business Environmental Analysis Ideas Pdf
Following slide exhibits dashboard that determine impact of environmental assessment on business performance. It includes indicators such as average operative cost, product model performance etc. There are so many reasons you need a Sales And Revenue Assessment KPI Dashboard Business Environmental Analysis Ideas Pdf The first reason is you can not spend time making everything from scratch, Thus, Slidegeeks has made presentation templates for you too. You can easily download these templates from our website easily. Following slide exhibits dashboard that determine impact of environmental assessment on business performance. It includes indicators such as average operative cost, product model performance etc.
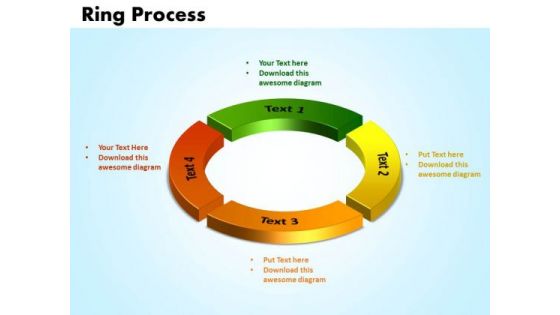
PowerPoint Slide Designs Ring Process Success Ppt Theme
PowerPoint Slide Designs ring process Success PPT Theme-This Diagram is best suited to streamline the processes for your audience to follow in order to interconnect with each other. Step by step develop the entire picture and project it onto their minds.-3d, art, business, chart, circle, concept, connection, cycle, development, diagram, direction, element, environment, finance, financial, flow, graphic, group, investment, isolated, market,, movement, organization, passive income, perspective, presentation, process chart, recycle, report, sign, step, success, symbol, teamwork-PowerPoint Slide Designs ring process Success PPT Theme Anything extra always attracts. Our PowerPoint Slide Designs Ring Process Success Ppt Theme will leave you absolutely delighted.
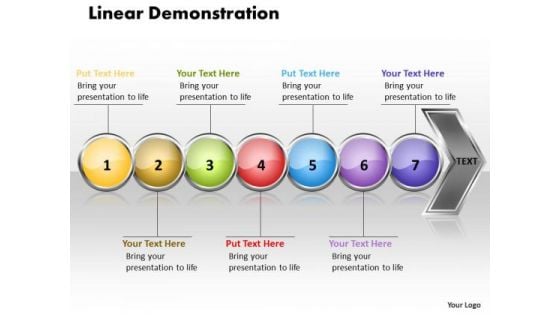
Ppt Linear Demonstration Of 7 Concepts PowerPoint Templates
PPT linear demonstration of 7 concepts PowerPoint Templates-The above diagram displays a Picture of a a Seven colorful stages represented by circles combined to form an arrow pointing in east direction. This image Portrays the concept of Process completion with great heights and Success. You can apply other 3D Styles and shapes to the slide to enhance your presentations.-PPT linear demonstration of 7 concepts PowerPoint Templates-Linear, Flow, Arrow, Background, Process, Business, Chart, Diagram, Financial, Graphic, Gray, Icon, Illustration, Management, Orange, Perspective, Process, Reflection, Stage, Spheres, Text, Extract the essence with our Ppt Linear Demonstration Of 7 Concepts PowerPoint Templates. Your thoughts will highlight the key conditions.
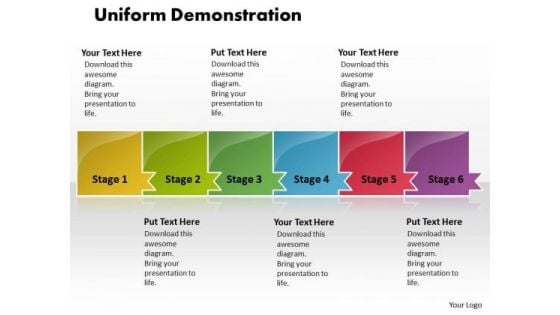
Ppt Uniform Demonstration Of 6 Power Point Stage PowerPoint Templates
PPT uniform demonstration of 6 power point stage PowerPoint Templates-Develop competitive advantage with our above Diagram which contains a Picture of six stages organized in Horizontal Manner. It is a useful captivating tool enables you to define your message in your Marketing PPT presentations. You can edit text, color, shade and style as per you need.-PPT uniform demonstration of 6 power point stage PowerPoint Templates-Linear, Flow, Arrow, Background, Process, Business, Chart, Diagram, Financial, Graphic, Gray, Icon, Illustration, Management, Orange, Perspective, Process, Reflection, Stage, Spheres, Text, Our Ppt Uniform Demonstration Of 6 Power Point Stage PowerPoint Templates disprove many a fallacy. They never fail to discern the truth.
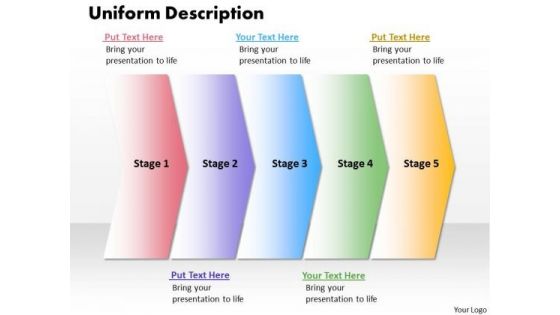
Ppt Uniform Description Of 5 Steps Working With Slide Numbers PowerPoint Templates
PPT uniform description of 5 steps working with slide numbers PowerPoint Templates-The above Diagram displays a picture of five Arrows placed in sequential manner. This image has been professionally designed to emphasize the concept of Operations performed in Circular process. Adjust the above image in your PPT presentations to visually support your content in your Business PPT slideshows.-PPT uniform description of 5 steps working with slide numbers PowerPoint Templates-Linear, Flow, Arrow, Background, Process, Business, Chart, Diagram, Financial, Graphic, Gray, Icon, Illustration, Management, Orange, Perspective, Process, Reflection, Stage, Spheres, Text, Expose the farce with our Ppt Uniform Description Of 5 Steps Working With Slide Numbers PowerPoint Templates. Bring the facts to the brim.
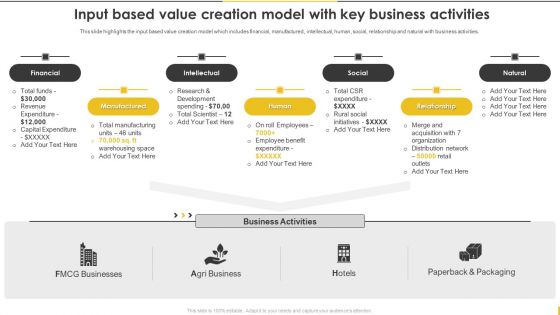
Customer Goods Production Input Based Value Creation Model With Key Business Clipart PDF
This slide highlights the input based value creation model which includes financial, manufactured, intellectual, human, social, relationship and natural with business activities. This modern and well-arranged Customer Goods Production Input Based Value Creation Model With Key Business Clipart PDF provides lots of creative possibilities. It is very simple to customize and edit with the Powerpoint Software. Just drag and drop your pictures into the shapes. All facets of this template can be edited with Powerpoint, no extra software is necessary. Add your own material, put your images in the places assigned for them, adjust the colors, and then you can show your slides to the world, with an animated slide included.
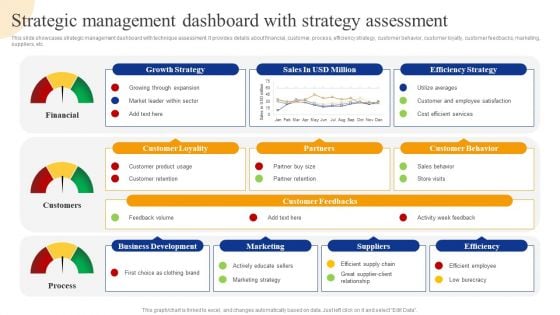
Strategic Management Dashboard With Strategy Assessment Strategic Management For Competitive Portrait PDF
This slide showcases strategic management dashboard with technique assessment. It provides details about financial, customer, process, efficiency strategy, customer behavior, customer loyalty, customer feedbacks, marketing, suppliers, etc. Do you know about Slidesgeeks Strategic Management Dashboard With Strategy Assessment Strategic Management For Competitive Portrait PDF These are perfect for delivering any kind od presentation. Using it, create PowerPoint presentations that communicate your ideas and engage audiences. Save time and effort by using our pre-designed presentation templates that are perfect for a wide range of topic. Our vast selection of designs covers a range of styles, from creative to business, and are all highly customizable and easy to edit. Download as a PowerPoint template or use them as Google Slides themes.
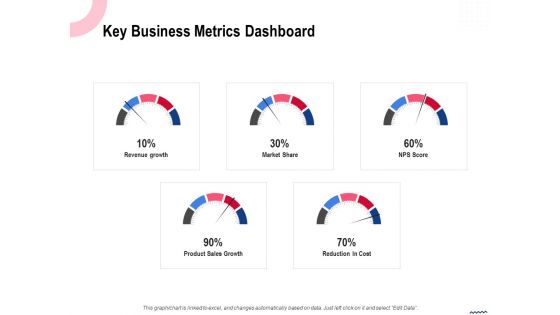
Wireless Phone Information Management Plan Key Business Metrics Dashboard Professional PDF
Presenting this set of slides with name wireless phone information management plan key business metrics dashboard professional pdf. The topics discussed in these slides are revenue growth, market share, reduction in cost, nps score, product sales growth. This is a completely editable PowerPoint presentation and is available for immediate download. Download now and impress your audience.


 Continue with Email

 Home
Home


