Financial Snapshot
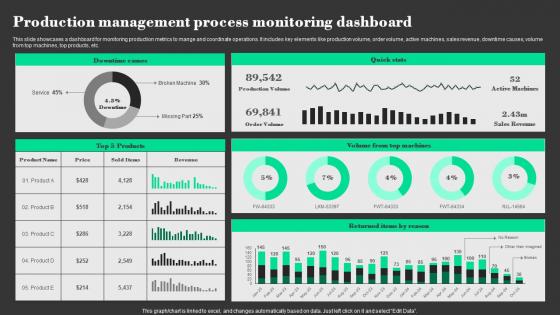
Production Management Process Monitoring Dashboard Designs Pdf
This slide showcases a dashboard for monitoring production metrics to mange and coordinate operations. It includes key elements like production volume, order volume, active machines, sales revenue, downtime causes, volume from top machines, top products, etc. Showcasing this set of slides titled Production Management Process Monitoring Dashboard Designs Pdf The topics addressed in these templates are Downtime Causes, Products, Volume From Top Machines All the content presented in this PPT design is completely editable. Download it and make adjustments in color, background, font etc. as per your unique business setting. This slide showcases a dashboard for monitoring production metrics to mange and coordinate operations. It includes key elements like production volume, order volume, active machines, sales revenue, downtime causes, volume from top machines, top products, etc.
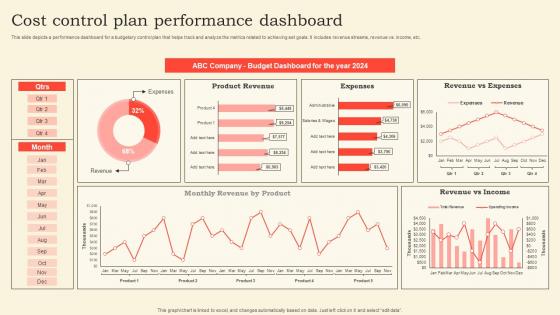
Cost Control Plan Performance Dashboard Pictures Pdf
This slide depicts a performance dashboard for a budgetary control plan that helps track and analyze the metrics related to achieving set goals. It includes revenue streams, revenue vs. income, etc. Pitch your topic with ease and precision using this Cost Control Plan Performance Dashboard Pictures Pdf. This layout presents information on Dashboard, Expenses, Income. It is also available for immediate download and adjustment. So, changes can be made in the color, design, graphics or any other component to create a unique layout. This slide depicts a performance dashboard for a budgetary control plan that helps track and analyze the metrics related to achieving set goals. It includes revenue streams, revenue vs. income, etc.
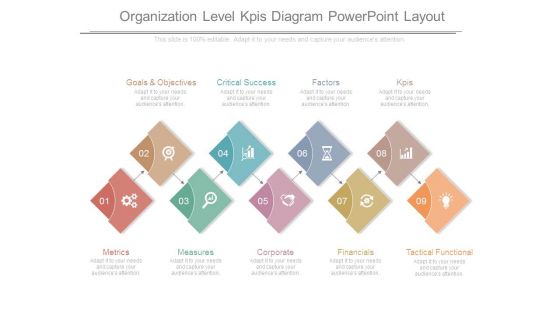
Organization Level Kpis Diagram Powerpoint Layout
This is a organization level kpis diagram powerpoint layout. This is a nine stage process. The stages in this process are goals and objectives, critical success, factors, kpis, metrics, measures, corporate, financials, tactical functional.
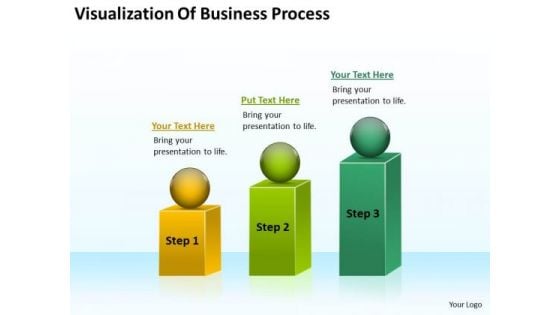
Visualization Of Business Process Ppt Plan PowerPoint Templates
We present our visualization of business process ppt plan PowerPoint templates.Present our Process and Flows PowerPoint Templates because Our PowerPoint Templates and Slides will Embellish your thoughts. They will help you illustrate the brilliance of your ideas. Download and present our Spheres PowerPoint Templates because It will Raise the bar of your Thoughts. They are programmed to take you to the next level. Use our Flow Charts PowerPoint Templates because Our PowerPoint Templates and Slides are conceived by a dedicated team. Use them and give form to your wondrous ideas. Use our Shapes PowerPoint Templates because Our PowerPoint Templates and Slides has conjured up a web of all you need with the help of our great team. Use them to string together your glistening ideas. Download and present our Marketing PowerPoint Templates because Our PowerPoint Templates and Slides will let you Leave a lasting impression to your audiences. They possess an inherent longstanding recall factor.Use these PowerPoint slides for presentations relating to Diagram, chart, market, statistics, square, grow, infograph, bar, corporate, business, vector, success, presentation, growing, circle, finance,analyst, goal, report, marketing, different, accounting, management, graph, illustration, geometric, sphere, design, growth, infographic, progress, profit,information, increase, aim, analyze, financial, rising, measure, block. The prominent colors used in the PowerPoint template are Green, Green lime, Yellow. Make an exhibition characteristic of you. Display your effectiveness on our Visualization Of Business Process Ppt Plan PowerPoint Templates.
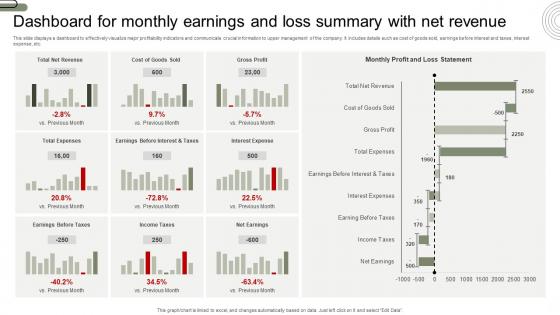
Dashboard For Monthly Earnings And Loss Summary With Net Revenue Background Pdf
This slide displays a dashboard to effectively visualize major profitability indicators and communicate crucial information to upper management of the company. It includes details such as cost of goods sold, earnings before interest and taxes, interest expense, etc. Pitch your topic with ease and precision using this Dashboard For Monthly Earnings And Loss Summary With Net Revenue Background Pdf. This layout presents information on Dashboard For Monthly Earnings, Loss Summary, Net Revenue. It is also available for immediate download and adjustment. So, changes can be made in the color, design, graphics or any other component to create a unique layout. This slide displays a dashboard to effectively visualize major profitability indicators and communicate crucial information to upper management of the company. It includes details such as cost of goods sold, earnings before interest and taxes, interest expense, etc.
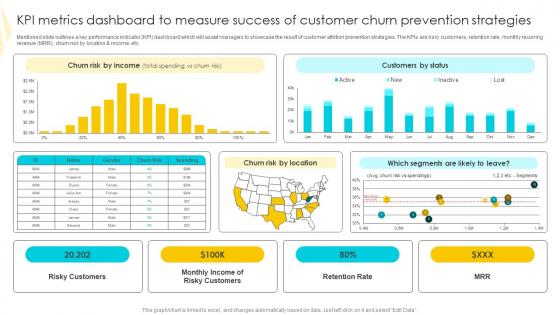
KPI Metrics Dashboard To Measure Strategies To Mitigate Customer Churn Formats Pdf
Mentioned slide outlines a key performance indicator KPI dashboard which will assist managers to showcase the result of customer attrition prevention strategies. The KPIs are risky customers, retention rate, monthly recurring revenue MRR, churn risk by location and income, etc. This KPI Metrics Dashboard To Measure Strategies To Mitigate Customer Churn Formats Pdf is perfect for any presentation, be it in front of clients or colleagues. It is a versatile and stylish solution for organizing your meetings. The KPI Metrics Dashboard To Measure Strategies To Mitigate Customer Churn Formats Pdf features a modern design for your presentation meetings. The adjustable and customizable slides provide unlimited possibilities for acing up your presentation. Slidegeeks has done all the homework before launching the product for you. So, do not wait, grab the presentation templates today Mentioned slide outlines a key performance indicator KPI dashboard which will assist managers to showcase the result of customer attrition prevention strategies. The KPIs are risky customers, retention rate, monthly recurring revenue MRR, churn risk by location and income, etc.
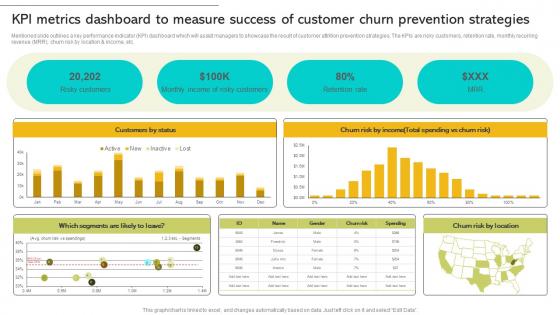
Implementing Strategies To Enhance Kpi Metrics Dashboard To Measure Success Of Customer Churn Ideas PDF
Mentioned slide outlines a key performance indicator KPI dashboard which will assist managers to showcase the result of customer attrition prevention strategies. The KPIs are risky customers, retention rate, monthly recurring revenue MRR, churn risk by location and income, etc. Explore a selection of the finest Implementing Strategies To Enhance Kpi Metrics Dashboard To Measure Success Of Customer Churn Ideas PDF here. With a plethora of professionally designed and pre-made slide templates, you can quickly and easily find the right one for your upcoming presentation. You can use our Implementing Strategies To Enhance Kpi Metrics Dashboard To Measure Success Of Customer Churn Ideas PDF to effectively convey your message to a wider audience. Slidegeeks has done a lot of research before preparing these presentation templates. The content can be personalized and the slides are highly editable. Grab templates today from Slidegeeks. Mentioned slide outlines a key performance indicator KPI dashboard which will assist managers to showcase the result of customer attrition prevention strategies. The KPIs are risky customers, retention rate, monthly recurring revenue MRR, churn risk by location and income, etc.
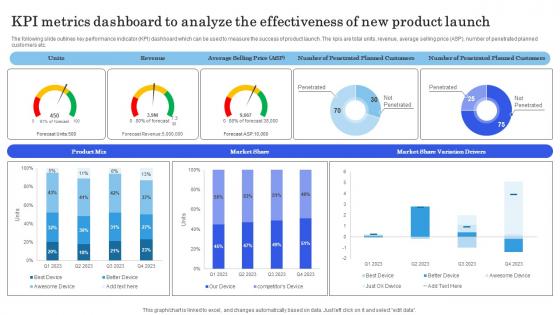
Launching New Commodity Kpi Metrics Dashboard To Analyze The Effectiveness Demonstration Pdf
The following slide outlines key performance indicator KPI dashboard which can be used to measure the success of product launch. The kpis are total units, revenue, average selling price ASP, number of penetrated planned customers etc. Explore a selection of the finest Launching New Commodity Kpi Metrics Dashboard To Analyze The Effectiveness Demonstration Pdf here. With a plethora of professionally designed and pre-made slide templates, you can quickly and easily find the right one for your upcoming presentation. You can use our Launching New Commodity Kpi Metrics Dashboard To Analyze The Effectiveness Demonstration Pdf to effectively convey your message to a wider audience. Slidegeeks has done a lot of research before preparing these presentation templates. The content can be personalized and the slides are highly editable. Grab templates today from Slidegeeks. The following slide outlines key performance indicator KPI dashboard which can be used to measure the success of product launch. The kpis are total units, revenue, average selling price ASP, number of penetrated planned customers etc.
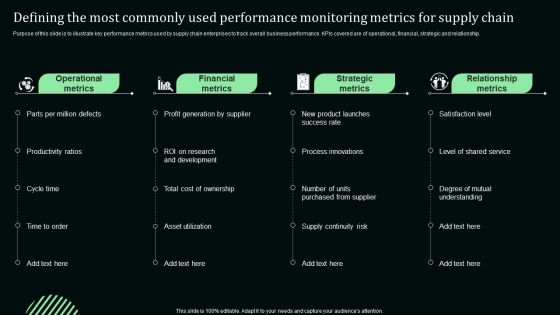
Defining The Most Commonly Used Performance Monitoring Metrics For Supply Chain Microsoft PDF
Purpose of this slide is to illustrate key performance metrics used by supply chain enterprises to track overall business performance. KPIs covered are of operational, financial, strategic and relationship.Crafting an eye-catching presentation has never been more straightforward. Let your presentation shine with this tasteful yet straightforward Defining The Most Commonly Used Performance Monitoring Metrics For Supply Chain Microsoft PDF template. It offers a minimalistic and classy look that is great for making a statement. The colors have been employed intelligently to add a bit of playfulness while still remaining professional. Construct the ideal Defining The Most Commonly Used Performance Monitoring Metrics For Supply Chain Microsoft PDF that effortlessly grabs the attention of your audience Begin now and be certain to wow your customers
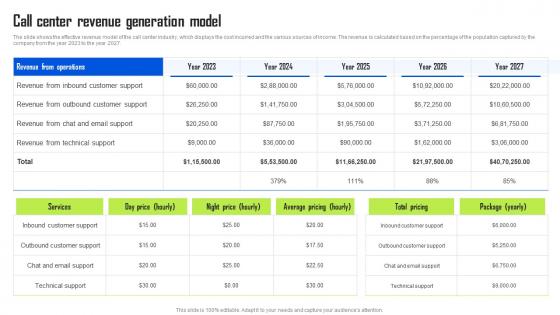
Call Center Revenue Generation Model BPO Center Business Plan Brochure Pdf
The slide shows the effective revenue model of the call center industry, which displays the cost incurred and the various sources of income. The revenue is calculated based on the percentage of the population captured by the company from the year 2023 to the year 2027. Do you have an important presentation coming up Are you looking for something that will make your presentation stand out from the rest Look no further than Call Center Revenue Generation Model BPO Center Business Plan Brochure Pdf With our professional designs, you can trust that your presentation will pop and make delivering it a smooth process. And with Slidegeeks, you can trust that your presentation will be unique and memorable. So why wait Grab Call Center Revenue Generation Model BPO Center Business Plan Brochure Pdf today and make your presentation stand out from the rest. The slide shows the effective revenue model of the call center industry, which displays the cost incurred and the various sources of income. The revenue is calculated based on the percentage of the population captured by the company from the year 2023 to the year 2027.
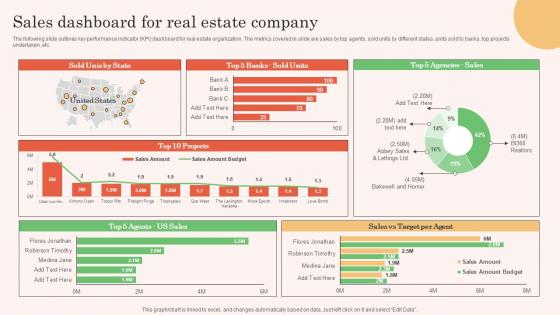
Sales Dashboard For Real Estate Company Real Estate Property Marketing Demonstration Pdf
The following slide outlines key performance indicator KPI dashboard for real estate organization. The metrics covered in slide are sales by top agents, sold units by different states, units sold to banks, top projects undertaken, etc.Make sure to capture your audiences attention in your business displays with our gratis customizable Sales Dashboard For Real Estate Company Real Estate Property Marketing Demonstration Pdf. These are great for business strategies, office conferences, capital raising or task suggestions. If you desire to acquire more customers for your tech business and ensure they stay satisfied, create your own sales presentation with these plain slides. The following slide outlines key performance indicator KPI dashboard for real estate organization. The metrics covered in slide are sales by top agents, sold units by different states, units sold to banks, top projects undertaken, etc.
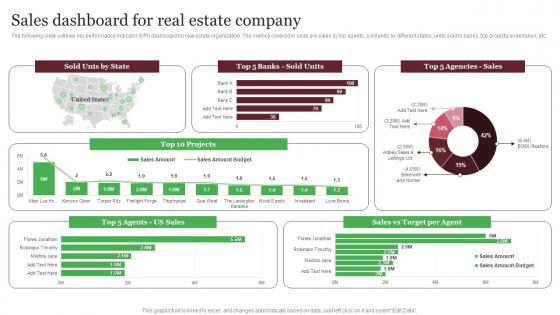
Sales Dashboard For Real Estate Company Out Of The Box Real Designs Pdf
The following slide outlines key performance indicator KPI dashboard for real estate organization. The metrics covered in slide are sales by top agents, sold units by different states, units sold to banks, top projects undertaken, etc. Make sure to capture your audiences attention in your business displays with our gratis customizable Sales Dashboard For Real Estate Company Out Of The Box Real Designs Pdf These are great for business strategies, office conferences, capital raising or task suggestions. If you desire to acquire more customers for your tech business and ensure they stay satisfied, create your own sales presentation with these plain slides. The following slide outlines key performance indicator KPI dashboard for real estate organization. The metrics covered in slide are sales by top agents, sold units by different states, units sold to banks, top projects undertaken, etc.
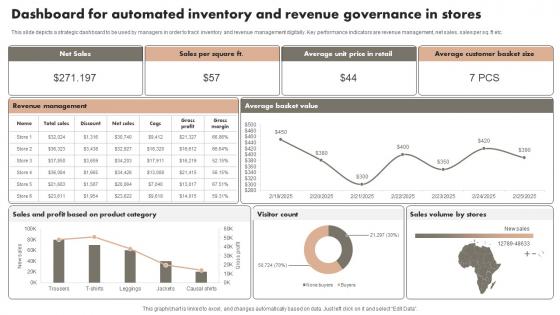
Dashboard For Automated Inventory And Revenue Governance In Stores Microsoft Pdf
This slide depicts a strategic dashboard to be used by managers in order to track inventory and revenue management digitally. Key performance indicators are revenue management, net sales, sales per sq. ft etc. Pitch your topic with ease and precision using this Dashboard For Automated Inventory And Revenue Governance In Stores Microsoft Pdf. This layout presents information on Net Sales, Stores, Category. It is also available for immediate download and adjustment. So, changes can be made in the color, design, graphics or any other component to create a unique layout. This slide depicts a strategic dashboard to be used by managers in order to track inventory and revenue management digitally. Key performance indicators are revenue management, net sales, sales per sq. ft etc.
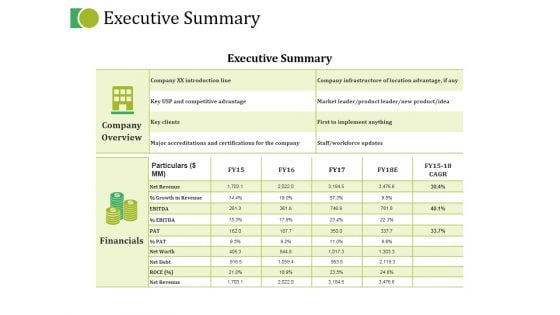
Executive Summary Ppt PowerPoint Presentation Portfolio Maker
This is a executive summary ppt powerpoint presentation portfolio maker. This is a two stage process. The stages in this process are company overview, financials, tables, management, data analysis.
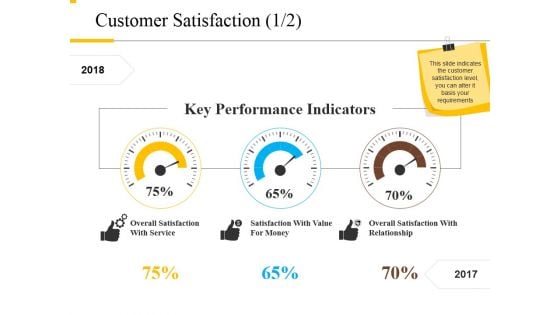
Customer Satisfaction Template 1 Ppt PowerPoint Presentation Infographics Outfit
This is a customer satisfaction template 1 ppt powerpoint presentation infographics outfit. This is a three stage process. The stages in this process are key performance indicators, overall satisfaction with service, satisfaction with value for money.

Customer Satisfaction Template 1 Ppt PowerPoint Presentation Ideas Tips
This is a customer satisfaction template 1 ppt powerpoint presentation ideas tips. This is a three stage process. The stages in this process are key performance indicators, overall satisfaction with service, satisfaction with value for money.
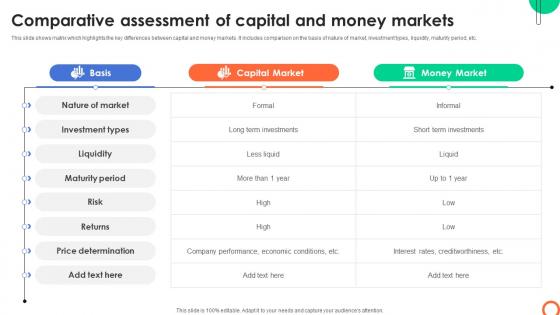
Comparative Assessment Of Capital And Money Understanding Investment Banking Framework Fin SS V
This slide shows information which can be used to understand the various components involved in private placements as a part of investment banking. It includes elements such as target audience, process, disclosure, etc. This slide shows matrix which highlights the key differences between capital and money markets. It includes comparison on the basis of nature of market, investment types, liquidity, maturity period, etc. Slidegeeks is here to make your presentations a breeze with Comparative Assessment Of Capital And Money Understanding Investment Banking Framework Fin SS V With our easy-to-use and customizable templates, you can focus on delivering your ideas rather than worrying about formatting. With a variety of designs to choose from, you are sure to find one that suits your needs. And with animations and unique photos, illustrations, and fonts, you can make your presentation pop. So whether you are giving a sales pitch or presenting to the board, make sure to check out Slidegeeks first This slide shows matrix which highlights the key differences between capital and money markets. It includes comparison on the basis of nature of market, investment types, liquidity, maturity period, etc.
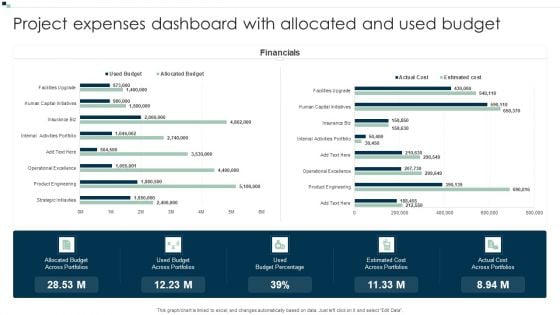
Project Expenses Dashboard With Allocated And Used Budget Introduction PDF
Showcasing this set of slides titled Project Expenses Dashboard With Allocated And Used Budget Introduction PDF. The topics addressed in these templates are Financials, Used Budget Across Portfolios, Estimated Cost Across Portfolios. All the content presented in this PPT design is completely editable. Download it and make adjustments in color, background, font etc. as per your unique business setting.
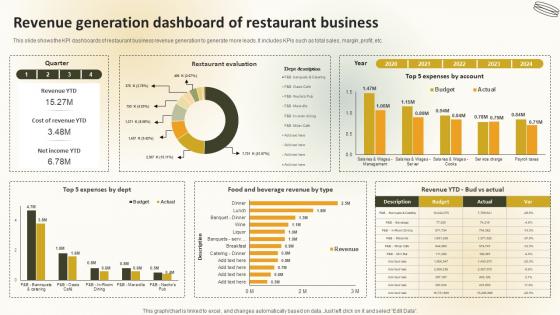
Revenue Generation Dashboard Of Restaurant Business Create An Effective Restaurant
This slide shows the KPI dashboards of restaurant business revenue generation to generate more leads. It includes KPIs such as total sales, margin,profit, etc. Present like a pro with Revenue Generation Dashboard Of Restaurant Business Create An Effective Restaurant. Create beautiful presentations together with your team, using our easy-to-use presentation slides. Share your ideas in real-time and make changes on the fly by downloading our templates. So whether you are in the office, on the go, or in a remote location, you can stay in sync with your team and present your ideas with confidence. With Slidegeeks presentation got a whole lot easier. Grab these presentations today. This slide shows the KPI dashboards of restaurant business revenue generation to generate more leads. It includes KPIs such as total sales, margin,profit, etc.
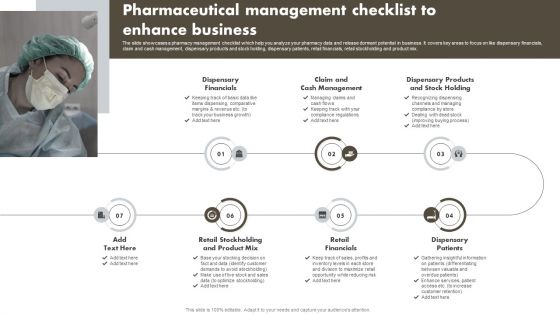
Pharmaceutical Management Checklist To Enhance Business Elements PDF
The slide showcases a pharmacy management checklist which help you analyze your pharmacy data and release dormant potential in business. It covers key areas to focus on like dispensary financials, claim and cash management, dispensary products and stock holding, dispensary patients, retail financials, retail stockholding and product mix. Pitch your topic with ease and precision using this Pharmaceutical Management Checklist To Enhance Business Elements PDF. This layout presents information on Retail Financials, Dispensary Patients, Cash Management. It is also available for immediate download and adjustment. So, changes can be made in the color, design, graphics or any other component to create a unique layout.
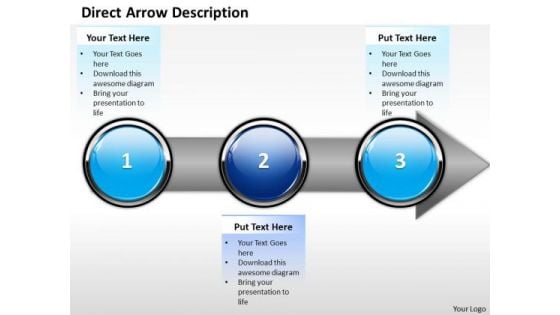
Ppt Direct Description Of Banking Process Using 3 Stages PowerPoint Templates
PPT direct description of banking process using 3 stages PowerPoint Templates-This PowerPoint Diagram shows three circular boxes on the arrow pointing towards east direction signifying he completion of the process and leading towards success.-PPT direct description of banking process using 3 stages PowerPoint Templates-Arrow, Bank, Benefit, Business, Calculate, Calculation, Capitalist, Communication, Company, Concern, Connection, Data, Diagram, Digital, Drawing, Earnings, Economic, Finance, Financial, Flow, Forecast, Gain, Goal, Graph, Growth, Illustration, Increase, Information, Interest, Investing, Management, Market, Money, Move, Network, Objective, Plan, Process, Profit, Progress, Report, Rise, Risk, Shares, Statistics, Stock, System, Technology Guide your team with our Ppt Direct Description Of Banking Process Using 3 Stages PowerPoint Templates. Download without worries with our money back guaranteee.
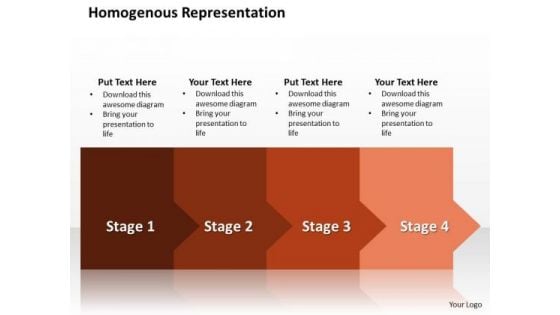
Ppt Homogenous Way To Prevent Banking Losses Four PowerPoint Slide Numbers Templates
PPT homogenous way to prevent banking losses four powerpoint slide numbers Templates-This PowerPoint Diagram shows you the Homogenous way to prevent Banking losses or losses in Business related Activities. It is shown by different shades of Brown color. It consists of four Stages.-PPT homogenous way to prevent banking losses four powerpoint slide numbers Templates-Arrow, Bank, Benefit, Business, Calculate, Calculation, Capitalist, Communication, Company, Concern, Connection, Data, Diagram, Digital, Drawing, Earnings, Economic, Finance, Financial, Flow, Forecast, Gain, Goal, Graph, Growth, Illustration, Increase, Information, Interest, Investing, Management, Market, Money, Move, Network, Objective, Plan, Process, Profit, Progress, Report, Rise, Risk, Shares, Statistics, Stock, System, Technology Pinpoint problems with our Ppt Homogenous Way To Prevent Banking Losses Four PowerPoint Slide Numbers Templates. Download without worries with our money back guaranteee.
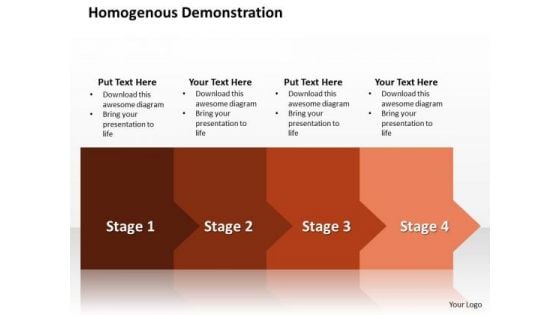
Ppt Homogenous Way To Avoid Development Losses Four Steps PowerPoint Templates
PPT homogenous way to avoid development losses four steps PowerPoint Templates-The theme of this PowerPoint template is linear arrows. Use them to illustrate a stepwise process or a phase structure. You can easily change its colors-PPT homogenous way to avoid development losses four steps PowerPoint Templates-Arrow, Bank, Benefit, Business, Calculate, Calculation, Capitalist, Communication, Company, Concern, Connection, Data, Diagram, Digital, Drawing, Earnings, Economic, Finance, Financial, Flow, Forecast, Gain, Goal, Graph, Growth, Illustration, Increase, Information, Interest, Investing, Management, Market, Money, Move, Network, Objective, Plan, Process, Profit, Progress, Report, Rise, Risk, Shares, Statistics, Stock, System, Technology Cater for diverse education with our Ppt Homogenous Way To Avoid Development Losses Four Steps PowerPoint Templates. Bring out the best in every child.
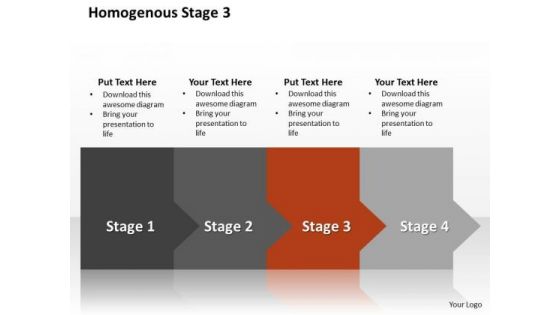
Ppt Homogenous Way To Prevent Banking Losses Stage 3 PowerPoint Templates
PPT homogenous way to prevent banking losses stage 3 PowerPoint Templates-The theme of this PowerPoint template is linear arrows. Use them to illustrate a stepwise process or a phase structure. You can easily change its colors-PPT homogenous way to prevent banking losses stage 3 PowerPoint Templates-Arrow, Bank, Benefit, Business, Calculate, Calculation, Capitalist, Communication, Company, Concern, Connection, Data, Diagram, Digital, Drawing, Earnings, Economic, Finance, Financial, Flow, Forecast, Gain, Goal, Graph, Growth, Illustration, Increase, Information, Interest, Investing, Management, Market, Money, Move, Network, Objective, Plan, Process, Profit, Progress, Report, Rise, Risk, Shares, Statistics, Stock, System, Technology Making plans with our Ppt Homogenous Way To Prevent Banking Losses Stage 3 PowerPoint Templates entails success. They ensure automatic returns.
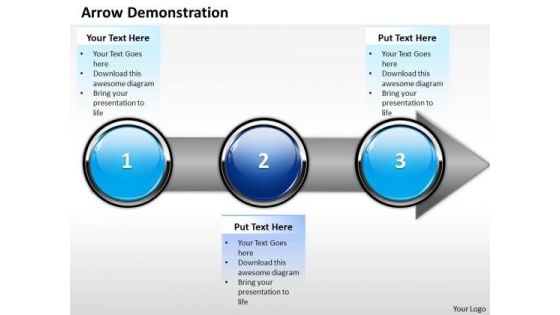
Ppt Consecutive Description Of Banking Process Using 3 State Diagram PowerPoint Templates
PPT consecutive description of banking process using 3 state diagram PowerPoint Templates-With this pre-designed process arrows diagram you can visualize almost any type of concept, chronological process or steps of your strategies.-PPT consecutive description of banking process using 3 state diagram PowerPoint Templates-Arrow, Bank, Benefit, Business, Calculate, Calculation, Capitalist, Communication, Company, Concern, Connection, Data, Diagram, Digital, Drawing, Earnings, Economic, Finance, Financial, Flow, Forecast, Gain, Goal, Graph, Growth, Illustration, Increase, Information, Interest, Investing, Management, Market, Money, Move, Network, Objective, Plan, Process, Profit, Progress, Report, Rise, Risk, Shares, Statistics, Stock, System, Technology Turn the heat up with our Ppt Consecutive Description Of Banking Process Using 3 State Diagram PowerPoint Templates. Make sure your presentation gets the attention it deserves.
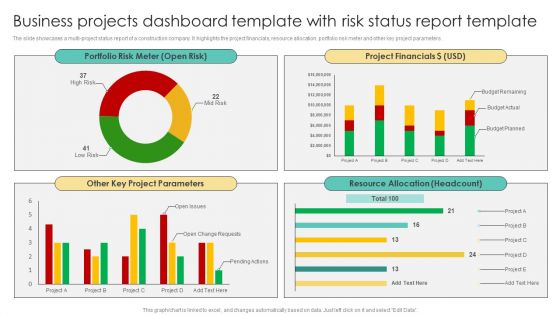
Business Projects Dashboard Template With Risk Status Report Template Topics PDF
The slide showcases a multi-project status report of a construction company. It highlights the project financials, resource allocation, portfolio risk meter and other key project parameters. Pitch your topic with ease and precision using this Business Projects Dashboard Template With Risk Status Report Template Topics PDF. This layout presents information on Portfolio Risk Meter, Project Financials, Project Parameters, Resource Allocation. It is also available for immediate download and adjustment. So, changes can be made in the color, design, graphics or any other component to create a unique layout.

Strategies For Dynamic Supply Chain Agility Defining The Most Commonly Used Performance Demonstration PDF
Purpose of this slide is to illustrate key performance metrics used by supply chain enterprises to track overall business performance. KPIs covered are of operational, financial, strategic and relationship. Create an editable Strategies For Dynamic Supply Chain Agility Defining The Most Commonly Used Performance Demonstration PDF that communicates your idea and engages your audience. Whether youre presenting a business or an educational presentation, pre designed presentation templates help save time. Strategies For Dynamic Supply Chain Agility Defining The Most Commonly Used Performance Demonstration PDF is highly customizable and very easy to edit, covering many different styles from creative to business presentations. Slidegeeks has creative team members who have crafted amazing templates. So, go and get them without any delay.

Create A Restaurant Marketing Revenue Generation Dashboard Of Restaurant
This slide shows the KPI dashboards of restaurant business revenue generation to generate more leads. It includes KPIs such as total sales, margin ,profit, etc. Present like a pro with Create A Restaurant Marketing Revenue Generation Dashboard Of Restaurant. Create beautiful presentations together with your team, using our easy-to-use presentation slides. Share your ideas in real-time and make changes on the fly by downloading our templates. So whether you are in the office, on the go, or in a remote location, you can stay in sync with your team and present your ideas with confidence. With Slidegeeks presentation got a whole lot easier. Grab these presentations today. This slide shows the KPI dashboards of restaurant business revenue generation to generate more leads. It includes KPIs such as total sales, margin ,profit, etc.
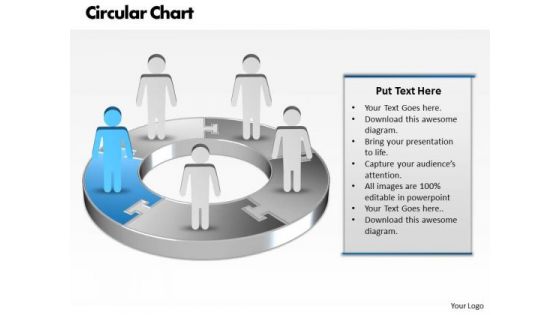
Ppt Blue Men Standing On Business Pie Organization Chart PowerPoint Template Templates
PPT blue men standing on business pie organization chart powerpoint template Templates-Use this Business based PowerPoint Diagram to represent the Business issues Graphically. It indicates arrange, block out, blueprint, cast, delineate, design, devise, draft, graph , lay out, outline, plot, project, shape, sketch etc.-PPT blue men standing on business pie organization chart powerpoint template Templates-arrow, art, basic, blank, business, capital, chart, chevron, clip, clipart, colorful, conglomerates, consumer, copy, cyclical, energy, financial, flow, goods, graph, graphic, healthcare, illustration, infographic, information, investment, isolated, market, materials, non, round, sectors, services, slide, space, stock, technology, text, Our Ppt Blue Men Standing On Business Pie Organization Chart PowerPoint Template Templates are never a drag. The audience will be always attentive.
Web Consulting Business Various Kpis For Tracking Business Performance
Mentioned slide provide insights into various key performance indicators to determine business performance. It includes KPIs such as business financials, website traffic, customer case, customer engagement, conversion rate, customer retention, customer bounce rate, employee turnover, etc. This modern and well-arranged Web Consulting Business Various Kpis For Tracking Business Performance provides lots of creative possibilities. It is very simple to customize and edit with the Powerpoint Software. Just drag and drop your pictures into the shapes. All facets of this template can be edited with Powerpoint, no extra software is necessary. Add your own material, put your images in the places assigned for them, adjust the colors, and then you can show your slides to the world, with an animated slide included. Mentioned slide provide insights into various key performance indicators to determine business performance. It includes KPIs such as business financials, website traffic, customer case, customer engagement, conversion rate, customer retention, customer bounce rate, employee turnover, etc.
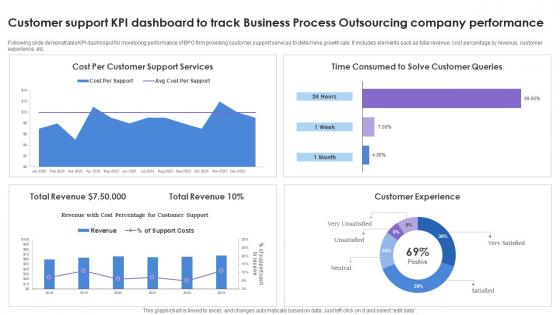
Customer Support KPI Dashboard To Track Business Process Outsourcing Company Performance Rules Pdf Wd
Following slide demonstrates KPI dashboard for monitoring performance of BPO firm providing customer support services to determine growth rate. It includes elements such as total revenue, cost percentage by revenue, customer experience, etc. Showcasing this set of slides titled Customer Support KPI Dashboard To Track Business Process Outsourcing Company Performance Rules Pdf Wd. The topics addressed in these templates are Customer Experience, Total Revenue. All the content presented in this PPT design is completely editable. Download it and make adjustments in color, background, font etc. as per your unique business setting. Following slide demonstrates KPI dashboard for monitoring performance of BPO firm providing customer support services to determine growth rate. It includes elements such as total revenue, cost percentage by revenue, customer experience, etc.
Managing Technical And Non Various Kpis For Tracking Business Performance
Mentioned slide provide insights into various key performance indicators to determine business performance. It includes KPIs such as business financials, website traffic, customer case, customer engagement, conversion rate, customer retention, customer bounce rate, employee turnover, etc. Make sure to capture your audiences attention in your business displays with our gratis customizable Managing Technical And Non Various Kpis For Tracking Business Performance. These are great for business strategies, office conferences, capital raising or task suggestions. If you desire to acquire more customers for your tech business and ensure they stay satisfied, create your own sales presentation with these plain slides. Mentioned slide provide insights into various key performance indicators to determine business performance. It includes KPIs such as business financials, website traffic, customer case, customer engagement, conversion rate, customer retention, customer bounce rate, employee turnover, etc.
Comprehensive Guide For Website Various Kpis For Tracking Business Performance
Mentioned slide provide insights into various key performance indicators to determine business performance. It includes KPIs such as business financials, website traffic, customer case, customer engagement, conversion rate, customer retention, customer bounce rate, employee turnover, etc. Make sure to capture your audiences attention in your business displays with our gratis customizable Comprehensive Guide For Website Various Kpis For Tracking Business Performance. These are great for business strategies, office conferences, capital raising or task suggestions. If you desire to acquire more customers for your tech business and ensure they stay satisfied, create your own sales presentation with these plain slides. Mentioned slide provide insights into various key performance indicators to determine business performance. It includes KPIs such as business financials, website traffic, customer case, customer engagement, conversion rate, customer retention, customer bounce rate, employee turnover, etc.

Strategies For Reducing Cybersecurity Risks In ABS Healthcare Company Ppt Professional Mockup PDF
This slide shows strategies that can be adopted by the company in order to minimize the cybersecurity risks and increasing malware attacks. Some strategies are data encryption, proper employee training, protection of physical devices, use df latest and updated softwares etc. This is a strategies for reducing cybersecurity risks in ABS healthcare company ppt professional mockup pdf template with various stages. Focus and dispense information on five stages using this creative set, that comes with editable features. It contains large content boxes to add your information on topics like data management, operating system maintenance, financial, protect devices that can be physically accessed. You can also showcase facts, figures, and other relevant content using this PPT layout. Grab it now.

Ppt Go Green Layouts PowerPoint Free And Orange Arrow 9 Stages Templates
PPT go green layouts powerpoint free and orange arrow 9 stages Templates-Use this Curved Arrows diagram to show activities that are related to the business plan metrics and monitor the results to determine if the business plan is proceeding as planned. Our PPT images are so perfectly designed that it reveals the very basis of our PPT diagrams and are an effective tool to make your clients understand.-PPT go green layouts powerpoint free and orange arrow 9 stages Templates-Arrow, Background, Process, Business, Chart, Diagram, Financial, Graphic, Gray, Icon, Illustration, Management, Orange, Perspective, Process, Reflection, 9 Stages, Steps, Text, Transparency Fall back on our Ppt Go Green Layouts PowerPoint Free And Orange Arrow 9 Stages Templates at anytime. They are always ready and able to answer your call.
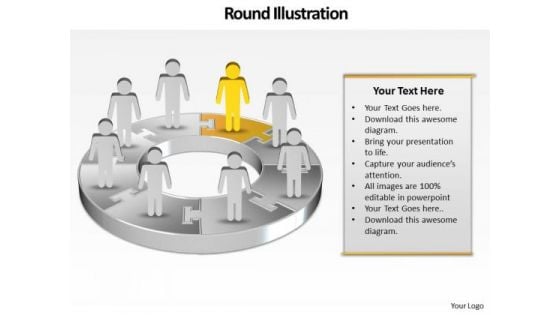
Ppt Team Effort Person Standing Yellow Piece Of Chart PowerPoint Ks2 Templates
PPT team effort person standing yellow piece of chart PowerPoint ks2 Templates-Use this Circular Arrow diagram to show activities that are related to the business plan metrics and monitor the results to determine if the business plan is proceeding as planned. You can apply other 3D Styles and shapes to the slide to enhance your presentations.-PPT team effort person standing yellow piece of chart PowerPoint ks2 Templates-arrow, bar, business, businessman, candidate, cartoon, character, chart, circle, circular, client, communication, company, concept, diagram, finance, financial, flow, growth, human, illustration, increase, information, iteration, man, market, marketing, process, processing, profit, sales, statistics, stats, success, target Feature your views with our Ppt Team Effort Person Standing Yellow Piece Of Chart PowerPoint Ks2 Templates. They will get the desired exposure.

Implementing Cybersecurity Awareness Program To Prevent Attacks Understanding The Frequency And Weightage Topics PDF
The purpose of this slide is to showcase the frequency and weightage of different cyber attacks on multiple departments. The major departments mentioned in the slide are financial, marketing, information technology IT and human resource HR. Slidegeeks is here to make your presentations a breeze with Implementing Cybersecurity Awareness Program To Prevent Attacks Understanding The Frequency And Weightage Topics PDF With our easy to use and customizable templates, you can focus on delivering your ideas rather than worrying about formatting. With a variety of designs to choose from, you are sure to find one that suits your needs. And with animations and unique photos, illustrations, and fonts, you can make your presentation pop. So whether you are giving a sales pitch or presenting to the board, make sure to check out Slidegeeks first.
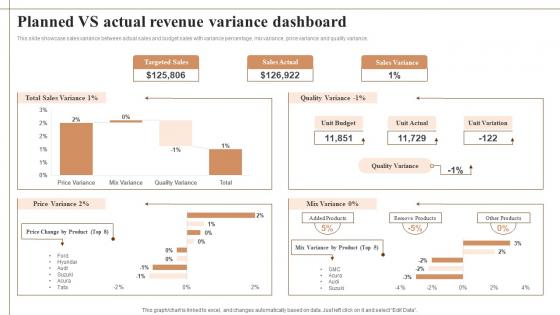
Planned Vs Actual Revenue Variance Dashboard Background Pdf
This slide showcase sales variance between actual sales and budget sales with variance percentage, mix variance, price variance and quality variance. Showcasing this set of slides titled Planned Vs Actual Revenue Variance Dashboard Background Pdf The topics addressed in these templates are Targeted Sales, Sales Actual, Sales Variance All the content presented in this PPT design is completely editable. Download it and make adjustments in color, background, font etc. as per your unique business setting. This slide showcase sales variance between actual sales and budget sales with variance percentage, mix variance, price variance and quality variance.
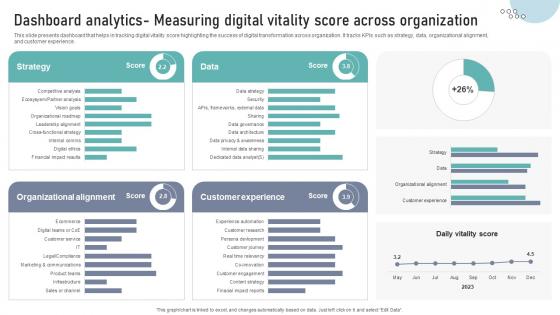
Dashboard Analytics Measuring Digital Vitality Score Across Organization DT SS V
This slide presents dashboard that helps in tracking digital vitality score highlighting the success of digital transformation across organization. It tracks KPIs such as strategy, data, organizational alignment,and customer experience.Make sure to capture your audiences attention in your business displays with our gratis customizable Dashboard Analytics Measuring Digital Vitality Score Across Organization DT SS V. These are great for business strategies, office conferences, capital raising or task suggestions. If you desire to acquire more customers for your tech business and ensure they stay satisfied, create your own sales presentation with these plain slides. This slide presents dashboard that helps in tracking digital vitality score highlighting the success of digital transformation across organization. It tracks KPIs such as strategy, data, organizational alignment,and customer experience.
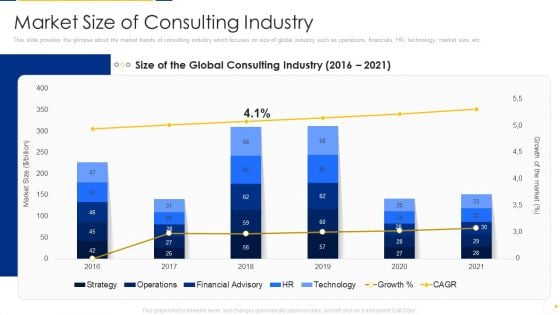
Advisory Company Pitch Deck Market Size Of Consulting Industry Ppt Portfolio Pictures PDF
This slide provides the glimpse about the market trends of consulting industry which focuses on size of global industry such as operations, financials, HR, technology, market size, etc. Deliver and pitch your topic in the best possible manner with this advisory company pitch deck market size of consulting industry ppt portfolio pictures pdf. Use them to share invaluable insights on financials, technology, global, growth and impress your audience. This template can be altered and modified as per your expectations. So, grab it now.

PowerPoint Design Circular Puzzle Company Ppt Presentation
PowerPoint Design Circular Puzzle Company PPT Presentation-It is all there in bits and pieces. Individual components well researched and understood in their place.Now youneed to get it all together to form the complete picture and reach the goal. You have the ideas and plans on how to go about it.Use this template to illustrate your method, piece by piece, and interlock the whole process in the minds of your audience-PowerPoint Design Circular Puzzle Company PPT Presentation-This ppt can be used for presentations relating to-Art, Basic, Business, Capital, Char, Circle, Clip, Clipart, Colorful, Conglomerates, Consumer, Cyclical, Energy, Financial, Goods, Graph, Graphic, Healthcare, Illustration, Infographic, Information, Investment, Isolated, Market, Materials, Non, Pie, Round Our PowerPoint Design Circular Puzzle Company Ppt Presentation have an extraordinary presence. They tend to have an 'out- of- this- world' effect.
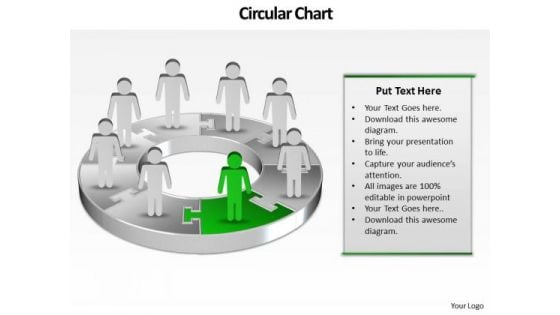
Ppt Pie Family Tree Chart PowerPoint 2003 Person Standing Green Piece Templates
PPT pie family tree chart PowerPoint 2003 person standing green piece Templates-The above Diagram displays a picture of eight circular text boxes placed in sequential manner. This image has been professionally designed to emphasize the concept of Operations performed in Circular process. Adjust the above image in your PPT presentations to visually support your content in your Business PPT slideshows.-PPT pie family tree chart PowerPoint 2003 person standing green piece Templates-arrow, bar, business, businessman, candidate, cartoon, character, chart, circle, circular, client, communication, company, concept, diagram, finance, financial, flow, growth, human, illustration, increase, information, iteration, man, market, marketing, process, processing, profit, sales, statistics, stats, success, target Embrace your dreams with our Ppt Pie Family Tree Chart PowerPoint 2003 Person Standing Green Piece Templates. They will come within your grasp.
Editable PowerPoint Template Arrow Process 2 Stages Style 1 Business Plan Ppt Image
editable PowerPoint template arrow process 2 stages style 1 business plan ppt Image-You have the ideas and plans on how to achieve success Step by step develop the entire picture and project it onto minds of your team. Use this excellent graphics that allows you to effectively highlight the key issues concerning the growth of your business.-editable PowerPoint template arrow process 2 stages style 1 business plan ppt Image-Advertisement, Aqua, Arrow, Blank, Blue, Bread-Crumbs, Business, Button, Collection, Decoration, Design, Direction, Elegance, Element, Empty, Financial, Flow, Gradient, Graph, Horizontal, Illustration, Image, Isolated, Label, Menu, Placard, Process Give it your all with our Editable PowerPoint Template Arrow Process 2 Stages Style 1 Business Plan Ppt Image. They will back you every inch of the way.
Strategy PowerPoint Template Planning Process Of 2 Stages Graphic
We present our strategy PowerPoint template planning process of 2 stages Graphic. Use our Metaphor PowerPoint Templates because, you have the entire picture in mind. Use our Symbol PowerPoint Templates because, you have a great training programmer in mind to upgrade the skills of your staff. Use our Arrows PowerPoint Templates because, Individual components well researched and understood in their place. Use our Process and Flows PowerPoint Templates because, you have some great folks working with you, thinking with you. Use our Business PowerPoint Templates because, our presentation designs are for those on the go. Use these PowerPoint slides for presentations relating to Arrow, Background, Business, Chart, Diagram, Financial, Graphic, Gray, Icon, Illustration, Management, Orange, Perspective, Planning, Process, Process, Stages, Steps, Text. The prominent colors used in the PowerPoint template are Blue, Gray, and Green Say it with feeling with our Strategy PowerPoint Template Planning Process Of 2 Stages Graphic. Appropriate emotions will begin to emerge.

Ppt Theme Beeline Two Phase Diagram Arrow Spider PowerPoint Template 3 Image
We present our PPT Theme beeline two phase diagram arrow spider PowerPoint template 3 Image. Use our Arrows PowerPoint Templates because, you have the entire picture in mind. Use our Symbol PowerPoint Templates because; Use this template to explain the value of its wellness to human life. Use our Business PowerPoint Templates because; Help them develop their thoughts along the way. Use our Process and Flows PowerPoint Templates because, are the triggers of our growth. Use our Marketing PowerPoint Templates because, Be the cynosure of all eyes with our template depicting .Use these PowerPoint slides for presentations relating to Arrows, Background, Business, Chart, Circle, Circular, Financial, Flow, Graphic, Gray, Icon, Illustration, Isometric, Leadership, Marketing, Perspective, Process, Recycle, Round, Shape, Steps. The prominent colors used in the PowerPoint template are Blue, Gray, and Black Our Ppt Theme Beeline Two Phase Diagram Arrow Spider PowerPoint Template 3 Image are really considerate. They give everyone equal attention.
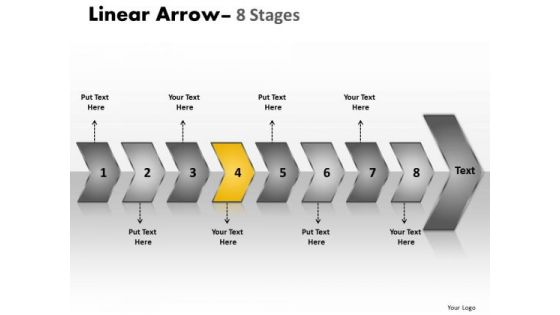
Flow Ppt Chronological Description Of 8 Arrows Time Management PowerPoint 5 Design
We present our flow PPT chronological Description of 8 arrows time management Powerpoint 5 design. Use our Symbol PowerPoint Templates because; the mind is always whirring with new ideas. Use our Business PowerPoint Templates because, you have the entire picture in mind. Use our Arrows PowerPoint Templates because, you as the Champion your team shall anoint. Use our Process and Flows PowerPoint Templates because, Ideas roll along in your mind like billiard balls. Use our Shapes PowerPoint Templates because; educate your staff on the means to provide the required support for speedy recovery. Use these PowerPoint slides for presentations relating to Arrow, Background, Business, Chart, Diagram, Financial, Flow, Graphic, Gray, Icon, Illustration, Linear, Management, Orange, Perspective, Process, Reflection, Shapes, Stage, Text. The prominent colors used in the PowerPoint template are Yellow, Gray, and Black Club your thoughts with our Flow Ppt Chronological Description Of 8 Arrows Time Management PowerPoint 5 Design. Together they will create an astounding effect.
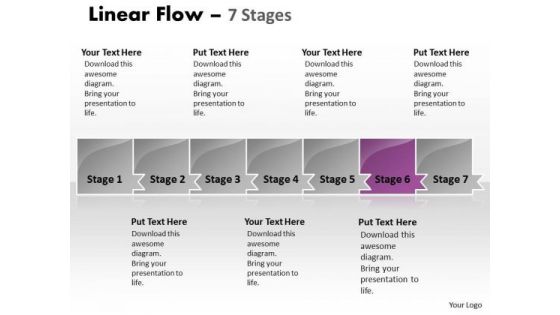
Flow Ppt Parellel Demonstration Of 7 Stages Operations Management PowerPoint Image
We present our flow PPT parallel demonstration of 7 stages operations management Powerpoint Image. Use our Symbol PowerPoint Templates because, guaranteed to focus the minds of your team. Use our Arrows PowerPoint Templates because, you have the entire picture in mind. Use our Boxes PowerPoint Templates because, Clear thinking is your strength, transmit your thoughts to your eager team. Use our Business PowerPoint Templates because, you know the path so show the way. Use our Process and Flows PowerPoint Templates because, you have played a stellar role and have a few ideas. Use these PowerPoint slides for presentations relating to Arrow, Background, Business, Chart, Diagram, Financial, Flow, Graphic, Gray, Icon, Illustration, Linear, Management, Orange, Perspective, Process, Reflection, Shapes, Stage, Text. The prominent colors used in the PowerPoint template are Purple, Gray, and White Be a master with our Flow Ppt Parellel Demonstration Of 7 Stages Operations Management PowerPoint Image. You will come out on top.
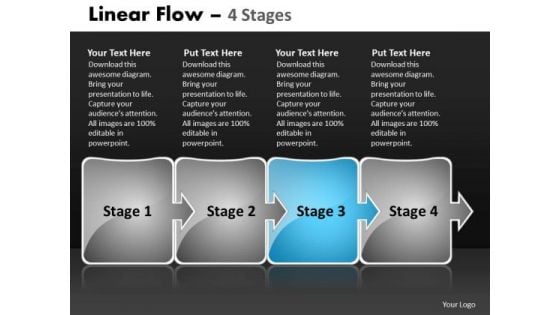
Ppt Arrow Progression Of Business Representation Video Workflow Diagram 4 Design
We present our PPT arrow progression of Business representation video workflow diagram 4 design. Use our Arrows PowerPoint Templates because, Emphasize on any critical or key factors within them. Use our Signs PowerPoint Templates because, You have the entire picture in mind. Use our Process and Flows PowerPoint Templates because, Be the cynosure of all eyes with our template depicting. Use our Metaphor PowerPoint Templates because; Highlight the important timelines and milestones of this exciting journey. Use our Business PowerPoint Templates because, You have a great training programmed in mind to upgrade the skills of your staff. Use these PowerPoint slides for presentations relating to Arrow, Background, Business, Chart, Diagram, Financial, Graphic, Gray, Icon, Illustration, Management, Orange, Perspective, Planning, Process, Stages, Steps, Text. The prominent colors used in the PowerPoint template are Blue, Gray, Black Take all factors into account. Take a cue from our Ppt Arrow Progression Of Business Representation Video Workflow Diagram 4 Design.
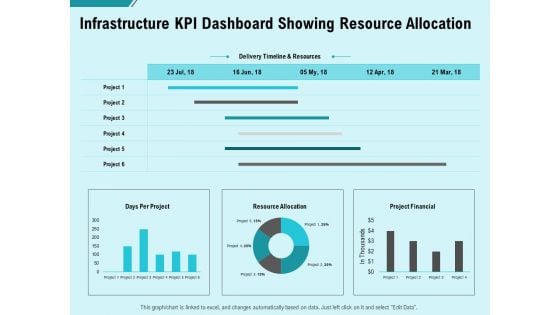
Facility Operations Contol Infrastructure Kpi Dashboard Showing Resource Allocation Slides PDF
Presenting this set of slides with name facility operations contol infrastructure kpi dashboard showing resource allocation slides pdf. The topics discussed in these slides are delivery timeline and resources, project financially, resource allocation, days per project. This is a completely editable PowerPoint presentation and is available for immediate download. Download now and impress your audience.
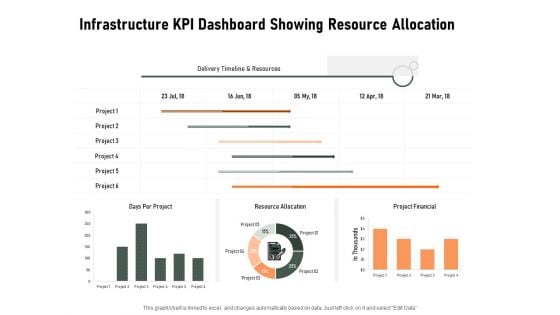
Construction Production Facilities Infrastructure KPI Dashboard Showing Resource Allocation Designs PDF
Presenting this set of slides with name construction production facilities infrastructure kpi dashboard showing resource allocation designs pdf. The topics discussed in these slides are delivery timeline and resources, project financially, resource allocation, days per project. This is a completely editable PowerPoint presentation and is available for immediate download. Download now and impress your audience.
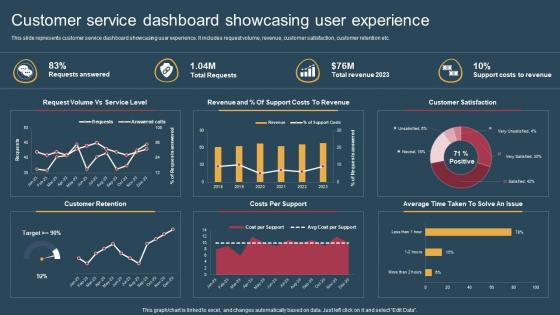
Customer Service Dashboard Conversion Of Customer Support Services Pictures Pdf
This slide represents customer service dashboard showcasing user experience. It includes request volume, revenue, customer satisfaction, customer retention etc. Get a simple yet stunning designed Customer Service Dashboard Conversion Of Customer Support Services Pictures Pdf. It is the best one to establish the tone in your meetings. It is an excellent way to make your presentations highly effective. So, download this PPT today from Slidegeeks and see the positive impacts. Our easy to edit Customer Service Dashboard Conversion Of Customer Support Services Pictures Pdf can be your go to option for all upcoming conferences and meetings. So, what are you waiting for Grab this template today. This slide represents customer service dashboard showcasing user experience. It includes request volume, revenue, customer satisfaction, customer retention etc.
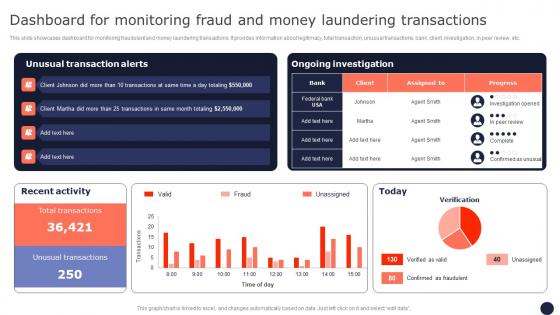
Dashboard For Monitoring Fraud And Money Mitigating Corporate Scams And Robberies Background Pdf
This slide showcases dashboard for monitoring fraudulent and money laundering transactions. It provides information about legitimacy, total transaction, unusual transactions, bank, client, investigation, in peer review, etc. Slidegeeks is here to make your presentations a breeze with Dashboard For Monitoring Fraud And Money Mitigating Corporate Scams And Robberies Background Pdf With our easy-to-use and customizable templates, you can focus on delivering your ideas rather than worrying about formatting. With a variety of designs to choose from, you are sure to find one that suits your needs. And with animations and unique photos, illustrations, and fonts, you can make your presentation pop. So whether you are giving a sales pitch or presenting to the board, make sure to check out Slidegeeks first. This slide showcases dashboard for monitoring fraudulent and money laundering transactions. It provides information about legitimacy, total transaction, unusual transactions, bank, client, investigation, in peer review, etc.
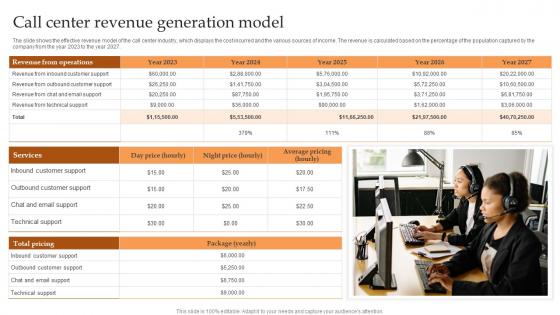
Call Center Revenue Generation Model IT And Tech Support Business Brochure Pdf
The slide shows the effective revenue model of the call center industry, which displays the cost incurred and the various sources of income. The revenue is calculated based on the percentage of the population captured by the company from the year 2023 to the year 2027. Formulating a presentation can take up a lot of effort and time, so the content and message should always be the primary focus. The visuals of the PowerPoint can enhance the presenters message, so our Call Center Revenue Generation Model IT And Tech Support Business Brochure Pdf was created to help save time. Instead of worrying about the design, the presenter can concentrate on the message while our designers work on creating the ideal templates for whatever situation is needed. Slidegeeks has experts for everything from amazing designs to valuable content, we have put everything into Call Center Revenue Generation Model IT And Tech Support Business Brochure Pdf The slide shows the effective revenue model of the call center industry, which displays the cost incurred and the various sources of income. The revenue is calculated based on the percentage of the population captured by the company from the year 2023 to the year 2027.
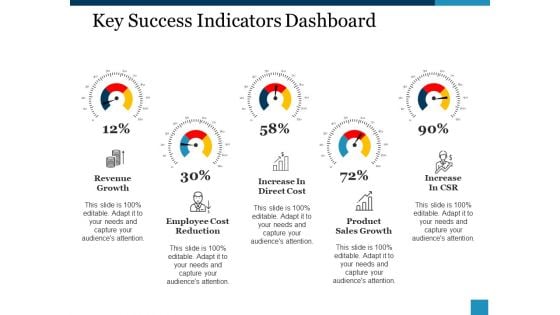
Key Success Indicators Dashboard Ppt PowerPoint Presentation Inspiration Guide
This is a key success indicators dashboard ppt powerpoint presentation inspiration guide. This is a five stage process. The stages in this process are revenue growth, increase in direct cost, increase in csr, employee cost reduction, product, sales growth.
Determine IT Project Portfolio Management Tracking Dashboard Clipart PDF
This slide provides information regarding IT project portfolio management tracking dashboard including details about allocated budget across portfolios, used budget percentage, estimated vs. actual cost, etc. Deliver an awe inspiring pitch with this creative Determine IT Project Portfolio Management Tracking Dashboard Clipart PDF bundle. Topics like Financials, Estimated Cost Across Portfolios, Actual Cost Across Portfolios can be discussed with this completely editable template. It is available for immediate download depending on the needs and requirements of the user.
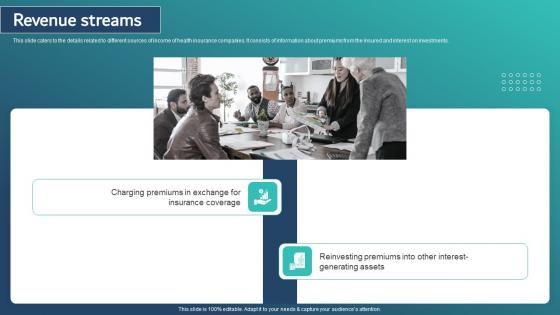
Revenue Streams Healthcare Insurance App Capital Raising Pitch Deck Summary Pdf
This slide caters to the details related to different sources of income of health insurance companies. It consists of information about premiums from the insured and interest on investments. Slidegeeks is here to make your presentations a breeze with Revenue Streams Healthcare Insurance App Capital Raising Pitch Deck Summary Pdf With our easy to use and customizable templates, you can focus on delivering your ideas rather than worrying about formatting. With a variety of designs to choose from, you are sure to find one that suits your needs. And with animations and unique photos, illustrations, and fonts, you can make your presentation pop. So whether you are giving a sales pitch or presenting to the board, make sure to check out Slidegeeks first This slide caters to the details related to different sources of income of health insurance companies. It consists of information about premiums from the insured and interest on investments.

Enterprise KPIS Diagram PowerPoint Topics
Presenting this set of slides with name enterprise kpis diagram powerpoint topics. This is a five stage process. The stages in this process are industry, financials, people, efficiency, corporate. This is a completely editable PowerPoint presentation and is available for immediate download. Download now and impress your audience.

Comparative Assessment Of Capital And Money Markets Mastering Investment Banking Fin SS V
This slide shows matrix which highlights the key differences between capital and money markets. It includes comparison on the basis of nature of market, investment types, liquidity, maturity period, etc. Slidegeeks is here to make your presentations a breeze with Comparative Assessment Of Capital And Money Markets Mastering Investment Banking Fin SS V With our easy-to-use and customizable templates, you can focus on delivering your ideas rather than worrying about formatting. With a variety of designs to choose from, you are sure to find one that suits your needs. And with animations and unique photos, illustrations, and fonts, you can make your presentation pop. So whether you are giving a sales pitch or presenting to the board, make sure to check out Slidegeeks first This slide shows matrix which highlights the key differences between capital and money markets. It includes comparison on the basis of nature of market, investment types, liquidity, maturity period, etc.

Revenue Streams Email And Data Protection Platform Capital Funding Pitch Deck PPT PowerPoint
This slide covers the pricing model for the software company. It includes information about various pricing plans which include facilities such as HIPAA compliant email encryption, inbound emails, inbound mail security protection. This modern and well-arranged Revenue Streams Email And Data Protection Platform Capital Funding Pitch Deck PPT PowerPoint provides lots of creative possibilities. It is very simple to customize and edit with the Powerpoint Software. Just drag and drop your pictures into the shapes. All facets of this template can be edited with Powerpoint, no extra software is necessary. Add your own material, put your images in the places assigned for them, adjust the colors, and then you can show your slides to the world, with an animated slide included. This slide covers the pricing model for the software company. It includes information about various pricing plans which include facilities such as HIPAA compliant email encryption, inbound emails, inbound mail security protection.

Marketing Growth Strategy KPI Dashboard To Evaluate Sales Performance Strategy SS V
The following slide outlines key performance indicator KPI dashboard to monitor sales performance of company. The key metrics covered in slide are total sales by location, monthly sales trend, average revenue AR by clients, etc. This Marketing Growth Strategy KPI Dashboard To Evaluate Sales Performance Strategy SS V is perfect for any presentation, be it in front of clients or colleagues. It is a versatile and stylish solution for organizing your meetings. The Marketing Growth Strategy KPI Dashboard To Evaluate Sales Performance Strategy SS V features a modern design for your presentation meetings. The adjustable and customizable slides provide unlimited possibilities for acing up your presentation. Slidegeeks has done all the homework before launching the product for you. So, do not wait, grab the presentation templates today The following slide outlines key performance indicator KPI dashboard to monitor sales performance of company. The key metrics covered in slide are total sales by location, monthly sales trend, average revenue AR by clients, etc.


 Continue with Email

 Home
Home


