Financial Snapshot
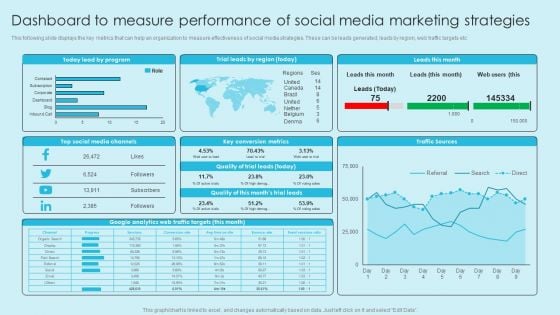
Online Marketing Techniques For Acquiring Clients Dashboard To Measure Performance Of Social Media Guidelines PDF
This following slide displays the key metrics that can help an organization to measure effectiveness of e commerce strategies. These can be revenue generated using e-commerce platform, conversion rates etc. This Online Marketing Techniques For Acquiring Clients Dashboard To Measure Performance Of Social Media Guidelines PDF from Slidegeeks makes it easy to present information on your topic with precision. It provides customization options, so you can make changes to the colors, design, graphics, or any other component to create a unique layout. It is also available for immediate download, so you can begin using it right away. Slidegeeks has done good research to ensure that you have everything you need to make your presentation stand out. Make a name out there for a brilliant performance.
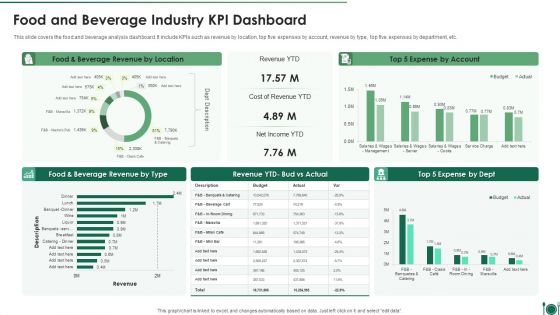
Food And Beverage Industry Kpi Dashboard Professional PDF
This slide covers the food and beverage analysis dashboard. It include KPIs such as revenue by location, top five expenses by account, revenue by type, top five expenses by department, etc.Showcasing this set of slides titled Food And Beverage Industry Kpi Dashboard Professional PDF. The topics addressed in these templates are Food And Beverage Industry KPI Dashboard. All the content presented in this PPT design is completely editable. Download it and make adjustments in color, background, font etc. as per your unique business setting
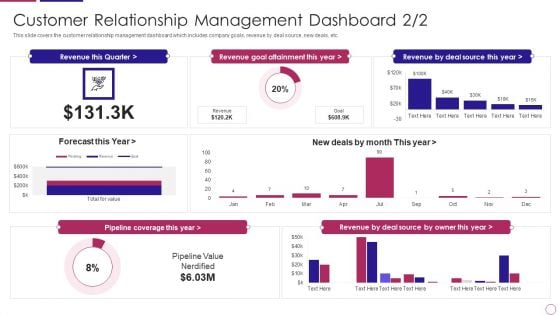
PRM To Streamline Business Processes Customer Relationship Management Dashboard Goal Pictures PDF
This slide covers the customer relationship management dashboard which includes company goals, revenue by deal source, new deals, etc. Deliver an awe inspiring pitch with this creative prm to streamline business processes customer relationship management dashboard goal pictures pdf bundle. Topics like revenue goal attainment, revenue by deal source, revenue by deal source by owner, pipeline coverage can be discussed with this completely editable template. It is available for immediate download depending on the needs and requirements of the user.
KPI Dashboards Per Industry Retail Store Dashboard Ppt PowerPoint Presentation Icon Grid PDF
Deliver an awe-inspiring pitch with this creative kpi dashboards per industry retail store dashboard ppt powerpoint presentation icon grid pdf bundle. Topics like total customers and visitors, avg price and units per transaction, out stock items, sales city, top 5 articles by sold items, top 5 articles revenue can be discussed with this completely editable template. It is available for immediate download depending on the needs and requirements of the user.
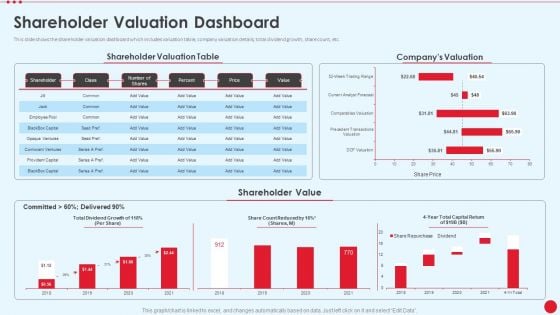
Shareholder Valuation Dashboard Stakeholder Capitalism For Long Term Value Addition Background PDF
This slide shows the shareholder valuation dashboard which includes valuation table, company valuation details, total dividend growth, share count, etc. Deliver and pitch your topic in the best possible manner with this shareholder valuation dashboard stakeholder capitalism for long term value addition background pdf. Use them to share invaluable insights on growth, price, valuation and impress your audience. This template can be altered and modified as per your expectations. So, grab it now.

Global Coordination Dashboard Deliveries By Country Ppt Gallery File Formats PDF
This slide provides information regarding the dashboard that contains indicators to determine the coordination activities in various dispersed facilities in different regions across the globe.Deliver and pitch your topic in the best possible manner with this global coordination dashboard deliveries by country ppt gallery file formats pdf. Use them to share invaluable insights on revenue, costs, profit, shipments and impress your audience. This template can be altered and modified as per your expectations. So, grab it now.
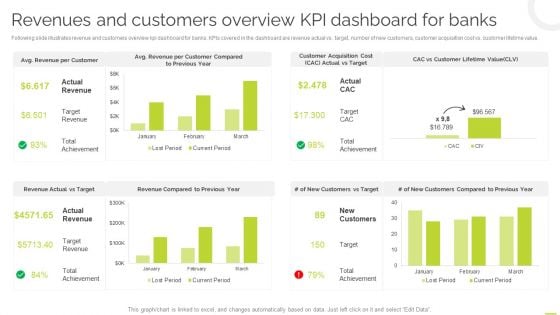
Effective BPM Tool For Business Process Management Revenues And Customers Overview KPI Dashboard For Banks Elements PDF
Following slide illustrates revenue and customers overview kpi dashboard for banks. KPIs covered in the dashboard are revenue actual vs target, number of new customers, customer acquisition cost vs. customer lifetime value. This Effective BPM Tool For Business Process Management Revenues And Customers Overview KPI Dashboard For Banks Elements PDF is perfect for any presentation, be it in front of clients or colleagues. It is a versatile and stylish solution for organizing your meetings. The Effective BPM Tool For Business Process Management Revenues And Customers Overview KPI Dashboard For Banks Elements PDF features a modern design for your presentation meetings. The adjustable and customizable slides provide unlimited possibilities for acing up your presentation. Slidegeeks has done all the homework before launching the product for you. So, do not wait, grab the presentation templates today.

Stock Photo Business Strategy Examples Raise Money With Time Stock Photo Best Photos
Add Force To Your Ambitions With Our stock photo business strategy examples raise money with time stock photo best photos. Your Career Will Bound Away. Acquire The Force With Our Money. Extract The Energy From The Elements Around.
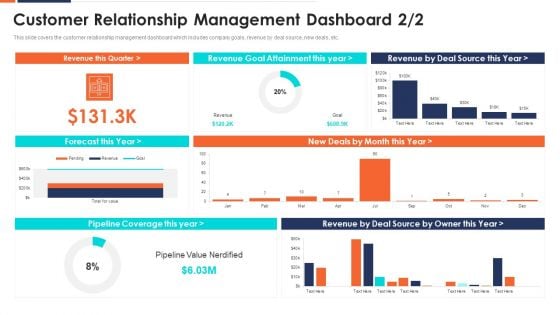
Customer Relationship Management Dashboard Goal Ppt Portfolio Templates PDF
This slide covers the customer relationship management dashboard which includes company goals, revenue by deal source, new deals, etc. Deliver an awe inspiring pitch with this creative customer relationship management dashboard goal ppt portfolio templates pdf bundle. Topics like revenue goal, revenue, source, revenue can be discussed with this completely editable template. It is available for immediate download depending on the needs and requirements of the user.
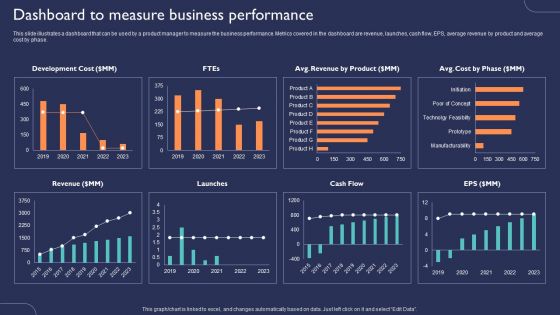
Introduction To New Product Portfolio Dashboard To Measure Business Performance Ppt Ideas Clipart Images PDF
This slide illustrates a dashboard that can be used by a product manager to measure the business performance. Metrics covered in the dashboard are revenue, launches, cash flow, EPS, average revenue by product and average cost by phase. Are you in need of a template that can accommodate all of your creative concepts. This one is crafted professionally and can be altered to fit any style. Use it with Google Slides or PowerPoint. Include striking photographs, symbols, depictions, and other visuals. Fill, move around, or remove text boxes as desired. Test out color palettes and font mixtures. Edit and save your work, or work with colleagues. Download Introduction To New Product Portfolio Dashboard To Measure Business Performance Ppt Ideas Clipart Images PDF and observe how to make your presentation outstanding. Give an impeccable presentation to your group and make your presentation unforgettable.
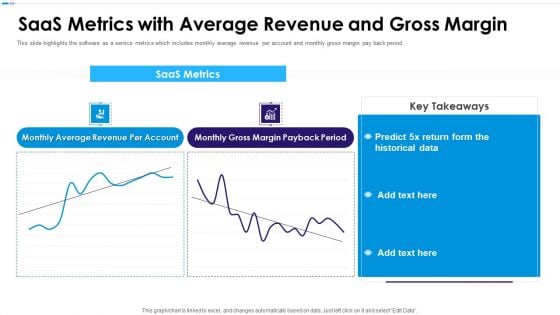
Canvas Capital Raising Elevator Pitch Deck Saas Metrics With Average Revenue And Gross Margin Demonstration PDF
This slide highlights the software as a service metrics which includes monthly average revenue per account and monthly gross margin pay back period.Deliver and pitch your topic in the best possible manner with this Canvas Capital Raising Elevator Pitch Deck Saas Metrics With Average Revenue And Gross Margin Demonstration PDF Use them to share invaluable insights on Average Revenue, Gross Margin, Key Takeaways and impress your audience. This template can be altered and modified as per your expectations. So, grab it now.

Functions Dashboard Performance Revenue Ppt PowerPoint Presentation Complete Deck With Slides
Improve your presentation delivery using this functions dashboard performance revenue ppt powerpoint presentation complete deck with slides. Support your business vision and objectives using this well-structured PPT deck. This template offers a great starting point for delivering beautifully designed presentations on the topic of your choice. Comprising twelve this professionally designed template is all you need to host discussion and meetings with collaborators. Each slide is self-explanatory and equipped with high-quality graphics that can be adjusted to your needs. Therefore, you will face no difficulty in portraying your desired content using this PPT slideshow. This PowerPoint slideshow contains every important element that you need for a great pitch. It is not only editable but also available for immediate download and utilization. The color, font size, background, shapes everything can be modified to create your unique presentation layout. Therefore, download it now.

Reporting System Technology PowerPoint Templates And PowerPoint Backgrounds 0311
Microsoft PowerPoint Template and Background with reporting system of online data for reports Formulate plans with our Reporting System Technology PowerPoint Templates And PowerPoint Backgrounds 0311. Download without worries with our money back guaranteee.
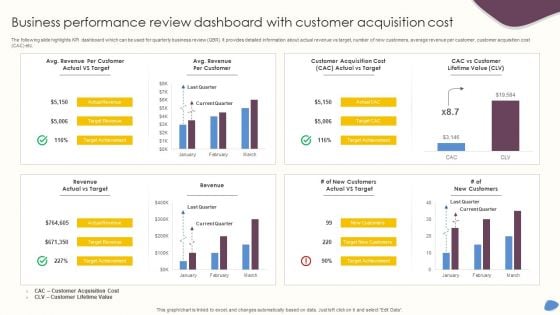
Business Performance Review Dashboard With Customer Acquisition Cost Diagrams PDF
The following slide highlights KPI dashboard which can be used for quarterly business review QBR. It provides detailed information about actual revenue vs target, number of new customers, average revenue per customer, customer acquisition cost CAC etc. Pitch your topic with ease and precision using this Business Performance Review Dashboard With Customer Acquisition Cost Diagrams PDF. This layout presents information on Revenue, Customer Acquisition Cost, Current Quarter. It is also available for immediate download and adjustment. So, changes can be made in the color, design, graphics or any other component to create a unique layout.
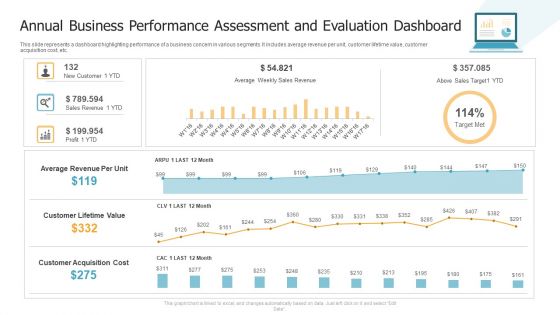
Annual Business Performance Assessment And Evaluation Dashboard Brochure PDF
This slide represents a dashboard highlighting performance of a business concern in various segments. It includes average revenue per unit, customer lifetime value, customer acquisition cost, etc. Showcasing this set of slides titled Annual Business Performance Assessment And Evaluation Dashboard Brochure PDF. The topics addressed in these templates are Profit, Sales Revenue, New Customer. All the content presented in this PPT design is completely editable. Download it and make adjustments in color, background, font etc. as per your unique business setting.
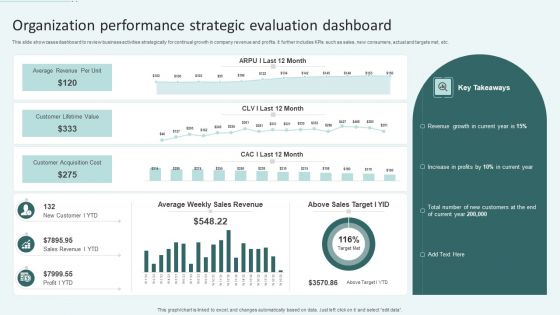
Organization Performance Strategic Evaluation Dashboard Ppt Slides Visual Aids PDF
This slide showcases dashboard to review business activities strategically for continual growth in company revenue and profits. It further includes KPIs such as sales, new consumers, actual and targets met, etc. Showcasing this set of slides titled Organization Performance Strategic Evaluation Dashboard Ppt Slides Visual Aids PDF. The topics addressed in these templates are Average Revenue Per Unit, Customer Lifetime Value, Customer Acquisition Cost. All the content presented in this PPT design is completely editable. Download it and make adjustments in color, background, font etc. as per your unique business setting.
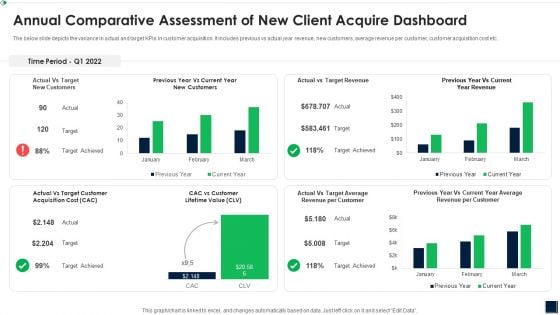
Annual Comparative Assessment Of New Client Acquire Dashboard Topics PDF
The below slide depicts the variance in actual and target KPIs in customer acquisition. It includes previous vs actual year revenue, new customers, average revenue per customer, customer acquisition cost etc. Showcasing this set of slides titled Annual Comparative Assessment Of New Client Acquire Dashboard Topics PDF The topics addressed in these templates are Annual Comparative Assessment OF New Client Acquire Dashboard All the content presented in this PPT design is completely editable. Download it and make adjustments in color, background, font etc. as per your unique business setting.
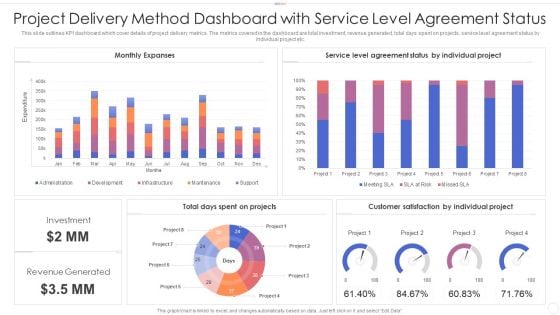
Project Delivery Method Dashboard With Service Level Agreement Status Clipart PDF
This slide outlines KPI dashboard which cover details of project delivery metrics. The metrics covered in the dashboard are total investment, revenue generated, total days spent on projects, service level agreement status by individual project etc. Pitch your topic with ease and precision using this project delivery method dashboard with service level agreement status clipart pdf. This layout presents information on project delivery method dashboard with service level agreement status. It is also available for immediate download and adjustment. So, changes can be made in the color, design, graphics or any other component to create a unique layout.
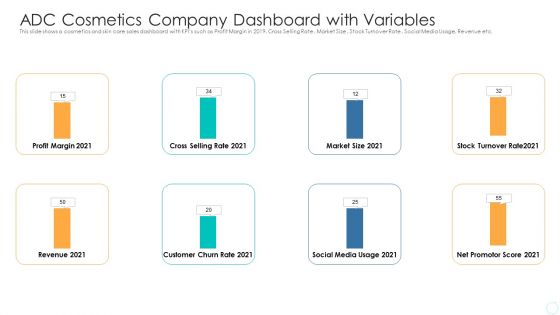
ADC Cosmetics Company Dashboard With Variables Formats PDF
This slide shows a cosmetics and skin care sales dashboard with KPIs such as Profit Margin in 2021, Cross Selling Rate , Market Size, Stock Turnover Rate , Social Media Usage, Revenue etc. Deliver an awe-inspiring pitch with this creative adc cosmetics company dashboard with variables formats pdf bundle. Topics like profit margin, cross selling rate, market size, revenue, social media can be discussed with this completely editable template. It is available for immediate download depending on the needs and requirements of the user.
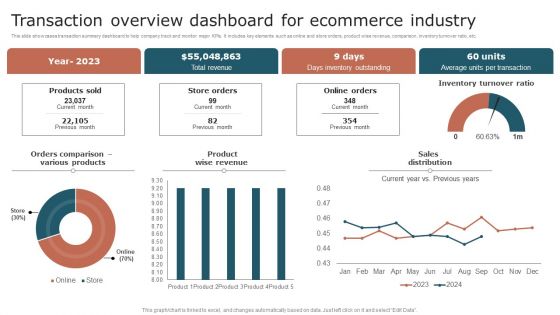
Transaction Overview Dashboard For Ecommerce Industry Summary PDF
This slide showcases transaction summary dashboard to help company track and monitor major KPIs. It includes key elements such as online and store orders, product wise revenue, comparison, inventory turnover ratio, etc. Pitch your topic with ease and precision using this Transaction Overview Dashboard For Ecommerce Industry Summary PDF. This layout presents information on Revenue, Inventory Outstanding, Transaction. It is also available for immediate download and adjustment. So, changes can be made in the color, design, graphics or any other component to create a unique layout.
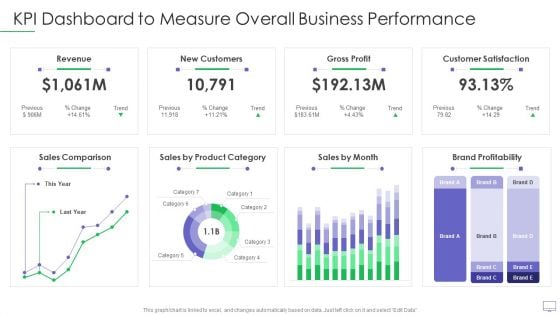
Guide For Software Developers KPI Dashboard To Measure Overall Business Performance Elements PDF
This graph or chart is linked to excel, and changes automatically based on data. Just left click on it and select Edit Data. Deliver an awe inspiring pitch with this creative guide for software developers kpi dashboard to measure overall business performance elements pdf bundle. Topics like revenue new customers, gross profit, customer satisfaction, sales comparison, brand profitability can be discussed with this completely editable template. It is available for immediate download depending on the needs and requirements of the user.
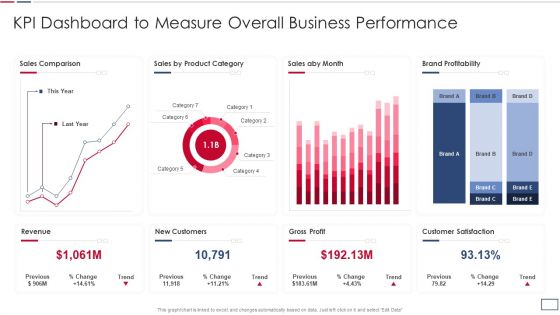
Software Developer Playbook Kpi Dashboard To Measure Overall Business Performance Topics PDF
This graph or chart is linked to excel, and changes automatically based on data. Just left click on it and select Edit Data. Deliver and pitch your topic in the best possible manner with this software developer playbook kpi dashboard to measure overall business performance topics pdf. Use them to share invaluable insights on revenue new customers, gross profit, customer satisfaction, sales comparison and impress your audience. This template can be altered and modified as per your expectations. So, grab it now.
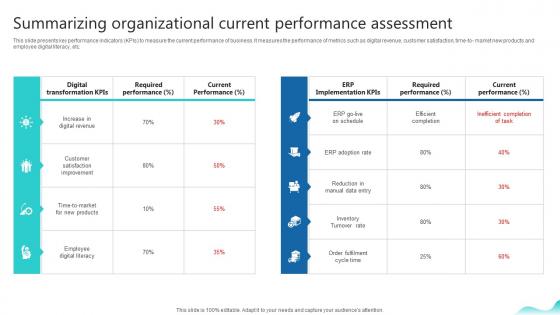
Summarizing Organizational Current Performance Erp And Digital Transformation For Maximizing DT SS V
This slide presents key performance indicators KPIs to measure the current performance of business. It measures the performance of metrics such as digital revenue, customer satisfaction, time-to- market new products and employee digital literacy, etc. Boost your pitch with our creative Summarizing Organizational Current Performance Erp And Digital Transformation For Maximizing DT SS V. Deliver an awe-inspiring pitch that will mesmerize everyone. Using these presentation templates you will surely catch everyones attention. You can browse the ppts collection on our website. We have researchers who are experts at creating the right content for the templates. So you do not have to invest time in any additional work. Just grab the template now and use them. This slide presents key performance indicators KPIs to measure the current performance of business. It measures the performance of metrics such as digital revenue, customer satisfaction, time-to- market new products and employee digital literacy, etc.
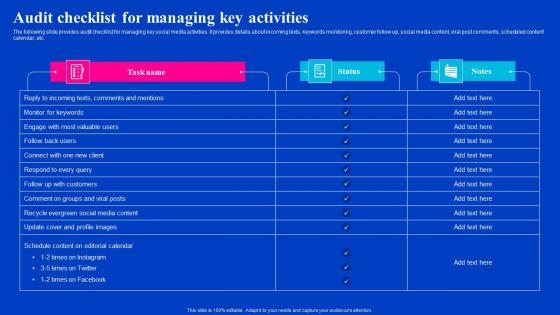
Audit Checklist For Managing Key Activities Viral Video Outreach Plan Clipart Pdf
The following slide provides audit checklist for managing key social media activities. It provides details about incoming texts, keywords monitoring, customer follow up, social media content, viral post comments, scheduled content calendar, etc. Make sure to capture your audiences attention in your business displays with our gratis customizable Audit Checklist For Managing Key Activities Viral Video Outreach Plan Clipart Pdf. These are great for business strategies, office conferences, capital raising or task suggestions. If you desire to acquire more customers for your tech business and ensure they stay satisfied, create your own sales presentation with these plain slides. The following slide provides audit checklist for managing key social media activities. It provides details about incoming texts, keywords monitoring, customer follow up, social media content, viral post comments, scheduled content calendar, etc.
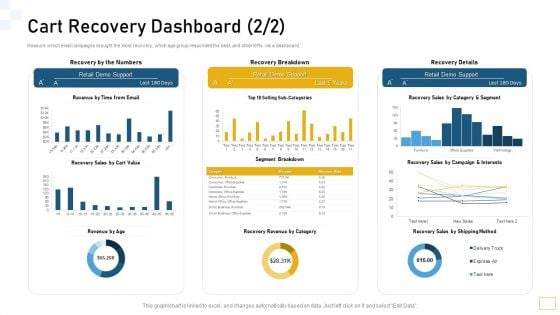
Guidelines Customer Conduct Assessment Cart Recovery Dashboard Introduction PDF
Measure which email campaigns brought the most recovery, which age group responded the best, and other KPIs via a dashboard. Deliver an awe-inspiring pitch with this creative guidelines customer conduct assessment cart recovery dashboard introduction pdf bundle. Topics like recovery revenue, recovery sales, segment breakdown can be discussed with this completely editable template. It is available for immediate download depending on the needs and requirements of the user.
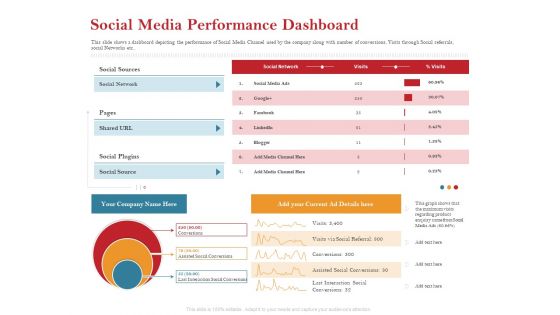
Pitch Deck For Raising Capital For Inorganic Growth Social Media Performance Dashboard Mockup PDF
This slide shows a dashboard depicting the performance of Social Media Channel used by the company along with number of conversions, Visits through Social referrals, social Networks etc. Presenting pitch deck for raising capital for inorganic growth social media performance dashboard mockup pdf to provide visual cues and insights. Share and navigate important information on three stages that need your due attention. This template can be used to pitch topics like social sources, social media. In addtion, this PPT design contains high resolution images, graphics, etc, that are easily editable and available for immediate download.
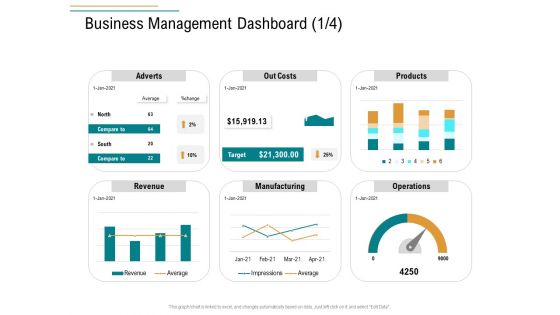
Business Operations Assessment Business Management Dashboard Ppt Infographic Template PDF
Deliver an awe-inspiring pitch with this creative business operations assessment business management dashboard ppt infographic template pdf bundle. Topics like adverts, out costs, products, operations, manufacturing, revenue can be discussed with this completely editable template. It is available for immediate download depending on the needs and requirements of the user.
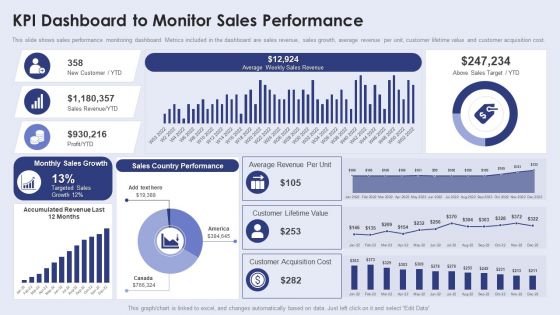
Creating New Product Launch Campaign Strategy Kpi Dashboard To Monitor Sales Performance Introduction PDF
This slide shows sales performance monitoring dashboard. Metrics included in the dashboard are sales revenue, sales growth, average revenue per unit, customer lifetime value and customer acquisition cost. This modern and well arranged Creating New Product Launch Campaign Strategy Kpi Dashboard To Monitor Sales Performance Introduction PDF provides lots of creative possibilities. It is very simple to customize and edit with the Powerpoint Software. Just drag and drop your pictures into the shapes. All facets of this template can be edited with Powerpoint no extra software is necessary. Add your own material, put your images in the places assigned for them, adjust the colors, and then you can show your slides to the world, with an animated slide included.
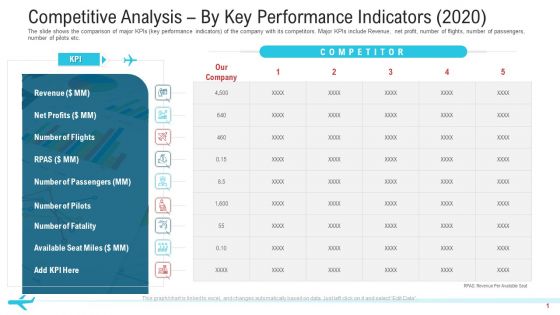
Competitive Analysis By Key Performance Indicators 2020 Designs PDF
The slide shows the comparison of major KPIs key performance indicators of the company with its competitors. Major KPIs include Revenue, net profit, number of flights, number of passengers, number of pilots etc.Deliver an awe-inspiring pitch with this creative competitive analysis by key performance indicators 2020 designs pdf. bundle. Topics like net profits, revenue, number of passengers can be discussed with this completely editable template. It is available for immediate download depending on the needs and requirements of the user.
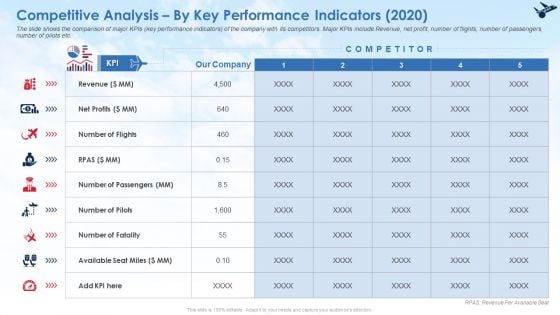
Competitive Analysis By Key Performance Indicators 2020 Professional PDF
The slide shows the comparison of major KPIs key performance indicators of the company with its competitors. Major KPIs include Revenue, net profit, number of flights, number of passengers, number of pilots etc. Deliver an awe inspiring pitch with this creative competitive analysis by key performance indicators 2020 professional pdf bundle. Topics like revenue, net profits can be discussed with this completely editable template. It is available for immediate download depending on the needs and requirements of the user.
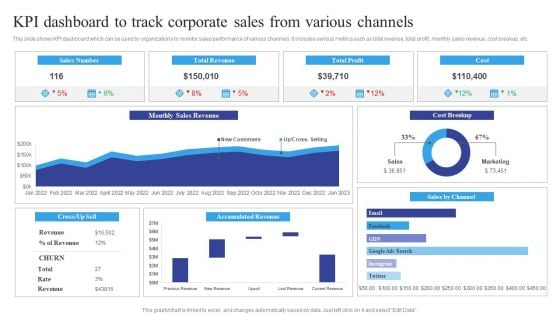
KPI Dashboard To Track Corporate Sales From Various Channels Information PDF
This slide shows KPI dashboard which can be used by organizations to monitor sales performance of various channels. It includes various metrics such as total revenue, total profit, monthly sales revenue, cost breakup, etc. Showcasing this set of slides titled KPI Dashboard To Track Corporate Sales From Various Channels Information PDF. The topics addressed in these templates are Track Corporate Sales, Various Channels. All the content presented in this PPT design is completely editable. Download it and make adjustments in color, background, font etc. as per your unique business setting.
Performance Analysis Of New Product Development Product Performance Dashboards Icons PDF
The following slide displays the dashboard which highlights the performance of the product, multiple metrics such as Revenues, New customer, gross profit, customer satisfaction and global sales breakdown. Deliver and pitch your topic in the best possible manner with this performance analysis of new product development product performance dashboards icons pdf. Use them to share invaluable insights on revenue, sales comparison, customer satisfaction, gross profit, new customers, sale by product category and impress your audience. This template can be altered and modified as per your expectations. So, grab it now.

Brand Promotion Communication Strategy Dashboard For Analyzing Brand Perception Introduction PDF
This slide covers the dashboard for tracking brand reputation. It also includes metrics such as new customer lifetime value, customer acquisition cost, target met, above sales target, average weekly sales revenue, etc. Deliver an awe inspiring pitch with this creative Brand Promotion Communication Strategy Dashboard For Analyzing Brand Perception Introduction PDF bundle. Topics like New customer YTD, Sales revenue YTD, Profit YTD can be discussed with this completely editable template. It is available for immediate download depending on the needs and requirements of the user.
Consumer Journey Mapping Techniques Loyalty Program Performance Tracking Dashboard Portrait PDF
This slide covers the KPI dashboard for analyzing customer loyalty campaign results. It includes metrics such as revenue, liability, NQP accrued, transaction count, members, redemption ratio, etc. Pitch your topic with ease and precision using this Consumer Journey Mapping Techniques Loyalty Program Performance Tracking Dashboard Portrait PDF. This layout presents information on Transaction Count, Revenue, Redemption Ratio. It is also available for immediate download and adjustment. So, changes can be made in the color, design, graphics or any other component to create a unique layout.
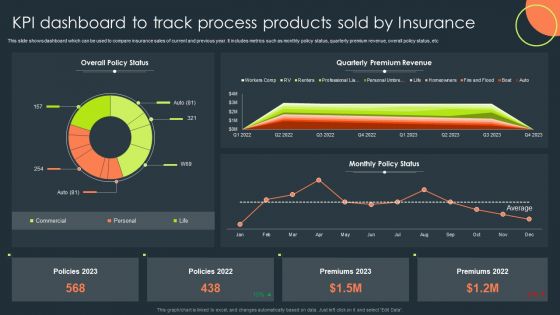
KPI Dashboard To Track Process Products Sold By Insurance Topics PDF
This slide shows dashboard which can be used to compare insurance sales of current and previous year. It includes metrics such as monthly policy status, quarterly premium revenue, overall policy status, etc. Pitch your topic with ease and precision using this KPI Dashboard To Track Process Products Sold By Insurance Topics PDF. This layout presents information on Overall Policy Status, Quarterly Premium Revenue, Monthly Policy Status. It is also available for immediate download and adjustment. So, changes can be made in the color, design, graphics or any other component to create a unique layout.
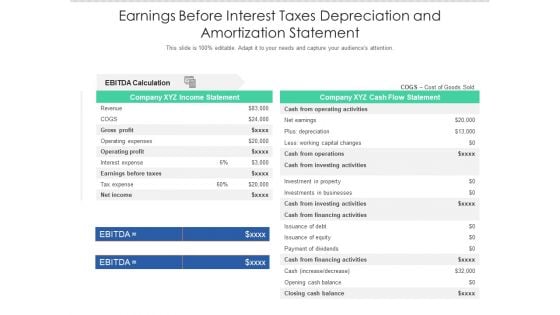
Earnings Before Interest Taxes Depreciation And Amortization Statement Ppt PowerPoint Presentation Pictures Introduction PDF
Showcasing this set of slides titled earnings before interest taxes depreciation and amortization statement ppt powerpoint presentation pictures introduction pdf. The topics addressed in these templates are revenue, gross profit, operating profit. All the content presented in this PPT design is completely editable. Download it and make adjustments in color, background, font etc. as per your unique business setting.
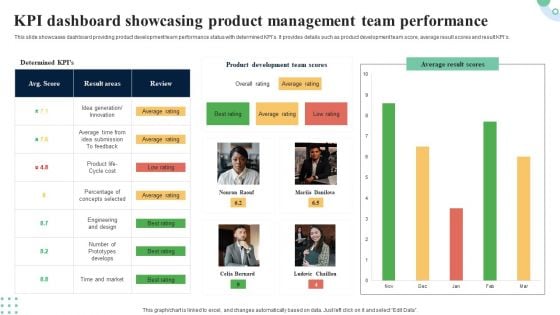
KPI Dashboard Showcasing Product Management Team Performance Demonstration PDF
This slide represents dashboard showcasing revenue assessment for new product development. It projects information regarding revenue breakdown, revenue per product, time to marketing and win or loss analysis. Showcasing this set of slides titled KPI Dashboard Showcasing Product Management Team Performance Demonstration PDF. The topics addressed in these templates are Revenue Per Project, Revenue Breakdown, Loss Analysis. All the content presented in this PPT design is completely editable. Download it and make adjustments in color, background, font etc. as per your unique business setting.
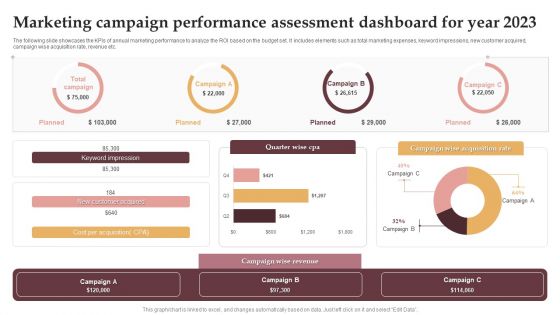
Marketing Campaign Performance Assessment Dashboard For Year 2023 Download PDF
The following slide showcases the KPIs of annual marketing performance to analyze the ROI based on the budget set. It includes elements such as total marketing expenses, keyword impressions, new customer acquired, campaign wise acquisition rate, revenue etc. Showcasing this set of slides titled Marketing Campaign Performance Assessment Dashboard For Year 2023 Download PDF. The topics addressed in these templates are Keyword Impression, New Customer Acquired, Campaign Wise Revenue. All the content presented in this PPT design is completely editable. Download it and make adjustments in color, background, font etc. as per your unique business setting.
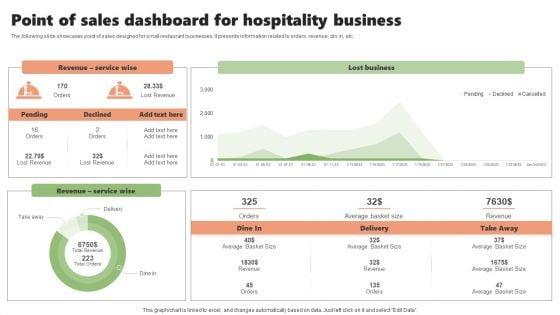
Point Of Sales Dashboard For Hospitality Business Slides PDF
The following slide showcases point of sales designed for small restaurant businesses. It presents information related to orders, revenue, din in, etc. Showcasing this set of slides titled Point Of Sales Dashboard For Hospitality Business Slides PDF. The topics addressed in these templates are Revenue Service Wise, Lost Business, Hospitality Business. All the content presented in this PPT design is completely editable. Download it and make adjustments in color, background, font etc. as per your unique business setting.
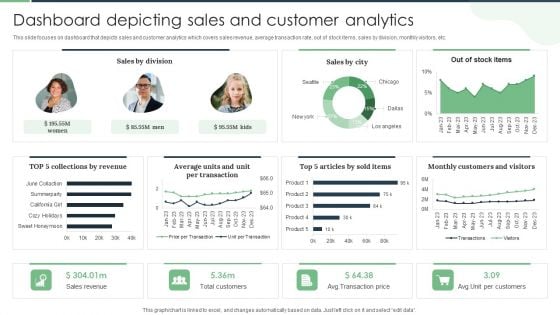
Dashboard Depicting Sales And Customer Analytics Professional PDF
This slide focuses on dashboard that depicts sales and customer analytics which covers sales revenue, average transaction rate, out of stock items, sales by division, monthly visitors, etc. Make sure to capture your audiences attention in your business displays with our gratis customizable Dashboard Depicting Sales And Customer Analytics Professional PDF. These are great for business strategies, office conferences, capital raising or task suggestions. If you desire to acquire more customers for your tech business and ensure they stay satisfied, create your own sales presentation with these plain slides.
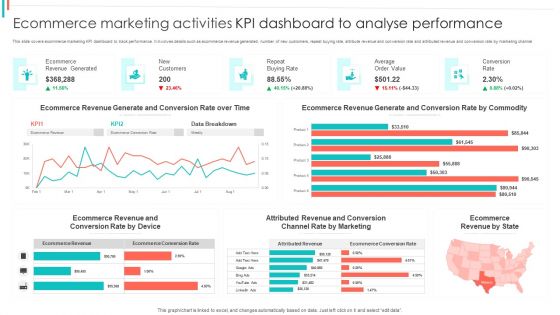
Ecommerce Marketing Activities KPI Dashboard To Analyse Performance Guidelines PDF
This slide covers ecommerce marketing KPI dashboard to track performance. It involves details such as ecommerce revenue generated, number of new customers, repeat buying rate, attribute revenue and conversion rate and attributed revenue and conversion rate by marketing channel.Pitch your topic with ease and precision using this Ecommerce Marketing Activities KPI Dashboard To Analyse Performance Guidelines PDF. This layout presents information on Revenue Generated, Ecommerce Revenue, Generate Conversion. It is also available for immediate download and adjustment. So, changes can be made in the color, design, graphics or any other component to create a unique layout.
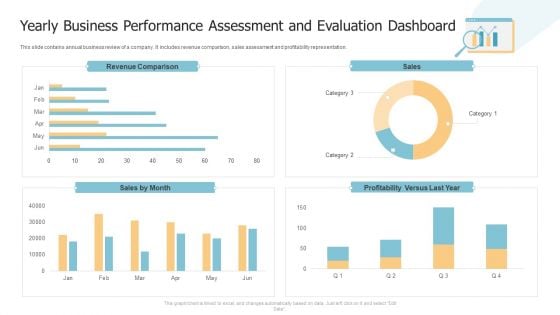
Yearly Business Performance Assessment And Evaluation Dashboard Structure PDF
This slide contains annual business review of a company. It includes revenue comparison, sales assessment and profitability representation. Showcasing this set of slides titled Yearly Business Performance Assessment And Evaluation Dashboard Structure PDF. The topics addressed in these templates are Revenue Comparison, Sales, Profitability. All the content presented in this PPT design is completely editable. Download it and make adjustments in color, background, font etc. as per your unique business setting.
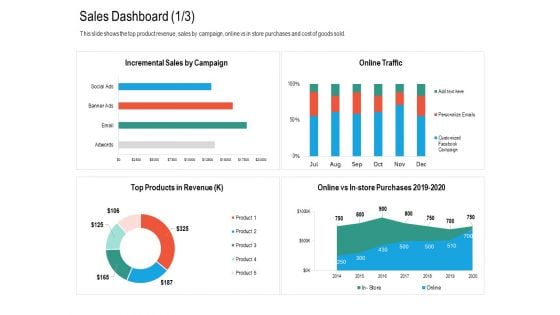
Upselling Strategies For Business Sales Dashboard Cost Rules PDF
This slide shows the top product revenue, sales by campaign, online vs in store purchases and cost of goods sold. Deliver and pitch your topic in the best possible manner with thisupselling strategies for business sales dashboard cost rules pdf. Use them to share invaluable insights on traffic, revenue, incremental, sales, campaign and impress your audience. This template can be altered and modified as per your expectations. So, grab it now.
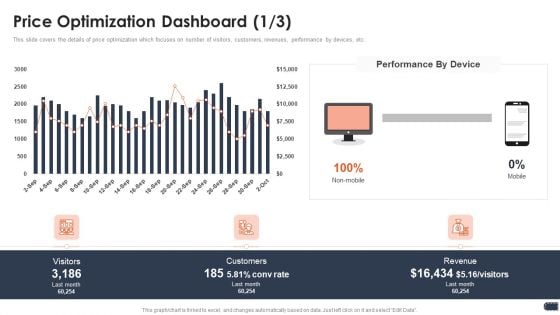
Business Pricing Model Price Optimization Dashboard Customers Information PDF
This slide covers the details of price optimization which focuses on number of visitors, customers, revenues, performance by devices, etc. Deliver and pitch your topic in the best possible manner with this business pricing model price optimization dashboard customers information pdf. Use them to share invaluable insights on visitors, customers, revenue and impress your audience. This template can be altered and modified as per your expectations. So, grab it now.
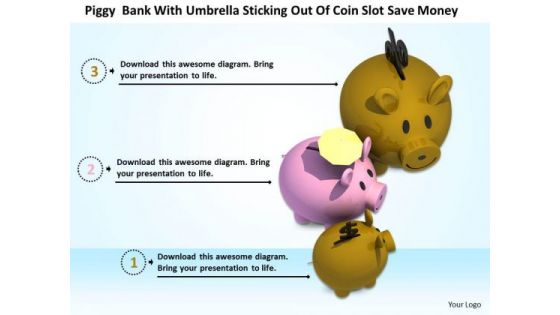
Stock Photo Piggy Bank With Currency Symbols And Umbrella PowerPoint Slide
This image slide displays piggy banks for saving concept. This image slide has been crafted with graphic of colorful piggy banks with umbrella, percentage symbol and dollar symbol. Use this imager slide, in your presentations to express views on monetary savings, finance and protection. This image slide will enhance the quality of your presentations.
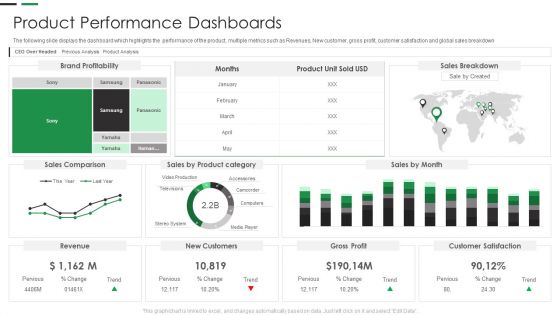
Evaluating New Commodity Impact On Market Product Performance Dashboards Template PDF
The following slide displays the dashboard which highlights the performance of the product, multiple metrics such as Revenues, New customer, gross profit, customer satisfaction and global sales breakdown Deliver and pitch your topic in the best possible manner with this Evaluating New Commodity Impact On Market Product Performance Dashboards Template PDF Use them to share invaluable insights on Brand Profitability, Customer Satisfaction, Gross Profit and impress your audience. This template can be altered and modified as per your expectations. So, grab it now.
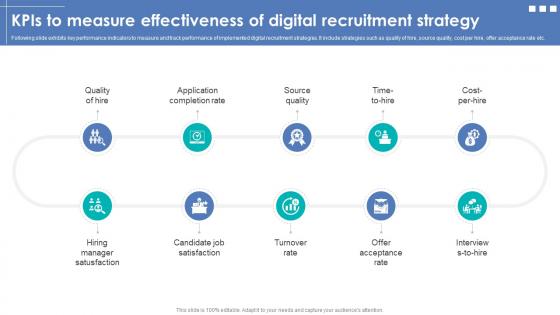
Integrating Automation For Effective Business Kpis To Measure Effectiveness Of Digital Recruitment
Following slide exhibits key performance indicators to measure and track performance of implemented digital recruitment strategies. It include strategies such as quality of hire, source quality, cost per hire, offer acceptance rate etc. Make sure to capture your audiences attention in your business displays with our gratis customizable Integrating Automation For Effective Business Kpis To Measure Effectiveness Of Digital Recruitment. These are great for business strategies, office conferences, capital raising or task suggestions. If you desire to acquire more customers for your tech business and ensure they stay satisfied, create your own sales presentation with these plain slides. Following slide exhibits key performance indicators to measure and track performance of implemented digital recruitment strategies. It include strategies such as quality of hire, source quality, cost per hire, offer acceptance rate etc.

Win Trophies Earn Coins PowerPoint Templates And PowerPoint Themes 0912
Win Trophies Earn Coins PowerPoint Templates And PowerPoint Themes 0912-Microsoft Powerpoint Templates and Background with trophy cup and coins-Trophy cup and coins, competition, success, sports, money, symbol Tackle the issue in it's entirety. Put up the overall picture with our Win Trophies Earn Coins PowerPoint Templates And PowerPoint Themes 0912.
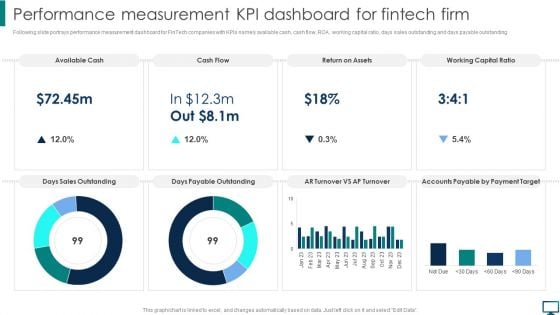
Performance Measurement KPI Dashboard For Fintech Firm Topics PDF
Following slide portrays performance measurement dashboard for FinTech companies with KPIs namely available cash, cash flow, ROA, working capital ratio, days sales outstanding and days payable outstanding. Create an editable Performance Measurement KPI Dashboard For Fintech Firm Topics PDF that communicates your idea and engages your audience. Whether you are presenting a business or an educational presentation, pre designed presentation templates help save time. Performance Measurement KPI Dashboard For Fintech Firm Topics PDF is highly customizable and very easy to edit, covering many different styles from creative to business presentations. Slidegeeks has creative team members who have crafted amazing templates. So, go and get them without any delay.
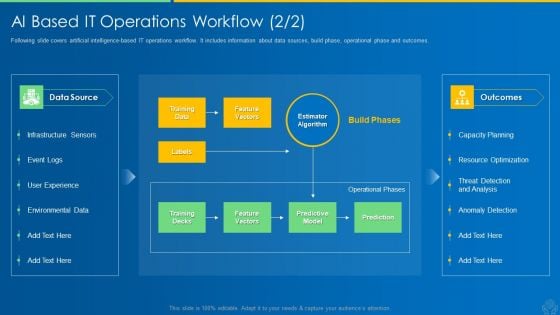
AI And ML Driving Monetary Value For Organization AI Based IT Operations Workflow Prediction Inspiration PDF
Following slide covers artificial intelligence-based IT operations workflow. It includes information about data sources, build phase, operational phase and outcomes. Deliver and pitch your topic in the best possible manner with this ai and ml driving monetary value for organization ai based it operations workflow prediction inspiration pdf. Use them to share invaluable insights on data source, infrastructure sensors, outcomes, capacity planning, resource optimization and impress your audience. This template can be altered and modified as per your expectations. So, grab it now.

Expert Systems Business Intelligence KPI Dashboard Working Formats PDF
Deliver an awe inspiring pitch with this creative expert systems business intelligence kpi dashboard working formats pdf bundle. Topics like checking s savings, working capital can be discussed with this completely editable template. It is available for immediate download depending on the needs and requirements of the user.
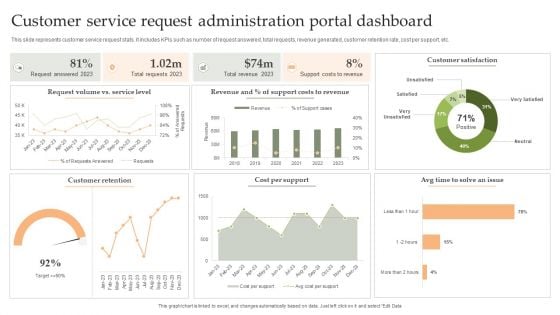
Customer Service Request Administration Portal Dashboard Download PDF
This slide represents customer service request stats. It includes KPIs such as number of request answered, total requests, revenue generated, customer retention rate, cost per support, etc. Showcasing this set of slides titled Customer Service Request Administration Portal Dashboard Download PDF. The topics addressed in these templates are Cost Per Support, Customer Retention, Customer Satisfaction. All the content presented in this PPT design is completely editable. Download it and make adjustments in color, background, font etc. as per your unique business setting.
Key Performance Indicators For Smarketing Ppt Icon Graphic Images PDF
This slide shows various KPIs which can be used to measure marketing and sales alignment. These are overall revenue, sales cycle length, marketing qualified leads, etc. Presenting Key Performance Indicators For Smarketing Ppt Icon Graphic Images PDF to dispense important information. This template comprises one stages. It also presents valuable insights into the topics including KPIs, Overall Revenue, Sales Cycle Length. This is a completely customizable PowerPoint theme that can be put to use immediately. So, download it and address the topic impactfully.
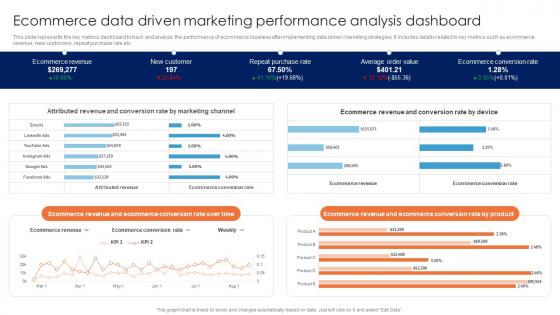
Ecommerce Data Driven Marketing Performance Guide For Data Driven Advertising Brochure Pdf
This slide represents the key metrics dashboard to track and analyze the performance of ecommerce business after implementing data driven marketing strategies. It includes details related to key metrics such as ecommerce revenue, new customers, repeat purchase rate etc.Here you can discover an assortment of the finest PowerPoint and Google Slides templates. With these templates, you can create presentations for a variety of purposes while simultaneously providing your audience with an eye-catching visual experience. Download Ecommerce Data Driven Marketing Performance Guide For Data Driven Advertising Brochure Pdf to deliver an impeccable presentation. These templates will make your job of preparing presentations much quicker, yet still, maintain a high level of quality. Slidegeeks has experienced researchers who prepare these templates and write high-quality content for you. Later on, you can personalize the content by editing the Ecommerce Data Driven Marketing Performance Guide For Data Driven Advertising Brochure Pdf. This slide represents the key metrics dashboard to track and analyze the performance of ecommerce business after implementing data driven marketing strategies. It includes details related to key metrics such as ecommerce revenue, new customers, repeat purchase rate etc.
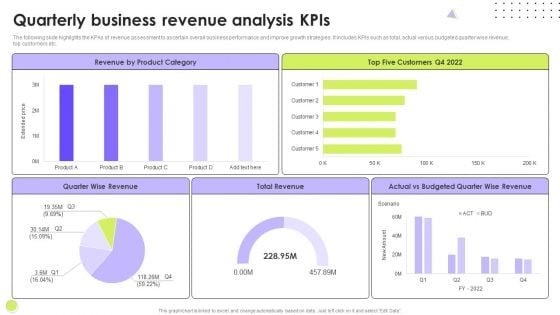
Quarterly Business Revenue Analysis Kpis Slides PDF
The following slide highlights the KPAs of revenue assessment to ascertain overall business performance and improve growth strategies. It includes KPIs such as total, actual versus budgeted quarter wise revenue, top customers etc. Showcasing this set of slides titled Quarterly Business Revenue Analysis Kpis Slides PDF. The topics addressed in these templates are Quarter Wise Revenue, Customers, Budgeted Quarter. All the content presented in this PPT design is completely editable. Download it and make adjustments in color, background, font etc. as per your unique business setting.
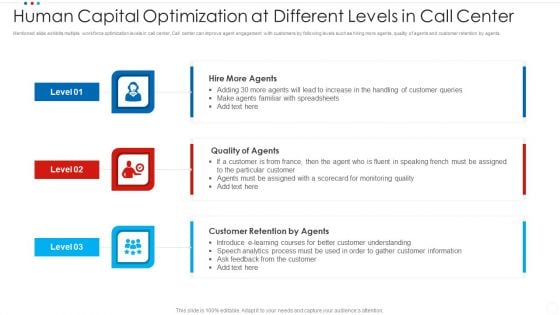
Human Capital Optimization At Different Levels In Call Center Microsoft PDF
Persuade your audience using this human capital optimization at different levels in call center microsoft pdf. This PPT design covers three stages, thus making it a great tool to use. It also caters to a variety of topics including quality of agents, customer retention by agents, hire more agents. Download this PPT design now to present a convincing pitch that not only emphasizes the topic but also showcases your presentation skills.
B2B Sales Representatives Performance Tracking Dashboard Elements PDF
This slide provides information regarding B2B sales representatives performance tracking dashboard to measure leads by region, revenue breakdown, top performers by leads, revenues, etc. Deliver an awe inspiring pitch with this creative B2B Sales Representatives Performance Tracking Dashboard Elements PDF bundle. Topics like Revenue Actual, Sales Representatives Performance, Tracking Dashboard can be discussed with this completely editable template. It is available for immediate download depending on the needs and requirements of the user.
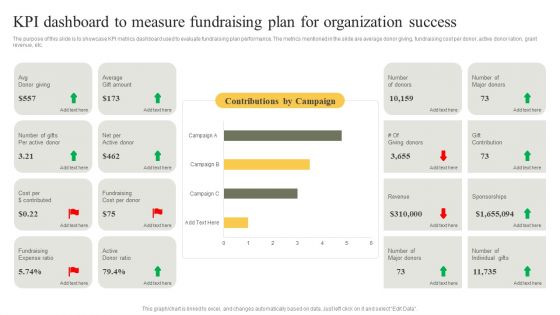
KPI Dashboard To Measure Fundraising Plan For Organization Success Infographics PDF
The purpose of this slide is to showcase KPI metrics dashboard used to evaluate fundraising plan performance. The metrics mentioned in the slide are average donor giving, fundraising cost per donor, active donor ration, grant revenue, etc. Showcasing this set of slides titled KPI Dashboard To Measure Fundraising Plan For Organization Success Infographics PDF. The topics addressed in these templates are Fundraising Cost, Average, Ratio. All the content presented in this PPT design is completely editable. Download it and make adjustments in color, background, font etc. as per your unique business setting.

University Marketing Guide Set Kpis To Monitor And Review Marketing Performance Strategy SS V
The following slide depicts some KPIs to analyse university marketing performance and determine deviations. It includes elements such as enrolments, retention rate, student satisfaction, cost per acquisition, revenue per student etc. Slidegeeks is here to make your presentations a breeze with University Marketing Guide Set Kpis To Monitor And Review Marketing Performance Strategy SS V With our easy-to-use and customizable templates, you can focus on delivering your ideas rather than worrying about formatting. With a variety of designs to choose from, you are sure to find one that suits your needs. And with animations and unique photos, illustrations, and fonts, you can make your presentation pop. So whether you are giving a sales pitch or presenting to the board, make sure to check out Slidegeeks first The following slide depicts some KPIs to analyse university marketing performance and determine deviations. It includes elements such as enrolments, retention rate, student satisfaction, cost per acquisition, revenue per student etc.
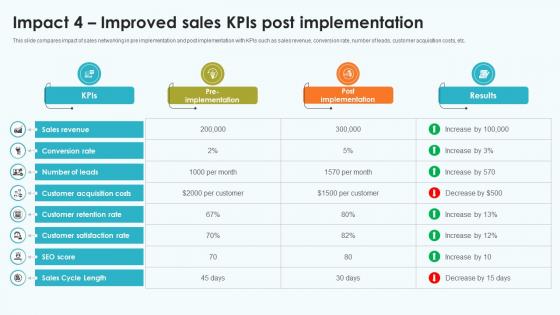
Elevating Sales Networks Impact 4 Improved Sales Kpis Post Implementation SA SS V
This slide compares impact of sales networking in pre implementation and post implementation with KPIs such as sales revenue, conversion rate, number of leads, customer acquisition costs, etc. The Elevating Sales Networks Impact 4 Improved Sales Kpis Post Implementation SA SS V is a compilation of the most recent design trends as a series of slides. It is suitable for any subject or industry presentation, containing attractive visuals and photo spots for businesses to clearly express their messages. This template contains a variety of slides for the user to input data, such as structures to contrast two elements, bullet points, and slides for written information. Slidegeeks is prepared to create an impression. This slide compares impact of sales networking in pre implementation and post implementation with KPIs such as sales revenue, conversion rate, number of leads, customer acquisition costs, etc.


 Continue with Email

 Home
Home


