Financial Snapshot
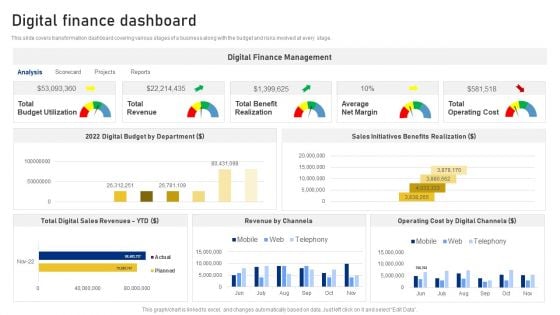
Reshaping Business In Digital Digital Finance Dashboard Topics PDF
This slide covers transformation dashboard covering various stages of a business along with the budget and risks involved at every stage. Deliver and pitch your topic in the best possible manner with this Reshaping Business In Digital Digital Finance Dashboard Topics PDF. Use them to share invaluable insights on Digital Finance Management, Total Digital, Sales Revenues and impress your audience. This template can be altered and modified as per your expectations. So, grab it now.
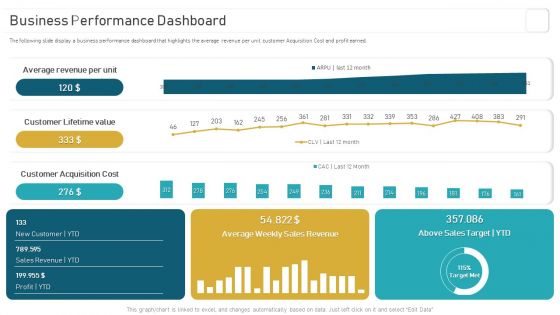
Deploying And Managing Recurring Business Performance Dashboard Sample PDF
The following slide display a business performance dashboard that highlights the average revenue per unit, customer Acquisition Cost and profit earned. There are so many reasons you need a Deploying And Managing Recurring Business Performance Dashboard Sample PDF. The first reason is you cant spend time making everything from scratch, Thus, Slidegeeks has made presentation templates for you too. You can easily download these templates from our website easily.
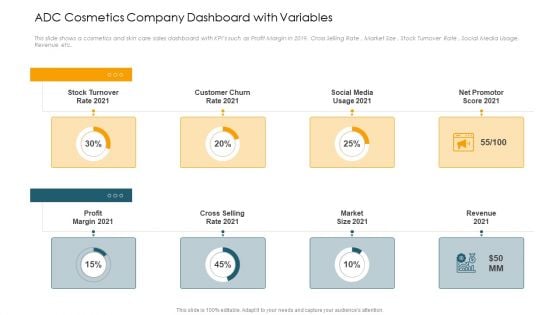
ADC Cosmetics Company Dashboard With Variables Ppt Backgrounds PDF
This slide shows a cosmetics and skin care sales dashboard with KPIs such as Profit Margin in 2019, Cross Selling Rate , Market Size , Stock Turnover Rate , Social Media Usage, Revenue etc.Presenting adc cosmetics company dashboard with variables ppt backgrounds pdf. to provide visual cues and insights. Share and navigate important information on eight stages that need your due attention. This template can be used to pitch topics like stock turnover rate 2021, social media usage 2021, net promotor score 2021. In addtion, this PPT design contains high resolution images, graphics, etc, that are easily editable and available for immediate download.
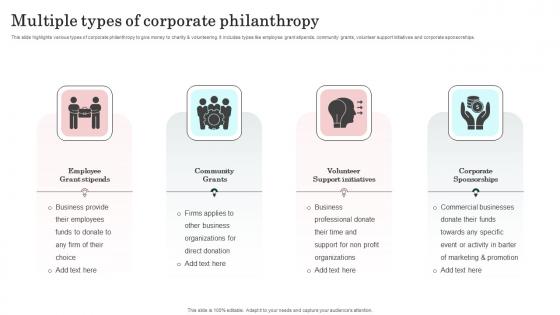
Multiple Types Of Corporate Philanthropy Pictures Pdf
This slide highlights various types of corporate philanthropy to give money to charity and volunteering. It includes types like employee grant stipends, community grants, volunteer support initiatives and corporate sponsorships. Pitch your topic with ease and precision using this Multiple Types Of Corporate Philanthropy Pictures Pdf. This layout presents information on Employee Grant Stipends, Community Grants, Volunteer Support Initiatives. It is also available for immediate download and adjustment. So, changes can be made in the color, design, graphics or any other component to create a unique layout. This slide highlights various types of corporate philanthropy to give money to charity and volunteering. It includes types like employee grant stipends, community grants, volunteer support initiatives and corporate sponsorships.
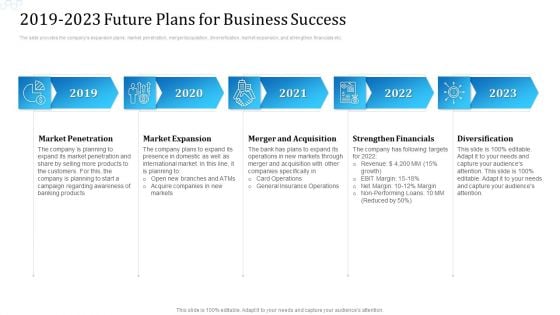
Investor Deck For Procuring Funds From Money Market 2019 To 2023 Future Plans For Business Success Pictures PDF
Presenting investor deck for procuring funds from money market 2019 to 2023 future plans for business success pictures pdf to provide visual cues and insights. Share and navigate important information on three stages that need your due attention. This template can be used to pitch topics like 30 60 90 days plan. In addtion, this PPT design contains high resolution images, graphics, etc, that are easily editable and available for immediate download.
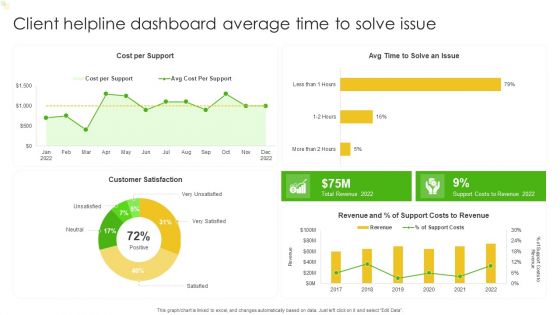
Client Helpline Dashboard Average Time To Solve Issue Ppt Portfolio Visuals PDF
This graph or chart is linked to excel, and changes automatically based on data. Just left click on it and select Edit Data. Showcasing this set of slides titled Client Helpline Dashboard Average Time To Solve Issue Ppt Portfolio Visuals PDF. The topics addressed in these templates are Cost Per Support, Customer Satisfaction, Costs To Revenue. All the content presented in this PPT design is completely editable. Download it and make adjustments in color, background, font etc. as per your unique business setting.
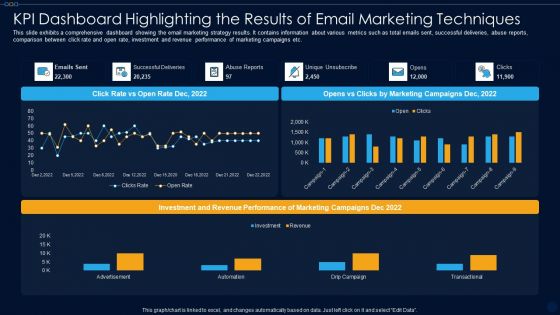
KPI Dashboard Highlighting The Results Of Email Marketing Techniques Ppt PowerPoint Presentation File Format PDF
This slide exhibits a comprehensive dashboard showing the email marketing strategy results. It contains information about various metrics such as total emails sent, successful deliveries, abuse reports, comparison between click rate and open rate, investment and revenue performance of marketing campaigns etc. Showcasing this set of slides titled kpi dashboard highlighting the results of email marketing techniques ppt powerpoint presentation file format pdf. The topics addressed in these templates are advertisement, automation, drip campaign, transactional. All the content presented in this PPT design is completely editable. Download it and make adjustments in color, background, font etc. as per your unique business setting.
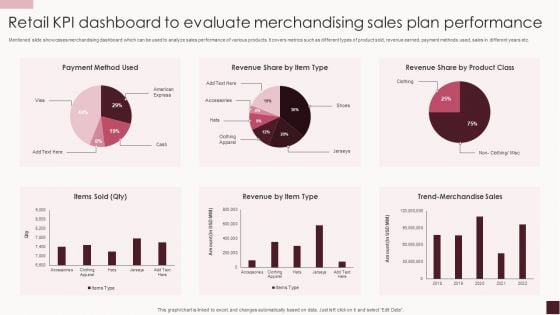
Retail KPI Dashboard To Evaluate Merchandising Sales Plan Performance Rules PDF
Mentioned slide showcases merchandising dashboard which can be used to analyze sales performance of various products. It covers metrics such as different types of product sold, revenue earned, payment methods used, sales in different years etc.Showcasing this set of slides titled Retail KPI Dashboard To Evaluate Merchandising Sales Plan Performance Rules PDF. The topics addressed in these templates are Clothing Apparel, Trend Merchandise, Items Sold. All the content presented in this PPT design is completely editable. Download it and make adjustments in color, background, font etc. as per your unique business setting.
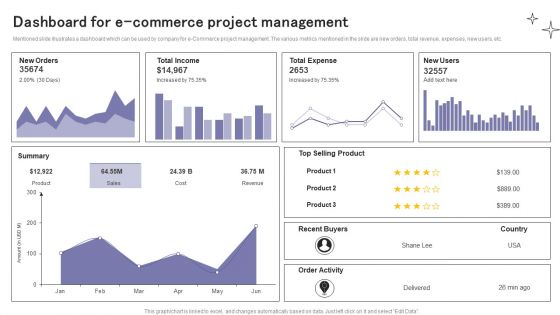
Dashboard For E Commerce Project Management Ppt Ideas Design Inspiration PDF
Mentioned slide illustrates a dashboard which can be used by company for e-Commerce project management. The various metrics mentioned in the slide are new orders, total revenue, expenses, new users, etc. Showcasing this set of slides titled Dashboard For E Commerce Project Management Ppt Ideas Design Inspiration PDF. The topics addressed in these templates are New Orders, Total Income, Total Expense. All the content presented in this PPT design is completely editable. Download it and make adjustments in color, background, font etc. as per your unique business setting.
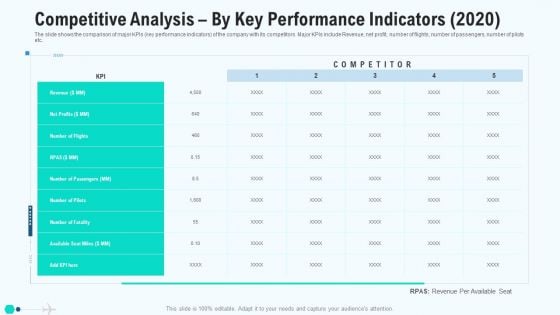
Competitive Analysis By Key Performance Indicators 2020 Elements PDF
The slide shows the comparison of major KPIs key performance indicators of the company with its competitors. Major KPIs include Revenue, net profit, number of flights, number of passengers, number of pilots etc. Deliver an awe inspiring pitch with this creative competitive analysis by key performance indicators 2020 elements pdf bundle. Topics like competitive analysis by key performance indicators can be discussed with this completely editable template. It is available for immediate download depending on the needs and requirements of the user.
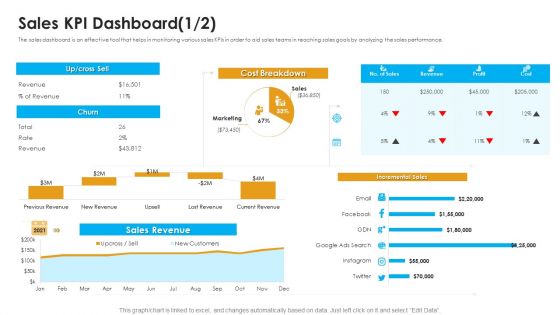
Sales Assistance Boost Overall Efficiency Sales KPI Dashboard Ppt Pictures File Formats PDF
The sales dashboard is an effective tool that helps in monitoring various sales KPIs in order to aid sales teams in reaching sales goals by analyzing the sales performance. Deliver an awe-inspiring pitch with this creative sales assistance boost overall efficiency sales kpi dashboard ppt pictures file formats pdf bundle. Topics like sales revenue, cost breakdown, incremental sales can be discussed with this completely editable template. It is available for immediate download depending on the needs and requirements of the user.
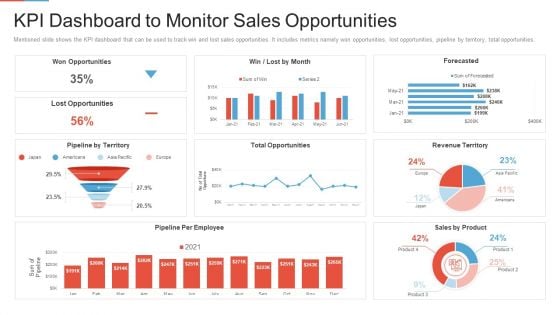
Marketing Outlining Segmentation Initiatives Kpi Dashboard To Monitor Sales Opportunities Information PDF
Mentioned slide shows the KPI dashboard that can be used to track win and lost sales opportunities. It includes metrics namely won opportunities, lost opportunities, pipeline by territory, total opportunities. Deliver an awe inspiring pitch with this creative marketing outlining segmentation initiatives kpi dashboard to monitor sales opportunities information pdf bundle. Topics like opportunities, pipeline by territory, revenue territory, sales by product, pipeline per employee can be discussed with this completely editable template. It is available for immediate download depending on the needs and requirements of the user.
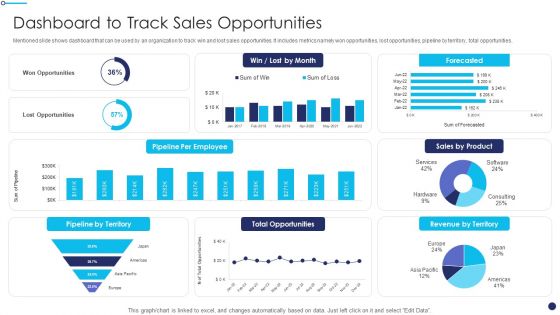
Effective Sales Technique For New Product Launch Dashboard To Track Sales Opportunities Introduction PDF
Mentioned slide shows dashboard that can be used by an organization to track win and lost sales opportunities. It includes metrics namely won opportunities, lost opportunities, pipeline by territory, total opportunities.Deliver an awe inspiring pitch with this creative Effective Sales Technique For New Product Launch Dashboard To Track Sales Opportunities Introduction PDF bundle. Topics like Lost Opportunities, Total Opportunities, Revenue Territory can be discussed with this completely editable template. It is available for immediate download depending on the needs and requirements of the user.
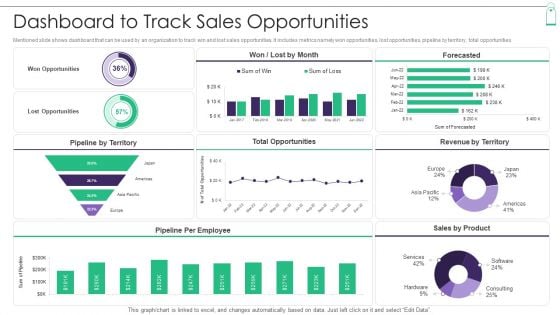
New Product Sales Strategy And Marketing Dashboard To Track Sales Opportunities Rules PDF
Mentioned slide shows dashboard that can be used by an organization to track win and lost sales opportunities. It includes metrics namely won opportunities, lost opportunities, pipeline by territory, total opportunities. Deliver and pitch your topic in the best possible manner with this New Product Sales Strategy And Marketing Dashboard To Track Sales Opportunities Rules PDF. Use them to share invaluable insights on Won Opportunities, Lost Opportunities, Revenue and impress your audience. This template can be altered and modified as per your expectations. So, grab it now.
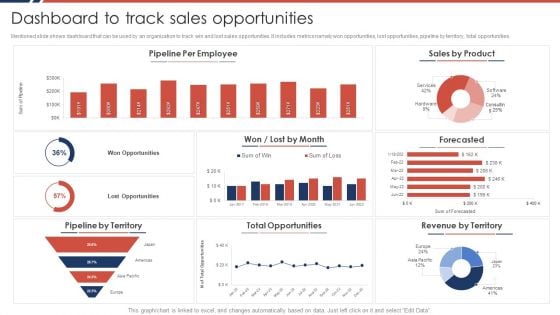
Effective Sales Plan For New Product Introduction In Market Dashboard To Track Sales Opportunities Formats PDF
Mentioned slide shows dashboard that can be used by an organization to track win and lost sales opportunities. It includes metrics namely won opportunities, lost opportunities, pipeline by territory, total opportunities.Deliver an awe inspiring pitch with this creative Effective Sales Plan For New Product Introduction In Market Dashboard To Track Sales Opportunities Formats PDF bundle. Topics like Pipeline Employee, Total Opportunities, Revenue Territory can be discussed with this completely editable template. It is available for immediate download depending on the needs and requirements of the user.
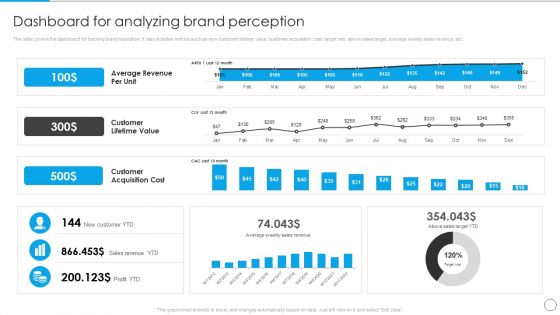
Dashboard For Analyzing Brand Perception Communication Strategy To Enhance Brand Value Topics PDF
This slide covers the dashboard for tracking brand reputation. It also includes metrics such as new customer lifetime value, customer acquisition cost, target met, above sales target, average weekly sales revenue, etc. Boost your pitch with our creative Dashboard For Analyzing Brand Perception Communication Strategy To Enhance Brand Value Topics PDF. Deliver an awe-inspiring pitch that will mesmerize everyone. Using these presentation templates you will surely catch everyones attention. You can browse the ppts collection on our website. We have researchers who are experts at creating the right content for the templates. So you do not have to invest time in any additional work. Just grab the template now and use them.
Loyalty Program Performance Tracking Dashboard Consumer Contact Point Guide Demonstration PDF
This slide covers the KPI dashboard for analyzing customer loyalty campaign results. It includes metrics such as revenue, liability, NQP accrued, transaction count, members, redemption ratio, etc. Find a pre-designed and impeccable Loyalty Program Performance Tracking Dashboard Consumer Contact Point Guide Demonstration PDF. The templates can ace your presentation without additional effort. You can download these easy-to-edit presentation templates to make your presentation stand out from others. So, what are you waiting for Download the template from Slidegeeks today and give a unique touch to your presentation.
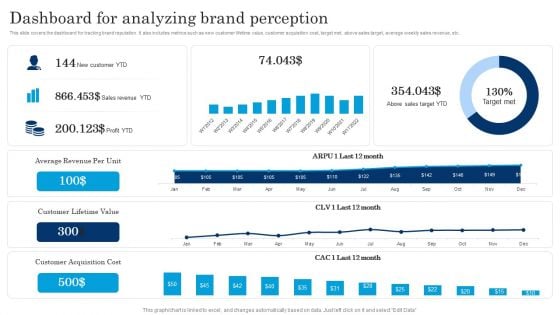
Dashboard For Analyzing Brand Perception Executing Brand Communication Strategy Summary PDF
This slide covers the dashboard for tracking brand reputation. It also includes metrics such as new customer lifetime value, customer acquisition cost, target met, above sales target, average weekly sales revenue, etc. The best PPT templates are a great way to save time, energy, and resources. Slidegeeks have 100parcent editable powerpoint slides making them incredibly versatile. With these quality presentation templates, you can create a captivating and memorable presentation by combining visually appealing slides and effectively communicating your message. Download Dashboard For Analyzing Brand Perception Executing Brand Communication Strategy Summary PDF from Slidegeeks and deliver a wonderful presentation.
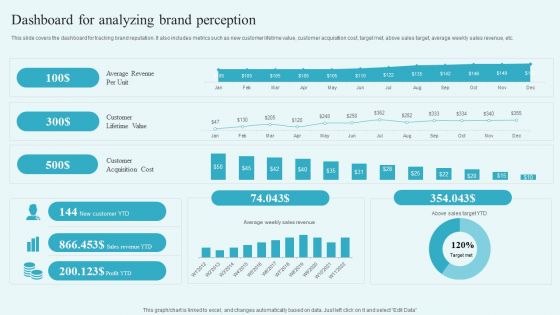
Dashboard For Analyzing Brand Perception Building A Comprehensive Brand Elements PDF
This slide covers the dashboard for tracking brand reputation. It also includes metrics such as new customer lifetime value, customer acquisition cost, target met, above sales target, average weekly sales revenue, etc. Find a pre-designed and impeccable Dashboard For Analyzing Brand Perception Building A Comprehensive Brand Elements PDF. The templates can ace your presentation without additional effort. You can download these easy-to-edit presentation templates to make your presentation stand out from others. So, what are you waiting for Download the template from Slidegeeks today and give a unique touch to your presentation.
Providing Efficient Client Services Kpi Dashboard For Tracking Customer Retention Diagrams PDF
This slide covers the dashboard for analyzing customer loyalty with metrics such as NPS, loyal customer rate, premium users, CLV, customer churn, revenue churn, net retention, MRR growth, etc. Take your projects to the next level with our ultimate collection of Providing Efficient Client Services Kpi Dashboard For Tracking Customer Retention Diagrams PDF. Slidegeeks has designed a range of layouts that are perfect for representing task or activity duration, keeping track of all your deadlines at a glance. Tailor these designs to your exact needs and give them a truly corporate look with your own brand colors they will make your projects stand out from the rest.
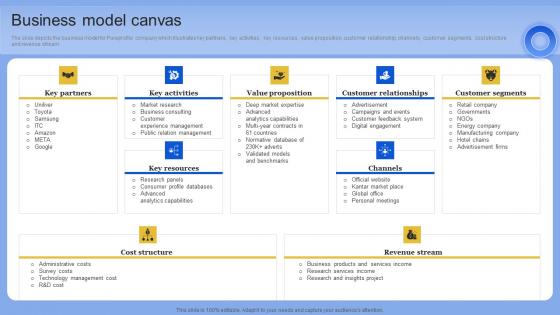
Business Model Canvas Data Analytics Company Outline Demonstration PDF
The slide depicts the business model for Pureprofile company which illustrates key partners, key activities, key resources, value proposition, customer relationship, channels, customer segments, cost structure and revenue stream. Slidegeeks is one of the best resources for PowerPoint templates. You can download easily and regulate Business Model Canvas Data Analytics Company Outline Demonstration PDF for your personal presentations from our wonderful collection. A few clicks is all it takes to discover and get the most relevant and appropriate templates. Use our Templates to add a unique zing and appeal to your presentation and meetings. All the slides are easy to edit and you can use them even for advertisement purposes. The slide depicts the business model for Pureprofile company which illustrates key partners, key activities, key resources, value proposition, customer relationship, channels, customer segments, cost structure and revenue stream.
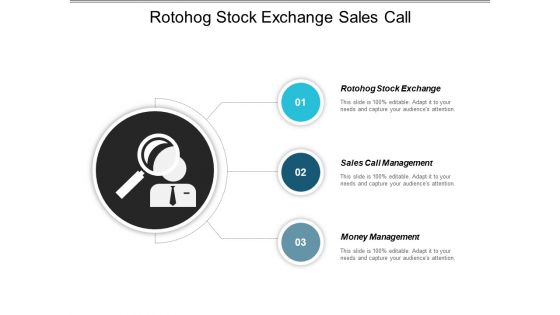
Roto Hog Stock Exchange Sales Call Management Money Management Ppt PowerPoint Presentation Gallery Graphics Design
This is a roto hog stock exchange sales call management money management ppt powerpoint presentation gallery graphics design. This is a three stage process. The stages in this process are roto hog stock exchange, sales call management, money management.
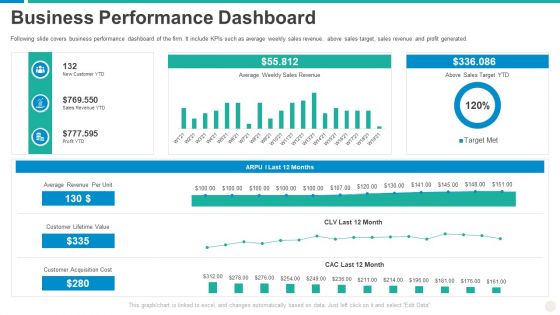
Establishing Successful Brand Strategy To Captivate Consumers Business Performance Dashboard Microsoft PDF
Following slide covers business performance dashboard of the firm. It include KPIs such as average weekly sales revenue, above sales target, sales revenue and profit generated. Deliver an awe inspiring pitch with this creative establishing successful brand strategy to captivate consumers business performance dashboard microsoft pdf bundle. Topics like customer acquisition cost, customer lifetime value, average revenue per unit can be discussed with this completely editable template. It is available for immediate download depending on the needs and requirements of the user.
Successful Brand Development Plan Business Performance Measuring KPI Dashboard Icons PDF
Following slide covers business performance dashboard of the firm. It include KPIs such as average weekly sales revenue, above sales target, sales revenue and profit generated.Deliver and pitch your topic in the best possible manner with this successful brand development plan business performance measuring kpi dashboard icons pdf Use them to share invaluable insights on average revenue, customer lifetime value, customer acquisition cost and impress your audience. This template can be altered and modified as per your expectations. So, grab it now.
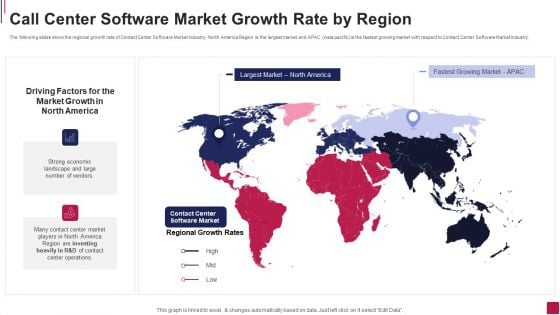
Call Center Software Market Growth Rate By Region Slides PDF
The following slides show the regional growth rate of Contact Center Software Market Industry. North America Region is the largest market and APAC Asia pacific is the fastest growing market with respect to Contact Center Software Market Industry.This is a Call Center Software Market Growth Rate By Region Slides PDF template with various stages. Focus and dispense information on two stages using this creative set, that comes with editable features. It contains large content boxes to add your information on topics like Driving Factors, Market Growth, Strong Economic You can also showcase facts, figures, and other relevant content using this PPT layout. Grab it now.
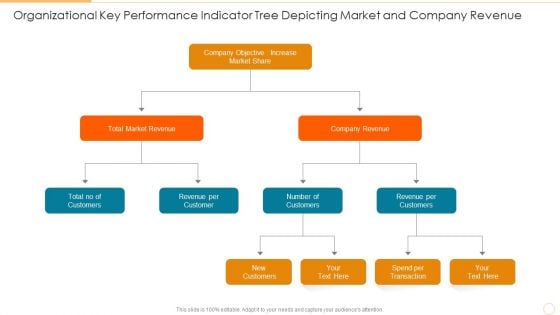
Organizational Key Performance Indicator Tree Depicting Market And Company Revenue Graphics PDF
Presenting organizational key performance indicator tree depicting market and company revenue graphics pdf to dispense important information. This template comprises three stages. It also presents valuable insights into the topics including total market revenue, company revenue, increase market share. This is a completely customizable PowerPoint theme that can be put to use immediately. So, download it and address the topic impactfully.

Stock Photo Book On Learn To Save Money PowerPoint Slide
Create visually stunning and define your presentations in a unique and inspiring manner using this above Image which contains graphics of book of learn to save money. So be a successful presenter by using this wonderful image slide.
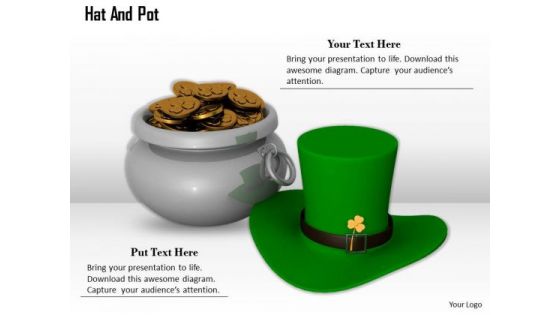
Stock Photo Design Of Money Pot With Hat PowerPoint Slide
This image contains design of money pot with hat of St. Patrick day. The clover on hat is a sign of good luck. You can use this image to explain about the customs of St. Patricks day.

Stock Photo Illustration Of Money Pot With Rainbow PowerPoint Slide
This pre-designed and appealing image of money pot wish rainbow represents good luck. This image is designed with coins pot with rainbow on white background. Add this image in your presentations to visually support your content.

Stock Photo Money Pot And Hat PowerPoint Slide
This pre-designed and appealing image of money pot with hat represents good luck. This image is designed with coins pot with hat for Patricks day. Add this image in your presentations to visually support your content.

Stock Photo Money Pot Patrick Day PowerPoint Slide
This pre-designed and appealing image of money pot represents good luck. This image is designed with coins pot for Patricks day. Add this image in your presentations to visually support your content.
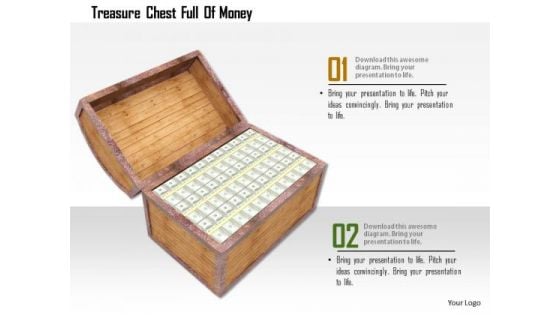
Stock Photo Treasure Chest Full Of Money PowerPoint Slide
This image is designed with treasure chest full of money. This unique image helps to portray concepts like wealth, finance, treasure etc. Create dynamic presentations with this professional image.

Economics Of Customer Retention Ppt PowerPoint Presentation Picture
This is a economics of customer retention ppt powerpoint presentation picture. This is a three stage process. The stages in this process are cost of retaining current customer, cost of acquiring new customer, cost of retaining current customer.
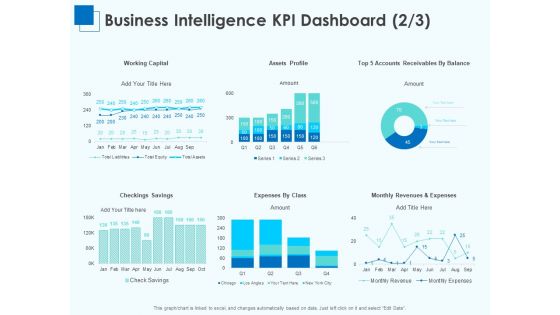
Corporate Intelligence Business Analysis Business Intelligence KPI Dashboard Profile Rules PDF
Deliver an awe-inspiring pitch with this creative corporate intelligence business analysis business intelligence kpi dashboard profile rules pdf bundle. Topics like working capital, assets profile, revenues and expenses, checkings savings can be discussed with this completely editable template. It is available for immediate download depending on the needs and requirements of the user.
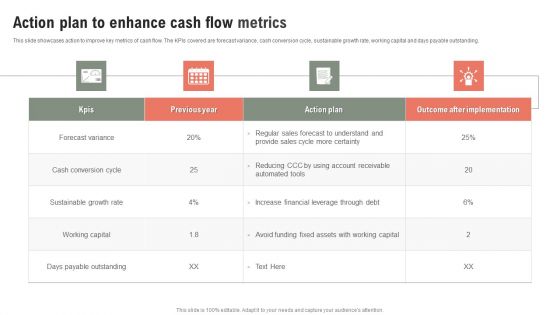
Action Plan To Enhance Cash Flow Metrics Ppt Show Maker PDF
This slide showcases action to improve key metrics of cash flow. The KPIs covered are forecast variance, cash conversion cycle, sustainable growth rate, working capital and days payable outstanding. Showcasing this set of slides titled Action Plan To Enhance Cash Flow Metrics Ppt Show Maker PDF. The topics addressed in these templates are Forecast Variance, Cash Conversion Cycle, Sustainable Growth Rate. All the content presented in this PPT design is completely editable. Download it and make adjustments in color, background, font etc. as per your unique business setting.
Referral Program Performance Tracking Dashboard Consumer Contact Point Guide Icons PDF
This slide covers the KPI dashboard for analyzing referral campaign results. It includes metrics such as total revenue generated, monthly recurring revenue, new customers, clicks, cancelled customers, paying customers, etc. Are you in need of a template that can accommodate all of your creative concepts This one is crafted professionally and can be altered to fit any style. Use it with Google Slides or PowerPoint. Include striking photographs, symbols, depictions, and other visuals. Fill, move around, or remove text boxes as desired. Test out color palettes and font mixtures. Edit and save your work, or work with colleagues. Download Referral Program Performance Tracking Dashboard Consumer Contact Point Guide Icons PDF and observe how to make your presentation outstanding. Give an impeccable presentation to your group and make your presentation unforgettable.
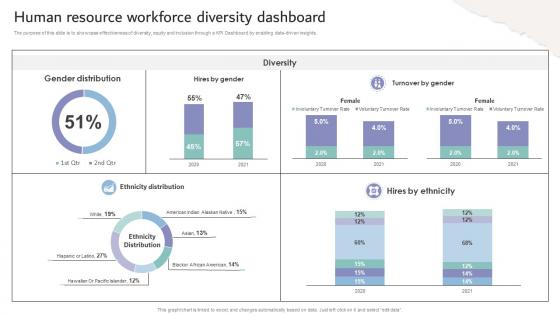
Inclusive Workplace Training Program Human Resource Workforce Diversity Dashboard DTE SS V
The purpose of this slide is to showcase effectiveness of diversity, equity and inclusion through a KPI Dashboard by enabling data-driven insights. Make sure to capture your audiences attention in your business displays with our gratis customizable Inclusive Workplace Training Program Human Resource Workforce Diversity Dashboard DTE SS V. These are great for business strategies, office conferences, capital raising or task suggestions. If you desire to acquire more customers for your tech business and ensure they stay satisfied, create your own sales presentation with these plain slides. The purpose of this slide is to showcase effectiveness of diversity, equity and inclusion through a KPI Dashboard by enabling data-driven insights.
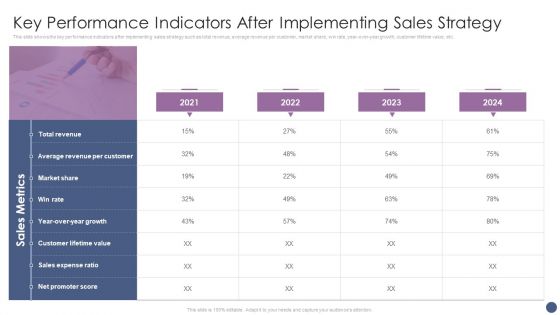
Competitive Sales Strategy Development Plan For Revenue Growth Key Performance Indicators Elements PDF
This slide shows the key performance indicators after implementing sales strategy such as total revenue, average revenue per customer, market share, win rate, year-over-year growth, customer lifetime value, etc. Presenting Competitive Sales Strategy Development Plan For Revenue Growth Key Performance Indicators Elements PDF to provide visual cues and insights. Share and navigate important information on four stages that need your due attention. This template can be used to pitch topics like Market Share, Total Revenue, Sales Expense Ratio. In addtion, this PPT design contains high resolution images, graphics, etc, that are easily editable and available for immediate download.

Inflation Economic Growth Ppt PowerPoint Presentation Show Picture Cpb
Presenting this set of slides with name inflation economic growth ppt powerpoint presentation show picture cpb. This is an editable Powerpoint five stages graphic that deals with topics like inflation economic growth to help convey your message better graphically. This product is a premium product available for immediate download and is 100 percent editable in Powerpoint. Download this now and use it in your presentations to impress your audience.
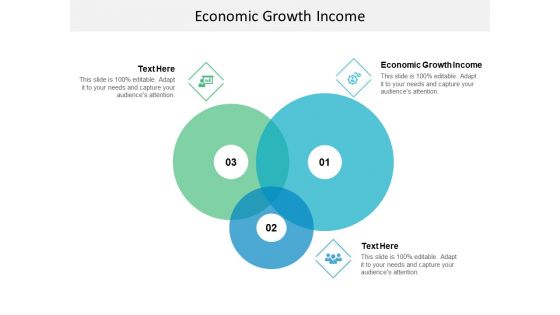
Economic Growth Income Ppt PowerPoint Presentation Pictures Deck Cpb
Presenting this set of slides with name economic growth income ppt powerpoint presentation pictures deck cpb. This is an editable Powerpoint three stages graphic that deals with topics like economic growth income to help convey your message better graphically. This product is a premium product available for immediate download and is 100 percent editable in Powerpoint. Download this now and use it in your presentations to impress your audience.
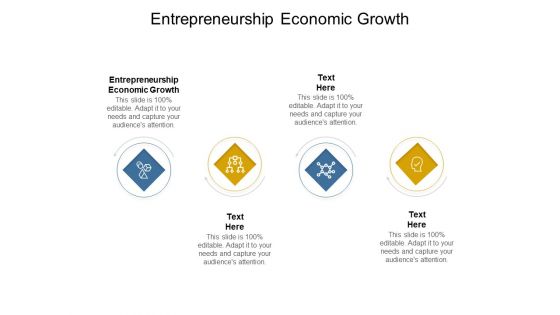
Entrepreneurship Economic Growth Ppt PowerPoint Presentation Pictures Background Cpb
Presenting this set of slides with name entrepreneurship economic growth ppt powerpoint presentation pictures background cpb. This is an editable Powerpoint four stages graphic that deals with topics like entrepreneurship economic growth to help convey your message better graphically. This product is a premium product available for immediate download and is 100 percent editable in Powerpoint. Download this now and use it in your presentations to impress your audience.
Economic Value Added Ppt PowerPoint Presentation Pictures Icons Cpb Pdf
Presenting this set of slides with name economic value added ppt powerpoint presentation pictures icons cpb pdf. This is an editable Powerpoint three stages graphic that deals with topics like economic value added to help convey your message better graphically. This product is a premium product available for immediate download and is 100 percent editable in Powerpoint. Download this now and use it in your presentations to impress your audience.
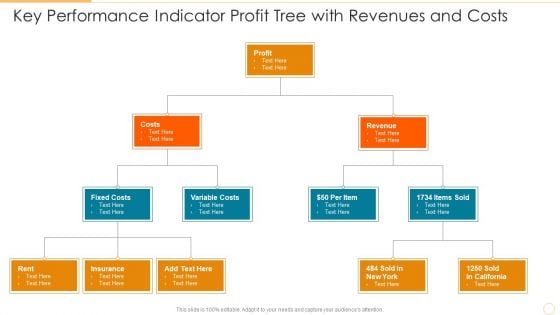
Key Performance Indicator Profit Tree With Revenues And Costs Template PDF
Presenting key performance indicator profit tree with revenues and costs template pdf to dispense important information. This template comprises three stages. It also presents valuable insights into the topics including costs, profit, revenue. This is a completely customizable PowerPoint theme that can be put to use immediately. So, download it and address the topic impactfully.
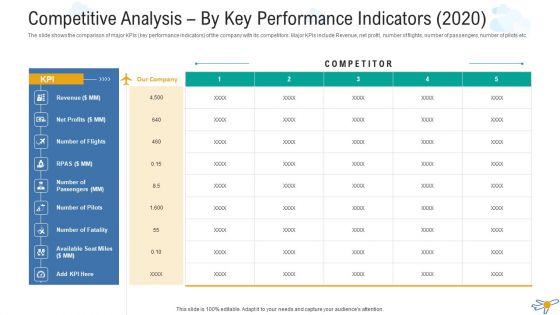
Competitive Analysis By Key Performance Indicators 2020 Inspiration PDF
The slide shows the comparison of major KPIs key performance indicators of the company with its competitors. Major KPIs include Revenue, net profit, number of flights, number of passengers, number of pilots etc. Deliver and pitch your topic in the best possible manner with this competitive analysis by key performance indicators 2020 inspiration pdf. Use them to share invaluable insights on comparison, revenue, net profit, number of flights, number of passengers and impress your audience. This template can be altered and modified as per your expectations. So, grab it now.
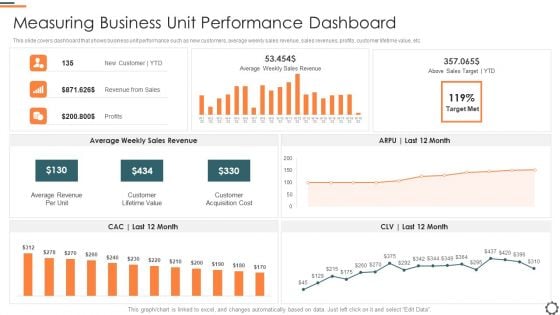
Agile Group For Product Development Measuring Business Unit Performance Dashboard Pictures PDF
This slide covers dashboard that shows business unit performance such as new customers, average weekly sales revenue, sales revenues, profits, customer lifetime value, etc. Deliver and pitch your topic in the best possible manner with this agile group for product development measuring business unit performance dashboard pictures pdf. Use them to share invaluable insights on average revenue per unit, customer lifetime value, customer acquisition cost and impress your audience. This template can be altered and modified as per your expectations. So, grab it now.
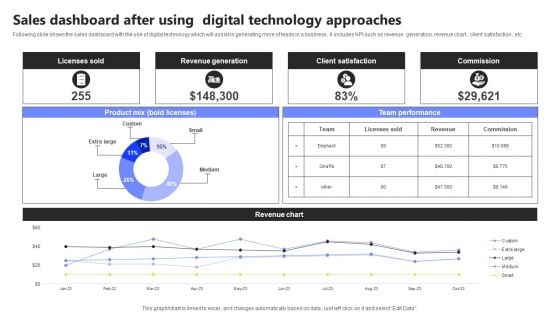
Sales Dashboard After Using Digital Technology Approaches Infographics PDF
Following slide shows the sales dashboard with the use of digital technology which will assist in generating more of leads in a business . It includes KPI such as revenue generation, revenue chart , client satisfaction , etc. Showcasing this set of slides titled Sales Dashboard After Using Digital Technology Approaches Infographics PDF. The topics addressed in these templates are Licenses Sold, Revenue Generation, Client Satisfaction. All the content presented in this PPT design is completely editable. Download it and make adjustments in color, background, font etc. as per your unique business setting.
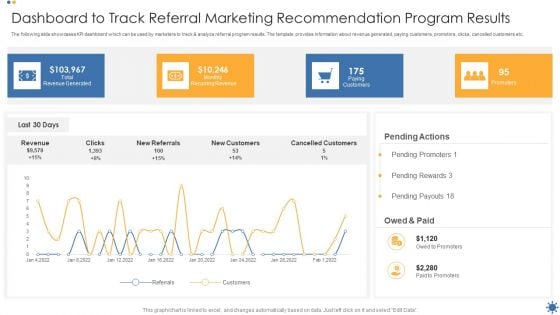
Dashboard To Track Referral Marketing Recommendation Program Results Structure PDF
The following slide showcases KPI dashboard which can be used by marketers to track and analyze referral program results. The template provides information about revenue generated, paying customers, promotors, clicks, cancelled customers etc. Showcasing this set of slides titled Dashboard To Track Referral Marketing Recommendation Program Results Structure PDF. The topics addressed in these templates are Revenue Generated, Recurring Revenue, Paying Customers. All the content presented in this PPT design is completely editable. Download it and make adjustments in color, background, font etc. as per your unique business setting.
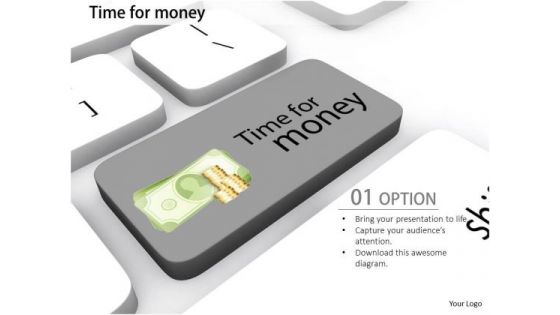
Stock Photo Conceptual Image Of Time For Money Pwerpoint Slide
We have used graphic of key with time for money word in this image. Display the concept of timely action for earning money with this conceptual image. This image is suitable for business and finance related presentations. Create an extra ordinary presentation with this exclusive image.

Shopping Cart Conversion Rate Dashboard Ppt Model Graphics PDF
This slide shows shopping cart conversion rate dashboard. It includes details of online revenue share, shipping error rate, shopping cart conversion rate, coupon conversion, product views per session and revenue per visitors. Deliver an awe-inspiring pitch with this creative shopping cart conversion rate dashboard ppt model graphics pdf. bundle. Topics like shopping cart conversion rate, coupon cart conversion, product views per session, revenue per visitors, avg product views can be discussed with this completely editable template. It is available for immediate download depending on the needs and requirements of the user.
Marketing And Operations Dashboard For Performance Management Icons PDF
This slide covers sales and operation dashboard for performance management. It involves details such as number of new buyers, sales revenue, average revenue per unit etc. Pitch your topic with ease and precision using this Marketing And Operations Dashboard For Performance Management Icons PDF. This layout presents information on Average Revenue Per Unit, Customer Acquisition Cost, Customer Lifetime Value. It is also available for immediate download and adjustment. So, changes can be made in the color, design, graphics or any other component to create a unique layout.
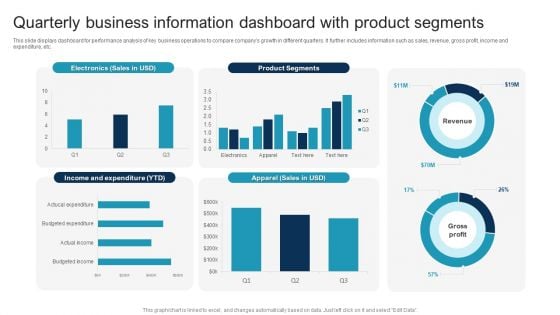
Quarterly Business Information Dashboard With Product Segments Slides PDF
This slide displays dashboard for performance analysis of key business operations to compare companys growth in different quarters. It further includes information such as sales, revenue, gross profit, income and expenditure, etc. Showcasing this set of slides titled Quarterly Business Information Dashboard With Product Segments Slides PDF. The topics addressed in these templates are Quarterly Business Information, Dashboard With Product Segments. All the content presented in this PPT design is completely editable. Download it and make adjustments in color, background, font etc. as per your unique business setting.
Sales Process Catalogue Template Sales Management Activities Tracking Dashboard Summary PDF
This slide provides information regarding various metrics catered to track sales team performance in terms of average revenue per account, win rate, NPS, along with sales representative performance tracking through number of opportunities created, lead response time, etc. Deliver an awe inspiring pitch with this creative sales process catalogue template sales management activities tracking dashboard summary pdf bundle. Topics like sales pipeline, sales activity by sales rep, sales pipeline by sales rep, closed business, month over month growth, forecast by month can be discussed with this completely editable template. It is available for immediate download depending on the needs and requirements of the user.
Marketing Playbook To Maximize ROI Sales Management Activities Tracking Dashboard Guidelines PDF
This slide provides information regarding various metrics catered to track sales team performance in terms of average revenue per account, win rate, NPS, along with sales representative performance tracking through number of opportunities created, lead response time, etc. Deliver and pitch your topic in the best possible manner with this marketing playbook to maximize roi sales management activities tracking dashboard guidelines pdf. Use them to share invaluable insights on closed business, sales pipeline, month over month growth, sales activity by sales rep and impress your audience. This template can be altered and modified as per your expectations. So, grab it now.
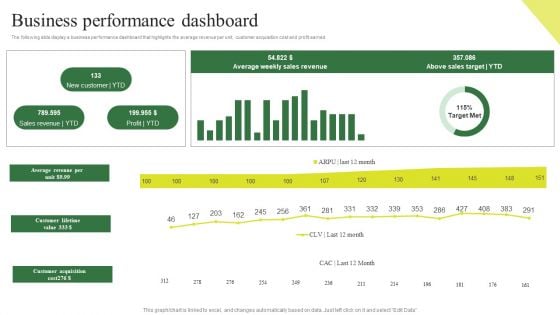
Consumption Based Pricing Model Business Performance Dashboard Demonstration PDF
The following slide display a business performance dashboard that highlights the average revenue per unit, customer acquisition cost and profit earned. Crafting an eye catching presentation has never been more straightforward. Let your presentation shine with this tasteful yet straightforward Consumption Based Pricing Model Business Performance Dashboard Demonstration PDF template. It offers a minimalistic and classy look that is great for making a statement. The colors have been employed intelligently to add a bit of playfulness while still remaining professional. Construct the ideal Consumption Based Pricing Model Business Performance Dashboard Demonstration PDF that effortlessly grabs the attention of your audience. Begin now and be certain to wow your customers.
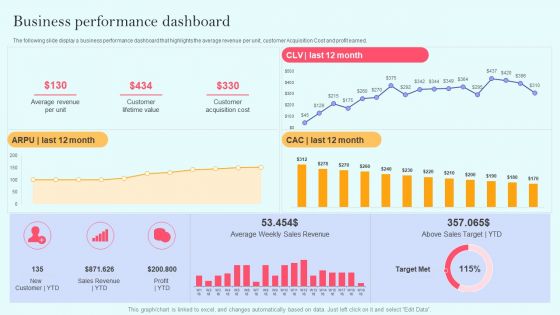
Recurring Income Generation Model Business Performance Dashboard Clipart PDF
The following slide display a business performance dashboard that highlights the average revenue per unit, customer Acquisition Cost and profit earned. Crafting an eye catching presentation has never been more straightforward. Let your presentation shine with this tasteful yet straightforward Recurring Income Generation Model Business Performance Dashboard Clipart PDF template. It offers a minimalistic and classy look that is great for making a statement. The colors have been employed intelligently to add a bit of playfulness while still remaining professional. Construct the ideal Recurring Income Generation Model Business Performance Dashboard Clipart PDF that effortlessly grabs the attention of your audience. Begin now and be certain to wow your customers.
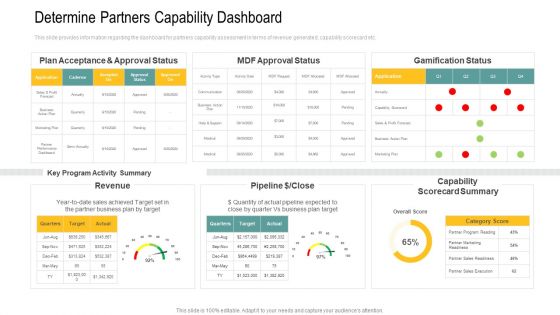
Determine Partners Capability Dashboard Ppt Layouts Graphics PDF
This slide provides information regarding the dashboard for partners capability assessment in terms of revenue generated, capability scorecard etc. Deliver and pitch your topic in the best possible manner with this determine partners capability dashboard ppt layouts graphics pdf. Use them to share invaluable insights on revenue, capability scorecard, business plan target and impress your audience. This template can be altered and modified as per your expectations. So, grab it now.
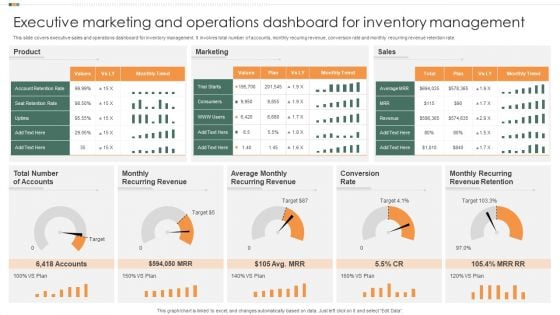
Executive Marketing And Operations Dashboard For Inventory Management Template PDF
This slide covers executive sales and operations dashboard for inventory management. It involves total number of accounts, monthly recuring revenue, conversion rate and monthly recurring revenue retention rate. Showcasing this set of slides titled Executive Marketing And Operations Dashboard For Inventory Management Template PDF. The topics addressed in these templates are Product, Marketing, Sales. All the content presented in this PPT design is completely editable. Download it and make adjustments in color, background, font etc. as per your unique business setting.
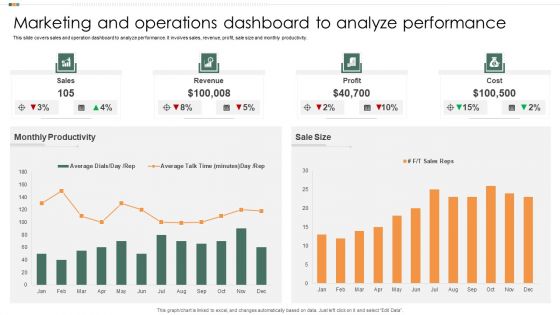
Marketing And Operations Dashboard To Analyze Performance Infographics PDF
This slide covers sales and operation dashboard to analyze performance. It involves sales, revenue, profit, sale size and monthly productivity. Showcasing this set of slides titled Marketing And Operations Dashboard To Analyze Performance Infographics PDF. The topics addressed in these templates are Monthly Productivity, Sales, Revenue. All the content presented in this PPT design is completely editable. Download it and make adjustments in color, background, font etc. as per your unique business setting.
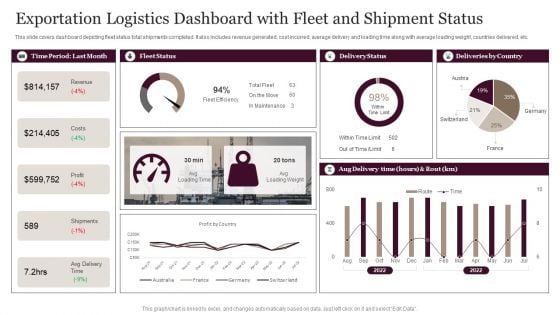
Exportation Logistics Dashboard With Fleet And Shipment Status Demonstration PDF
This slide covers dashboard depicting fleet status total shipments completed. It also includes revenue generated, cost incurred, average delivery and loading time along with average loading weight, countries delivered, etc. Showcasing this set of slides titled Exportation Logistics Dashboard With Fleet And Shipment Status Demonstration PDF. The topics addressed in these templates are Revenue, Costs, Profit. All the content presented in this PPT design is completely editable. Download it and make adjustments in color, background, font etc. as per your unique business setting.
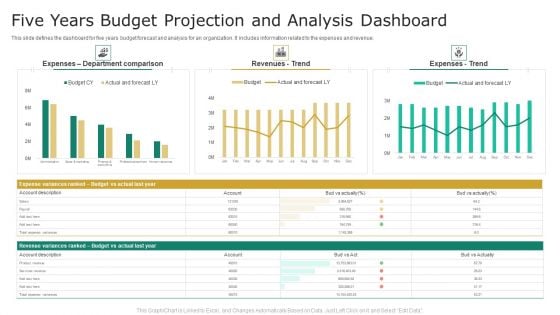
Five Years Budget Projection And Analysis Dashboard Graphics PDF
This slide defines the dashboard for five years budget forecast and analysis for an organization. It includes information related to the expenses and revenue. Showcasing this set of slides titled Five Years Budget Projection And Analysis Dashboard Graphics PDF. The topics addressed in these templates are Revenues, Expenses, Budget. All the content presented in this PPT design is completely editable. Download it and make adjustments in color, background, font etc. as per your unique business setting.


 Continue with Email

 Home
Home


