Fund Performance
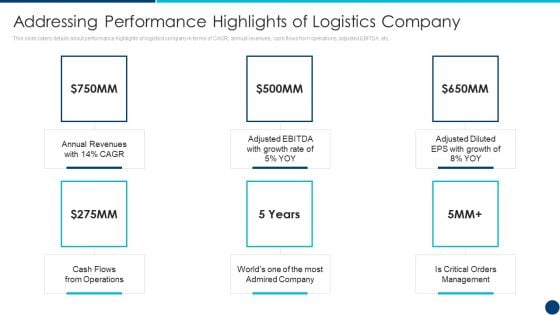
Freight Forwarding Agency Addressing Performance Highlights Of Logistics Company Ppt Styles Slides PDF
This slide caters details about performance highlights of logistics company in terms of CAGR, annual revenues, cash flows from operations, adjusted EBITDA, etc. This is a freight forwarding agency addressing performance highlights of logistics company ppt styles slides pdf template with various stages. Focus and dispense information on six stages using this creative set, that comes with editable features. It contains large content boxes to add your information on topics like annual revenues, growth rate, cash flows, operations, critical orders management. You can also showcase facts, figures, and other relevant content using this PPT layout. Grab it now.
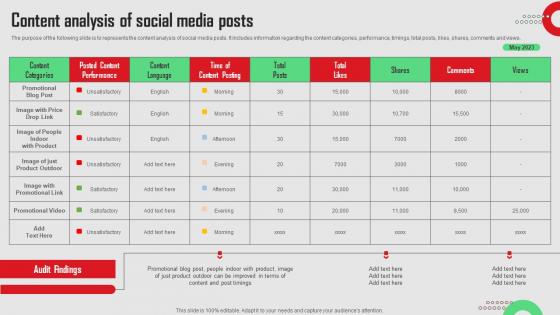
Content Analysis Of Social Media Posts Social Media Platforms Performance Template Pdf
The purpose of the following slide is to represents the content analysis of social media posts. It includes information regarding the content categories, performance, timings, total posts, likes, shares, comments and views.Boost your pitch with our creative Content Analysis Of Social Media Posts Social Media Platforms Performance Template Pdf. Deliver an awe-inspiring pitch that will mesmerize everyone. Using these presentation templates you will surely catch everyones attention. You can browse the ppts collection on our website. We have researchers who are experts at creating the right content for the templates. So you do not have to invest time in any additional work. Just grab the template now and use them. The purpose of the following slide is to represents the content analysis of social media posts. It includes information regarding the content categories, performance, timings, total posts, likes, shares, comments and views.
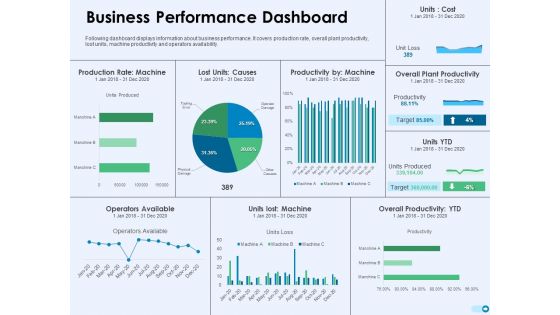
Tools For Prioritization Business Performance Dashboard Ppt PowerPoint Presentation Portfolio Clipart PDF
Following dashboard displays information about business performance. It covers production rate, overall plant productivity, lost units, machine productivity and operators availability. Deliver an awe-inspiring pitch with this creative tools for prioritization business performance dashboard ppt powerpoint presentation portfolio clipart pdf bundle. Topics like production rate machine, lost units causes, productivity by machine, overall plant productivity, units lost machine, overall productivity ytd, operators available can be discussed with this completely editable template. It is available for immediate download depending on the needs and requirements of the user.

Tools For Prioritization Financial Performance Of The Company Ppt PowerPoint Presentation Styles Outline PDF
Following slide provides information about financial performance of the firm. It includes revenue from operations, net worth, return on equity and return on capital employed. Deliver and pitch your topic in the best possible manner with this tools for prioritization financial performance of the company ppt powerpoint presentation styles outline pdf. Use them to share invaluable insights on revenue from operations, net worth, roe and roce, key highlights and impress your audience. This template can be altered and modified as per your expectations. So, grab it now.
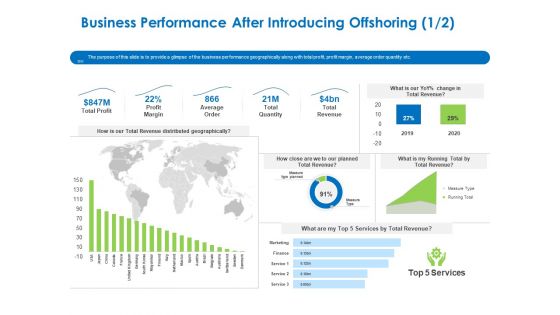
Relocation Of Business Process Offshoring Business Performance After Introducing Offshoring Infographics PDF
The purpose of this slide is to provide a glimpse of the business performance geographically along with total profit, profit margin, average order quantity etc. Deliver and pitch your topic in the best possible manner with this relocation of business process offshoring business performance after introducing offshoring infographics pdf. Use them to share invaluable insights on total profit, profit margin, average order, total quantity, total revenue and impress your audience. This template can be altered and modified as per your expectations. So, grab it now.
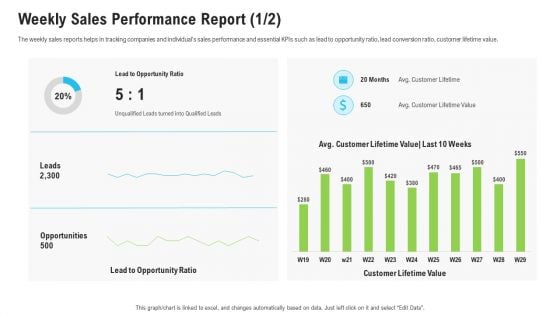
Sales Department Strategies Increase Revenues Weekly Sales Performance Report Leads Diagrams PDF
The weekly sales reports helps in tracking companies and individuals sales performance and essential KPIs such as lead to opportunity ratio, lead conversion ratio, customer lifetime value. Deliver and pitch your topic in the best possible manner with this sales department strategies increase revenues weekly sales performance report leads diagrams pdf. Use them to share invaluable insights on lead to opportunity ratio, customer lifetime value and impress your audience. This template can be altered and modified as per your expectations. So, grab it now.
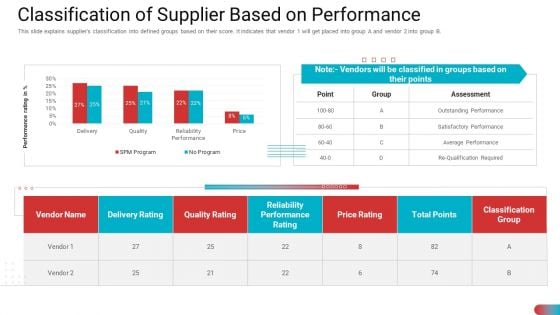
Benchmarking Vendor Operation Control Procedure Classification Of Supplier Based On Performance Mockup PDF
This slide explains suppliers classification into defined groups based on their score. It indicates that vendor 1 will get placed into group A and vendor 2 into group B. Deliver and pitch your topic in the best possible manner with this benchmarking vendor operation control procedure classification of supplier based on performance mockup pdf. Use them to share invaluable insights on quality rating, reliability performance rating, price rating, classification group and impress your audience. This template can be altered and modified as per your expectations. So, grab it now.
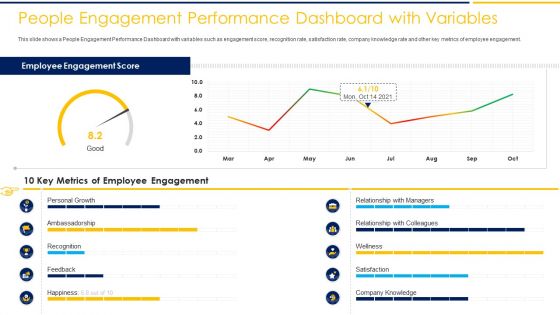
People Engagement Performance Dashboard With Variables Growth Ppt Summary Example PDF
This slide shows a People Engagement Performance Dashboard with variables such as engagement score, recognition rate, satisfaction rate, company knowledge rate and other key metrics of employee engagement. Deliver and pitch your topic in the best possible manner with this people engagement performance dashboard with variables growth ppt summary example pdf. Use them to share invaluable insights on 10 key metrics of employee engagement, employee engagement score and impress your audience. This template can be altered and modified as per your expectations. So, grab it now.
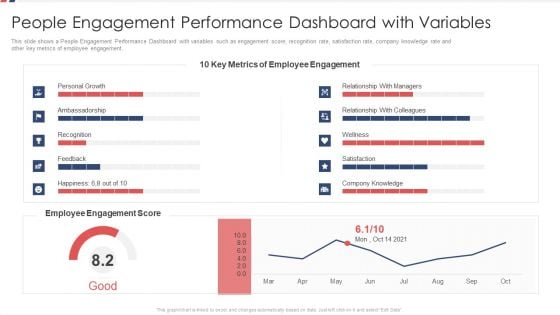
People Engagement Performance Dashboard With Variables Ppt Gallery Example File PDF
This slide shows a People Engagement Performance Dashboard with variables such as engagement score, recognition rate, satisfaction rate, company knowledge rate and other key metrics of employee engagement. Deliver and pitch your topic in the best possible manner with this people engagement performance dashboard with variables ppt gallery example file pdf. Use them to share invaluable insights on personal growth, employee engagement score, employee engagement metrics and impress your audience. This template can be altered and modified as per your expectations. So, grab it now.
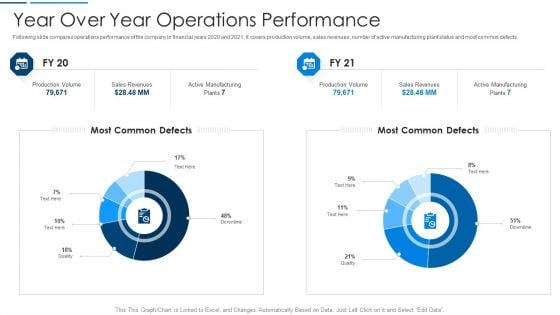
Information Technology Transformation Organization Year Over Year Operations Performance Professional PDF
Following slide compares operations performance of the company in financial years 2020 and 2021. It covers production volume, sales revenues, number of active manufacturing plant status and most common defects. Deliver and pitch your topic in the best possible manner with this information technology transformation organization year over year operations performance professional pdf. Use them to share invaluable insights on sales revenues, manufacturing, production volume and impress your audience. This template can be altered and modified as per your expectations. So, grab it now.
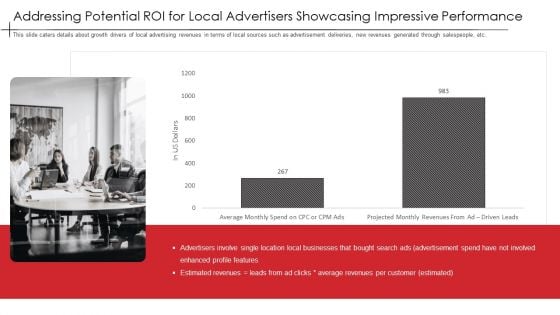
Addressing Potential Roi For Local Advertisers Showcasing Impressive Performance Infographics PDF
This slide caters details about growth drivers of local advertising revenues in terms of local sources such as advertisement deliveries, new revenues generated through salespeople, etc. Deliver and pitch your topic in the best possible manner with this addressing potential roi for local advertisers showcasing impressive performance infographics pdf. Use them to share invaluable insights on addressing potential roi for local advertisers showcasing impressive performance and impress your audience. This template can be altered and modified as per your expectations. So, grab it now.
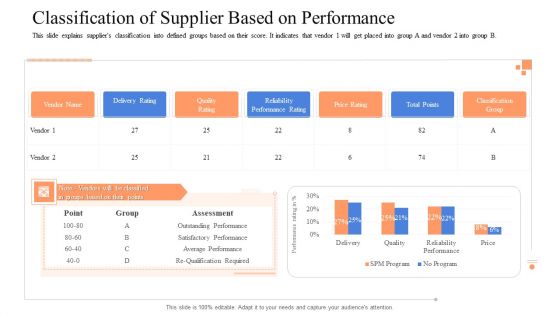
Instigating Efficient Value Process Classification Of Supplier Based On Performance Pictures PDF
This slide explains suppliers classification into defined groups based on their score. It indicates that vendor 1 will get placed into group A and vendor 2 into group B. Deliver and pitch your topic in the best possible manner with this instigating efficient value process classification of supplier based on performance pictures pdf. Use them to share invaluable insights on classification of supplier based on performance and impress your audience. This template can be altered and modified as per your expectations. So, grab it now.
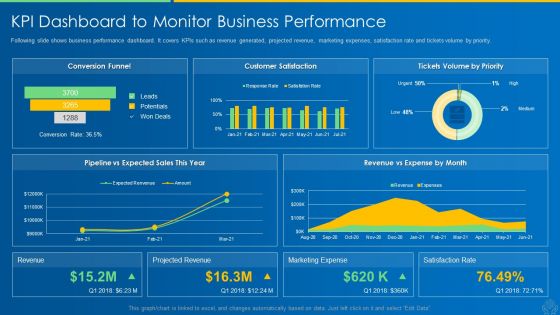
AI And ML Driving Monetary Value For Organization KPI Dashboard To Monitor Business Performance Graphics PDF
Following slide shows business performance dashboard. It covers KPIs such as revenue generated, projected revenue, marketing expenses, satisfaction rate and tickets volume by priority. Deliver and pitch your topic in the best possible manner with this ai and ml driving monetary value for organization kpi dashboard to monitor business performance graphics pdf. Use them to share invaluable insights on business offerings, current impact, product innovations, customer service and impress your audience. This template can be altered and modified as per your expectations. So, grab it now.
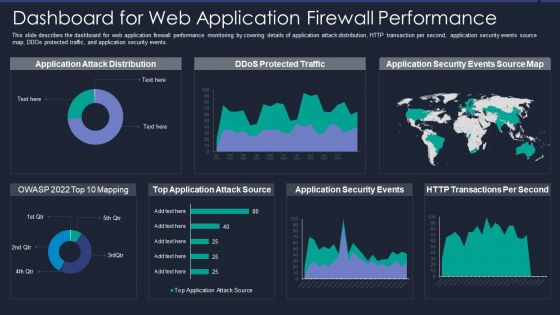
Web App Firewall Services IT Dashboard For Web Application Firewall Performance Microsoft PDF
This slide describes the dashboard for web application firewall performance monitoring by covering details of application attack distribution, HTTP transaction per second, application security events source map, DDOs protected traffic, and application security events. Deliver and pitch your topic in the best possible manner with this web app firewall services it dashboard for web application firewall performance microsoft pdf. Use them to share invaluable insights on application, source, security and impress your audience. This template can be altered and modified as per your expectations. So, grab it now.
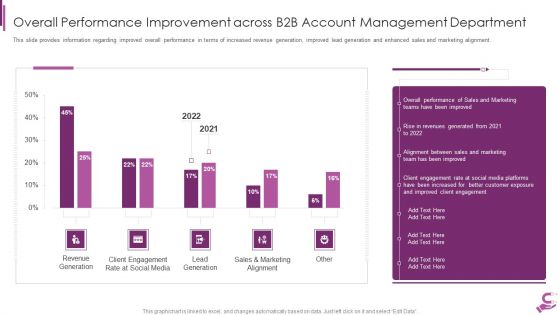
B2B Demand Generation Best Practices Overall Performance Improvement Across B2B Account Summary PDF
This slide provides information regarding improved overall performance in terms of increased revenue generation, improved lead generation and enhanced sales and marketing alignment. Deliver an awe inspiring pitch with this creative b2b demand generation best practices overall performance improvement across b2b account summary pdf bundle. Topics like revenue generation, client engagement rate at social media, lead generation, sales and marketing alignment, 2021 to 2022 can be discussed with this completely editable template. It is available for immediate download depending on the needs and requirements of the user.
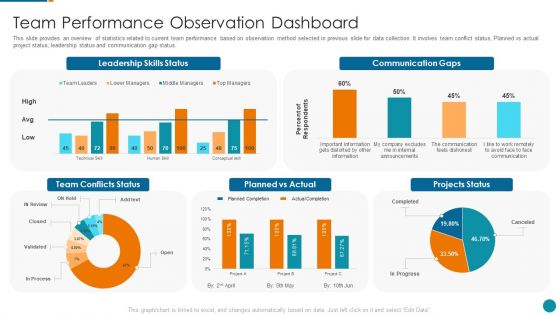
Strategic Procedure To Improve Employee Efficiency Team Performance Observation Dashboard Formats PDF
This slide provides an overview of statistics related to current team performance based on observation method selected in previous slide for data collection. It involves team conflict status, Planned vs actual project status, leadership status and communication gap status.Deliver an awe inspiring pitch with this creative strategic procedure to improve employee efficiency team performance observation dashboard formats pdf bundle. Topics like leadership skills status, communication gaps, planned vs actual can be discussed with this completely editable template. It is available for immediate download depending on the needs and requirements of the user.
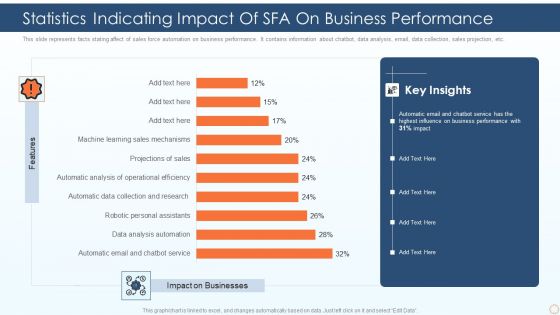
Statistics Indicating Impact Of SFA On Business Performance Ppt PowerPoint Presentation Gallery Outfit PDF
This slide represents facts stating affect of sales force automation on business performance. It contains information about chatbot, data analysis, email, data collection, sales projection, etc. Pitch your topic with ease and precision using this statistics indicating impact of sfa on business performance ppt powerpoint presentation gallery outfit pdf. This layout presents information on automatic email and chatbot service, data analysis automation, robotic personal assistants. It is also available for immediate download and adjustment. So, changes can be made in the color, design, graphics or any other component to create a unique layout.
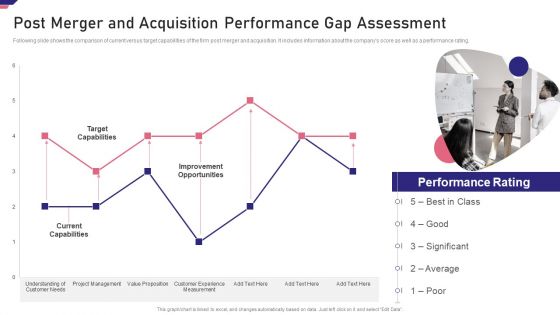
Mergers Acquisition Playbook Mergers Acquisition Playbook Post Merger Acquisition Performance Designs PDF
Following slide shows the comparison of current versus target capabilities of the firm post merger and acquisition. It includes information about the companys score as well as a performance rating.Deliver and pitch your topic in the best possible manner with this Mergers Acquisition Playbook Mergers Acquisition Playbook Post Merger Acquisition Performance Designs PDF Use them to share invaluable insights on Current Capabilities, Improvement Opportunities, Target Capabilities and impress your audience. This template can be altered and modified as per your expectations. So, grab it now.
Tactical Approach To Vendor Relationship Dashboard To Track Supplier Performance Metrics Icons PDF
This slide focuses on dashboard to track supplier performance metrics which covers defect rate, on-time supplies, availability of supplier, lead time, types of defect and delivery status of suppliers.Deliver and pitch your topic in the best possible manner with this Tactical Approach To Vendor Relationship Dashboard To Track Supplier Performance Metrics Icons PDF Use them to share invaluable insights on Supplier Defect Rate, Supplier Availability, Supplier Defect and impress your audience. This template can be altered and modified as per your expectations. So, grab it now.
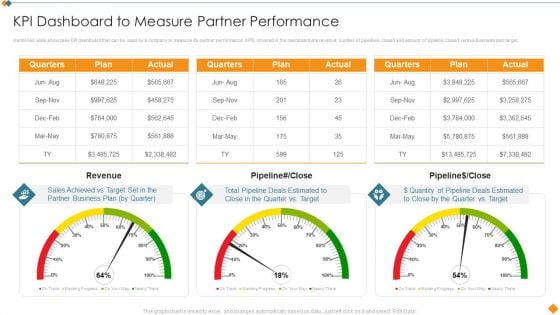
Maintaining Partner Relationships KPI Dashboard To Measure Partner Performance Structure PDF
Mentioned slide showcase KPI dashboard that can be used by a company to measure its partner performance. KPIS covered in the dashboard are revenue, number of pipelines closed and amount of pipeline closed versus business plan target. Deliver an awe inspiring pitch with this creative Maintaining Partner Relationships KPI Dashboard To Measure Partner Performance Structure PDF bundle. Topics like Quarters, Plan, Actual, Revenue, Pipeline can be discussed with this completely editable template. It is available for immediate download depending on the needs and requirements of the user.
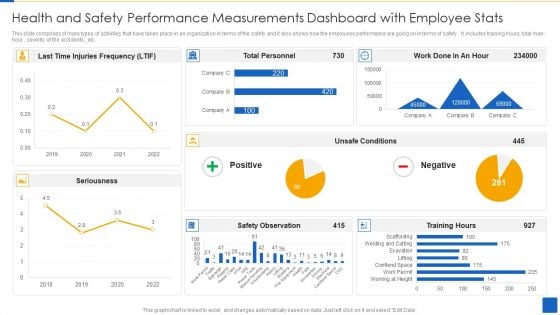
Health And Safety Performance Measurements Dashboard With Employee Stats Template PDF
This slide comprises of many types of activities that have taken place in an organization in terms of the safety and it also shows how the employees performance are going on in terms of safety . It includes training hours, total man-hour , severity of the accidents , etc.Pitch your topic with ease and precision using this Health And Safety Performance Measurements Dashboard With Employee Stats Template PDF This layout presents information on Safety Observation, Injuries Frequency, Unsafe Conditions It is also available for immediate download and adjustment. So, changes can be made in the color, design, graphics or any other component to create a unique layout.
BANT Sales Lead Qualification Model Analyzing And Understanding The Performance Icons PDF
Purpose of the following slide is to show the key performance indicators of the current sales process, the provided displays KPIs such as customer acquired, CAC, volume per customer etc. Deliver and pitch your topic in the best possible manner with this BANT Sales Lead Qualification Model Analyzing And Understanding The Performance Icons PDF. Use them to share invaluable insights on New Customer, Weekly Sales, Revenues Sales and impress your audience. This template can be altered and modified as per your expectations. So, grab it now.
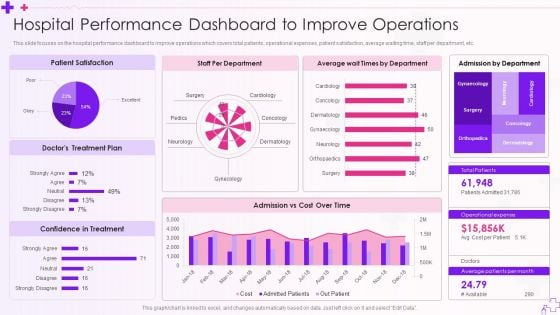
Integration Of Healthcare Center Administration System Hospital Performance Dashboard To Improve Operations Microsoft PDF
This slide focuses on the hospital performance dashboard to improve operations which covers total patients, operational expenses, patient satisfaction, average waiting time, staff per department, etc.Deliver and pitch your topic in the best possible manner with this Integration Of Healthcare Center Administration System Hospital Performance Dashboard To Improve Operations Microsoft PDF Use them to share invaluable insights on Patient Satisfaction, Confidence In Treatment, Admission By Department and impress your audience. This template can be altered and modified as per your expectations. So, grab it now.
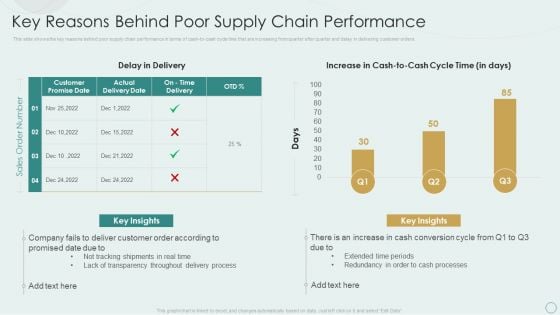
Learning Various Supply Chain Models Key Reasons Behind Poor Supply Chain Performance Guidelines PDF
This slide shows the key reasons behind poor supply chain performance in terms of cash-to-cash cycle time that are increasing from quarter after quarter and delay in delivering customer orders. Deliver and pitch your topic in the best possible manner with this Learning Various Supply Chain Models Key Reasons Behind Poor Supply Chain Performance Guidelines PDF. Use them to share invaluable insights on Delay Delivery, Extended Time Periods, Real Time and impress your audience. This template can be altered and modified as per your expectations. So, grab it now.
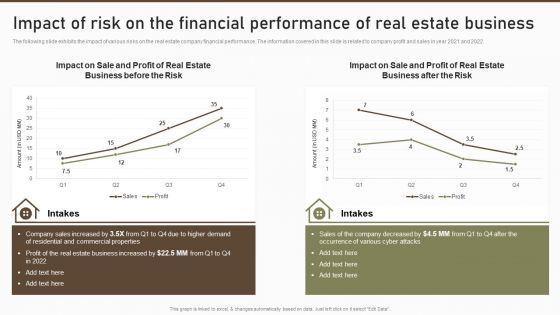
Impact Of Risk On The Financial Performance Of Real Estate Business Summary PDF
The following slide exhibits the impact of various risks on the real estate company financial performance. The information covered in this slide is related to company profit and sales in year 2021 and 2022. Deliver and pitch your topic in the best possible manner with this Impact Of Risk On The Financial Performance Of Real Estate Business Summary PDF. Use them to share invaluable insights on Commercial Properties, Estate Business, Real Estate and impress your audience. This template can be altered and modified as per your expectations. So, grab it now.
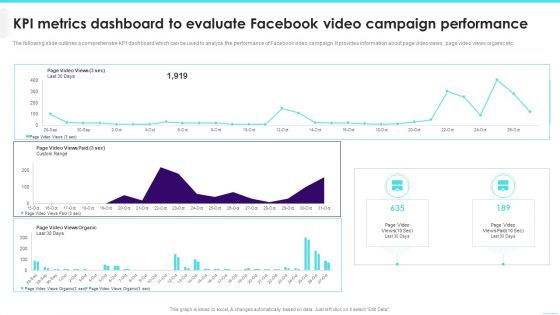
KPI Metrics Dashboard To Evaluate Facebook Video Campaign Performance Elements PDF
The following slide outlines a comprehensive KPI dashboard which can be used to analyze the performance of Facebook video campaign. It provides information about page video views, page video views organic etc.Deliver and pitch your topic in the best possible manner with this KPI Metrics Dashboard To Evaluate Facebook Video Campaign Performance Elements PDF. Use them to share invaluable insights on Custom Range, Page Video, Views Paid and impress your audience. This template can be altered and modified as per your expectations. So, grab it now.
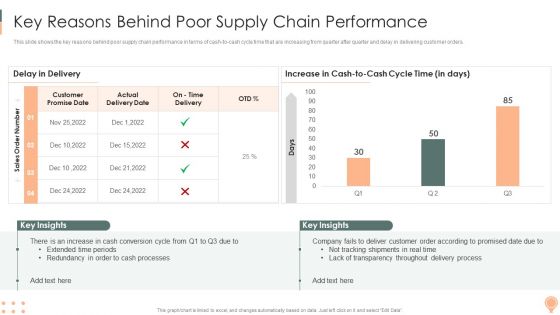
Supply Chain Approaches Key Reasons Behind Poorsupply Chain Performance Rules PDF
This slide shows the key reasons behind poor supply chain performance in terms of cash to cash cycle time that are increasing from quarter after quarter and delay in delivering customer orders.Deliver and pitch your topic in the best possible manner with this Supply Chain Approaches Key Reasons Behind Poorsupply Chain Performance Rules PDF. Use them to share invaluable insights on Customer Promise, Extended Time, Redundancy Cash and impress your audience. This template can be altered and modified as per your expectations. So, grab it now.
Online Customer Interaction Dashboard For Tracking Customer Service Team Performance Infographics PDF
This slide covers the KPI dashboard for analyzing the performance of client support department. It includes metrics such as first call resolution, unresolved calls, average response rate, the best day to call, average time to solve issues, etc. Deliver and pitch your topic in the best possible manner with this Online Customer Interaction Dashboard For Tracking Customer Service Team Performance Infographics PDF. Use them to share invaluable insights on Response Time, Issue Solving, Call Resolution and impress your audience. This template can be altered and modified as per your expectations. So, grab it now.
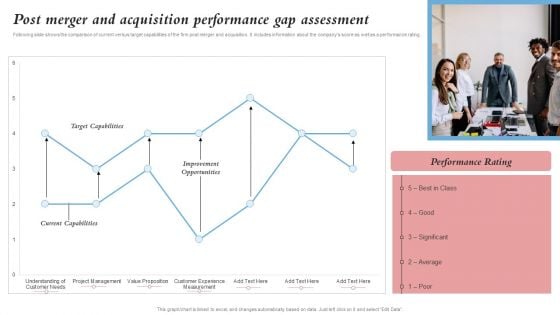
Post Merger And Acquisition Performance Gap Assessment Merger And Integration Procedure Topics PDF
Following slide shows the comparison of current versus target capabilities of the firm post merger and acquisition. It includes information about the companys score as well as a performance rating.Deliver and pitch your topic in the best possible manner with this Post Merger And Acquisition Performance Gap Assessment Merger And Integration Procedure Topics PDF. Use them to share invaluable insights on Target Capabilities, Current Capabilities, Improvement Opportunities and impress your audience. This template can be altered and modified as per your expectations. So, grab it now.
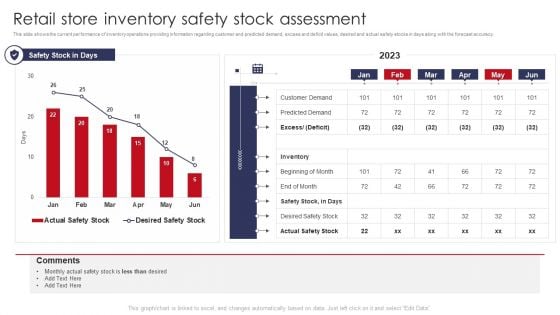
Retail Store Inventory Safety Stock Assessment Retail Outlet Operations Performance Evaluation Graphics PDF
This slide shows the current performance of inventory operations providing information regarding customer and predicted demand, excess and deficit values, desired and actual safety stocks in days along with the forecast accuracy.Deliver and pitch your topic in the best possible manner with this Retail Store Inventory Safety Stock Assessment Retail Outlet Operations Performance Evaluation Graphics PDF. Use them to share invaluable insights on Predicted Demand, Customer Demand, Beginning and impress your audience. This template can be altered and modified as per your expectations. So, grab it now.
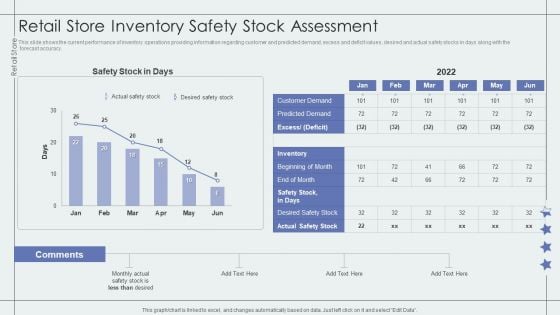
Retail Store Inventory Safety Stock Assessment Retail Outlet Performance Assessment Themes PDF
This slide shows the current performance of inventory operations providing information regarding customer and predicted demand, excess and deficit values, desired and actual safety stocks in days along with the forecast accuracy.Deliver and pitch your topic in the best possible manner with this Retail Store Inventory Safety Stock Assessment Retail Outlet Performance Assessment Themes PDF. Use them to share invaluable insights on Customer Demand, Predicted Demand, Actual Safety and impress your audience. This template can be altered and modified as per your expectations. So, grab it now.
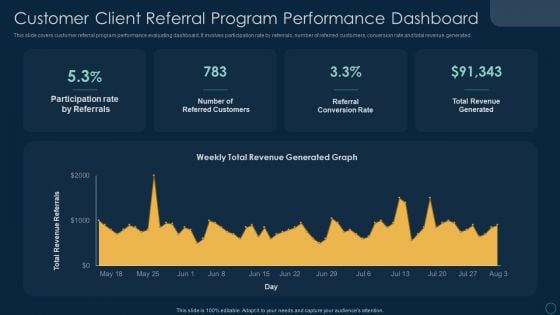
Customer Client Referral Program Performance Dashboard Ppt File Visual Aids PDF
This slide covers customer referral program performance evaluating dashboard. It involves participation rate by referrals, number of referred customers, conversion rate and total revenue generated. Pitch your topic with ease and precision using this Customer Client Referral Program Performance Dashboard Ppt File Visual Aids PDF. This layout presents information on Participation Rate Referrals, Number Referred Customers, Referral Conversion Rate. It is also available for immediate download and adjustment. So, changes can be made in the color, design, graphics or any other component to create a unique layout.
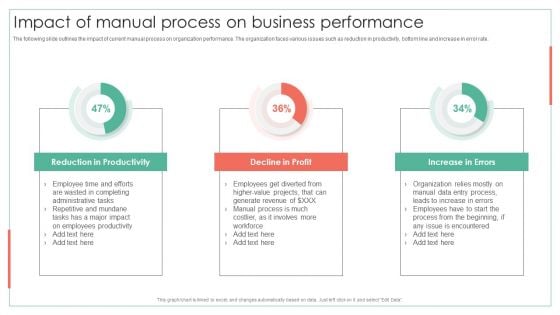
Impact Of Manual Process On Business Performance Achieving Operational Efficiency Guidelines PDF
The following slide outlines the impact of current manual process on organization performance. The organization faces various issues such as reduction in productivity, bottom line and increase in error rate.Deliver and pitch your topic in the best possible manner with this Impact Of Manual Process On Business Performance Achieving Operational Efficiency Guidelines PDF. Use them to share invaluable insights on Reduction Productivity, Increase Errors, Decline Profit and impress your audience. This template can be altered and modified as per your expectations. So, grab it now.
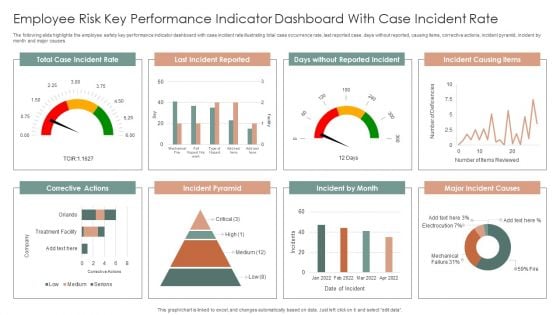
Employee Risk Key Performance Indicator Dashboard With Case Incident Rate Ppt Professional Information PDF
The following slide highlights the employee safety key performance indicator dashboard with case incident rate illustrating total case occurrence rate, last reported case, days without reported, causing items, corrective actions, incident pyramid, incident by month and major causes. Pitch your topic with ease and precision using this Employee Risk Key Performance Indicator Dashboard With Case Incident Rate Ppt Professional Information PDF. This layout presents information on Total Case, Incident Rate, Last Incident Reported, Incident Causing Items. It is also available for immediate download and adjustment. So, changes can be made in the color, design, graphics or any other component to create a unique layout.
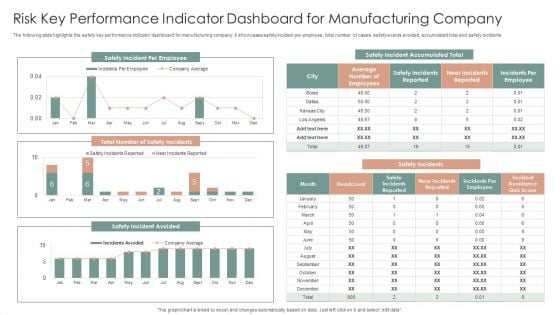
Risk Key Performance Indicator Dashboard For Manufacturing Company Ppt Gallery Graphics Design PDF
The following slide highlights the safety key performance indicator dashboard for manufacturing company. It showcases safety incident per employee, total number of cases, safety events avoided, accumulated total and safety incidents. Pitch your topic with ease and precision using this Risk Key Performance Indicator Dashboard For Manufacturing Company Ppt Gallery Graphics Design PDF. This layout presents information on Safety Incidents, Safety Incident Avoided, Safety Incident Accumulated. It is also available for immediate download and adjustment. So, changes can be made in the color, design, graphics or any other component to create a unique layout.
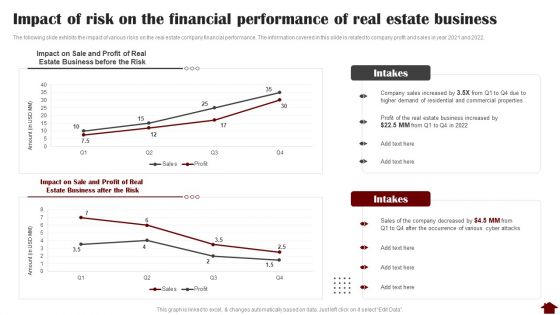
Impact Of Risk On The Financial Performance Of Real Estate Business Graphics PDF
The following slide exhibits the impact of various risks on the real estate company financial performance. The information covered in this slide is related to company profit and sales in year 2021 and 2022. Deliver an awe inspiring pitch with this creative Impact Of Risk On The Financial Performance Of Real Estate Business Graphics PDF bundle. Topics like Sale And Profit, Estate Business, Risk can be discussed with this completely editable template. It is available for immediate download depending on the needs and requirements of the user.
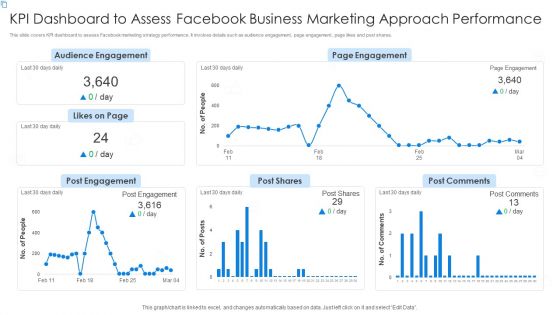
KPI Dashboard To Assess Facebook Business Marketing Approach Performance Portrait PDF
This slide covers KPI dashboard to assess Facebook marketing strategy performance. It involves details such as audience engagement, page engagement, page likes and post shares. Pitch your topic with ease and precision using this KPI Dashboard To Assess Facebook Business Marketing Approach Performance Portrait PDF. This layout presents information on Audience Engagement, Page Engagement, Post Comments. It is also available for immediate download and adjustment. So, changes can be made in the color, design, graphics or any other component to create a unique layout.

Performance Analysis Using Operating Revenue Business Operational Expenditure And Income Metrics Diagrams PDF
This slide illustrates performance analysis using operating revenue, operating expenditure opex and income metrics which can be referred by organizations to evaluate their inflows and outflows to make relevant decisions for increasing profitability. It includes information about operating revenue, operating expense and income before taxes. Pitch your topic with ease and precision using this Performance Analysis Using Operating Revenue Business Operational Expenditure And Income Metrics Diagrams PDF. This layout presents information on Taxes, Highest Operating, Recorded. It is also available for immediate download and adjustment. So, changes can be made in the color, design, graphics or any other component to create a unique layout.
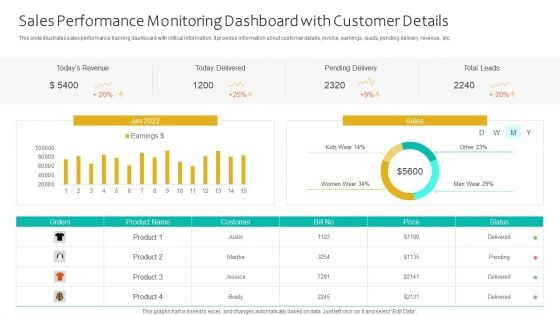
Sales Performance Monitoring Dashboard With Customer Details Ppt Infographics Themes PDF
This slide illustrates sales performance tracking dashboard with critical information. It provides information about customer details, invoice, earnings, leads, pending delivery, revenue, etc. Pitch your topic with ease and precision using this Sales Performance Monitoring Dashboard With Customer Details Ppt Infographics Themes PDF. This layout presents information on Todays Revenue, Today Delivered, Pending Delivery, Total Leads. It is also available for immediate download and adjustment. So, changes can be made in the color, design, graphics or any other component to create a unique layout.
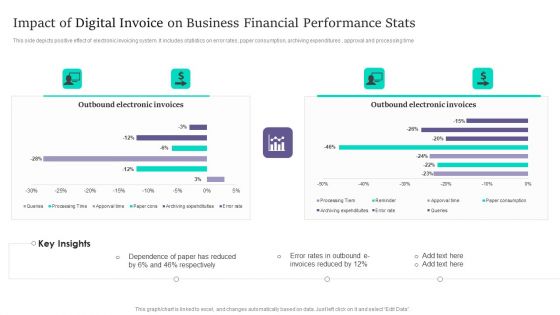
Impact Of Digital Invoice On Business Financial Performance Stats Infographics PDF
This side depicts positive effect of electronic invoicing system. It includes statistics on error rates, paper consumption, archiving expenditures , approval and processing time. Pitch your topic with ease and precision using this Impact Of Digital Invoice On Business Financial Performance Stats Infographics PDF. This layout presents information on Impact Of Digital Invoice, Business Financial Performance Stats. It is also available for immediate download and adjustment. So, changes can be made in the color, design, graphics or any other component to create a unique layout.

Quarterly Sales Performance Of Business Analysis With Key Insights Information PDF
In this slide sales performance of each product is recorded as their percentage share in total sales first quarter of company. The goods include headphones, joystick, mouse pad, bluetooth speaker, etc. Pitch your topic with ease and precision using this Quarterly Sales Performance Of Business Analysis With Key Insights Information PDF. This layout presents information on Wireless Mouse, Keyboard, Mouse Pad, Joystick, Headsets. It is also available for immediate download and adjustment. So, changes can be made in the color, design, graphics or any other component to create a unique layout.
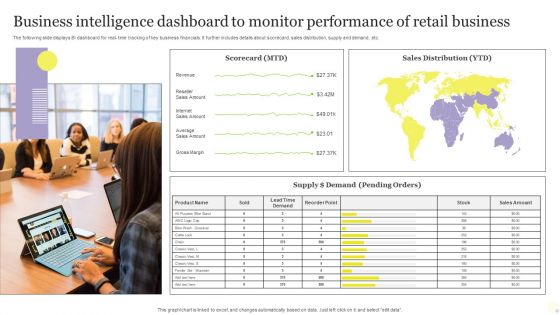
Business Intelligence Dashboard To Monitor Performance Of Retail Business Infographics PDF
The following slide displays BI dashboard for real time tracking of key business financials. It further includes details about scorecard, sales distribution, supply and demand, etc. Pitch your topic with ease and precision using this Business Intelligence Dashboard To Monitor Performance Of Retail Business Infographics PDF. This layout presents information on Business Intelligence Dashboard, Monitor Performance, Retail Business. It is also available for immediate download and adjustment. So, changes can be made in the color, design, graphics or any other component to create a unique layout.
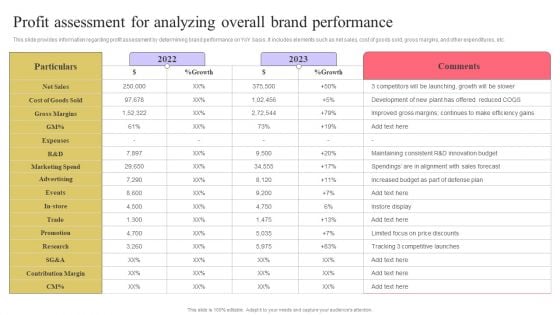
Strengthen Customer Relation Profit Assessment For Analyzing Overall Brand Performance Information PDF
This slide provides information regarding profit assessment by determining brand performance on YoY basis. It includes elements such as net sales, cost of goods sold, gross margins, and other expenditures, etc. Boost your pitch with our creative Strengthen Customer Relation Profit Assessment For Analyzing Overall Brand Performance Information PDF. Deliver an awe-inspiring pitch that will mesmerize everyone. Using these presentation templates you will surely catch everyones attention. You can browse the ppts collection on our website. We have researchers who are experts at creating the right content for the templates. So you dont have to invest time in any additional work. Just grab the template now and use them.
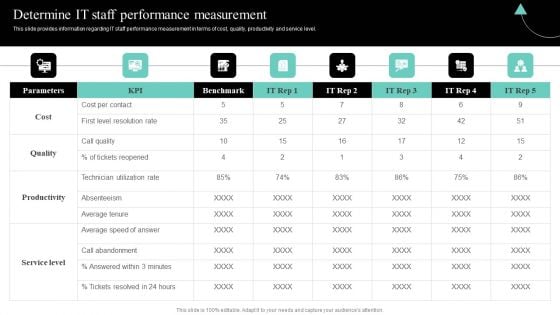
IT Cost Reduction Strategies Determine IT Staff Performance Measurement Topics PDF
This slide provides information regarding IT staff performance measurement in terms of cost, quality, productivity and service level. Slidegeeks is here to make your presentations a breeze with IT Cost Reduction Strategies Determine IT Staff Performance Measurement Topics PDF With our easy-to-use and customizable templates, you can focus on delivering your ideas rather than worrying about formatting. With a variety of designs to choose from, youre sure to find one that suits your needs. And with animations and unique photos, illustrations, and fonts, you can make your presentation pop. So whether youre giving a sales pitch or presenting to the board, make sure to check out Slidegeeks first.
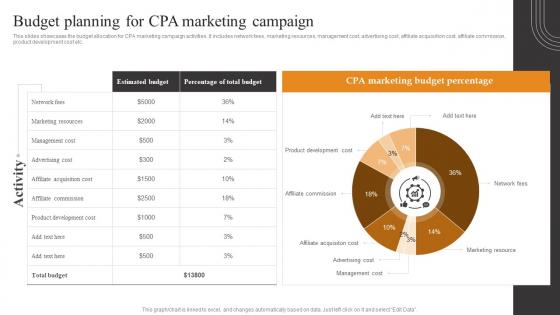
Budget Planning For CPA Tactics To Optimize Corporate Performance Pictures Pdf
This slides showcases the budget allocation for CPA marketing campaign activities. It includes network fees, marketing resources, management cost, advertising cost, affiliate acquisition cost, affiliate commission, product development cost etc. There are so many reasons you need a Budget Planning For CPA Tactics To Optimize Corporate Performance Pictures Pdf. The first reason is you can not spend time making everything from scratch, Thus, Slidegeeks has made presentation templates for you too. You can easily download these templates from our website easily. This slides showcases the budget allocation for CPA marketing campaign activities. It includes network fees, marketing resources, management cost, advertising cost, affiliate acquisition cost, affiliate commission, product development cost etc.
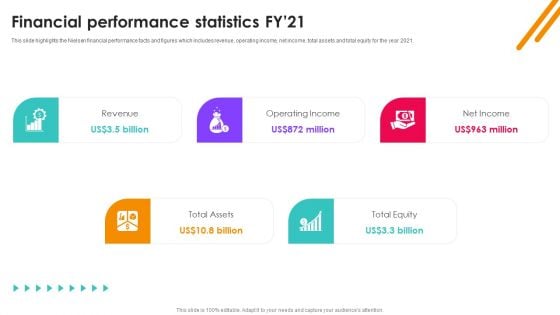
Nielsen Business Profile Financial Performance Statistics Fy21 Ppt PowerPoint Presentation Diagram PDF
This slide highlights the Nielsen financial performance facts and figures which includes revenue, operating income, net income, total assets and total equity for the year 2021. Do you have to make sure that everyone on your team knows about any specific topic I yes, then you should give Nielsen Business Profile Financial Performance Statistics Fy21 Ppt PowerPoint Presentation Diagram PDF a try. Our experts have put a lot of knowledge and effort into creating this impeccable Nielsen Business Profile Financial Performance Statistics Fy21 Ppt PowerPoint Presentation Diagram PDF. You can use this template for your upcoming presentations, as the slides are perfect to represent even the tiniest detail. You can download these templates from the Slidegeeks website and these are easy to edit. So grab these today.
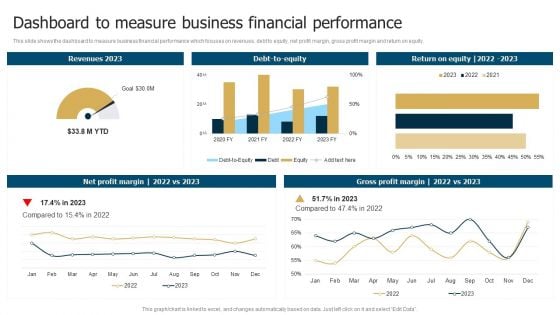
Business Restructuring Process Dashboard To Measure Business Financial Performance Rules PDF
This slide shows the dashboard to measure business financial performance which focuses on revenues, debt to equity, net profit margin, gross profit margin and return on equity. If you are looking for a format to display your unique thoughts, then the professionally designed Business Restructuring Process Dashboard To Measure Business Financial Performance Rules PDF is the one for you. You can use it as a Google Slides template or a PowerPoint template. Incorporate impressive visuals, symbols, images, and other charts. Modify or reorganize the text boxes as you desire. Experiment with shade schemes and font pairings. Alter, share or cooperate with other people on your work. Download Business Restructuring Process Dashboard To Measure Business Financial Performance Rules PDF and find out how to give a successful presentation. Present a perfect display to your team and make your presentation unforgettable.
Naas Architectural Framework Network As A Service Performance Tracking Dashboard Icons PDF
This slide represents the performance tracking dashboard for Naas, covering service availability, inventory details, software compliance status, service level agreement, alert notifications, number of changes and incidents. Here you can discover an assortment of the finest PowerPoint and Google Slides templates. With these templates, you can create presentations for a variety of purposes while simultaneously providing your audience with an eye-catching visual experience. Download Naas Architectural Framework Network As A Service Performance Tracking Dashboard Icons PDF to deliver an impeccable presentation. These templates will make your job of preparing presentations much quicker, yet still, maintain a high level of quality. Slidegeeks has experienced researchers who prepare these templates and write high-quality content for you. Later on, you can personalize the content by editing the Naas Architectural Framework Network As A Service Performance Tracking Dashboard Icons PDF.
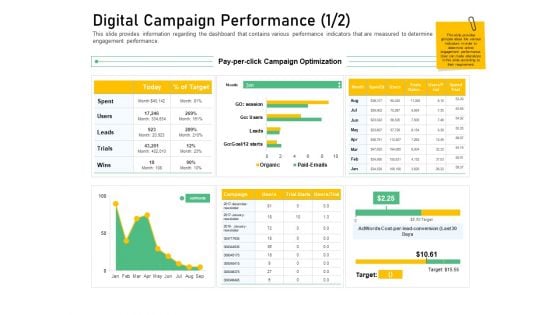
Enhancing Customer Engagement Digital Platform Digital Campaign Performance Cost Demonstration PDF
Deliver and pitch your topic in the best possible manner with this enhancing customer engagement digital platform digital campaign performance cost demonstration pdf. Use them to share invaluable insights on campaign, optimization, target, cost and impress your audience. This template can be altered and modified as per your expectations. So, grab it now.

Performance Metrics Of Online Advertising Digital Marketing Strategy Deployment Download PDF
This slide shows the performance metrics of online advertising that includes clicks, impressions, click through rate, cost per click, cost per thousand impressions and return on investment.This modern and well-arranged Performance Metrics Of Online Advertising Digital Marketing Strategy Deployment Download PDF provides lots of creative possibilities. It is very simple to customize and edit with the Powerpoint Software. Just drag and drop your pictures into the shapes. All facets of this template can be edited with Powerpoint no extra software is necessary. Add your own material, put your images in the places assigned for them, adjust the colors, and then you can show your slides to the world, with an animated slide included.
Organization DAM Services Usage And Performance Tracking To Drive Decisions Graphics PDF
This slide covers the decisions based on usage and assets performance tracking and how digital assets solutions should be so that brands can focus on ROI and better experience. Deliver and pitch your topic in the best possible manner with this Organization DAM Services Usage And Performance Tracking To Drive Decisions Graphics PDF. Use them to share invaluable insights on Best Return Investment, Minimize Costs, Brands Need and impress your audience. This template can be altered and modified as per your expectations. So, grab it now.
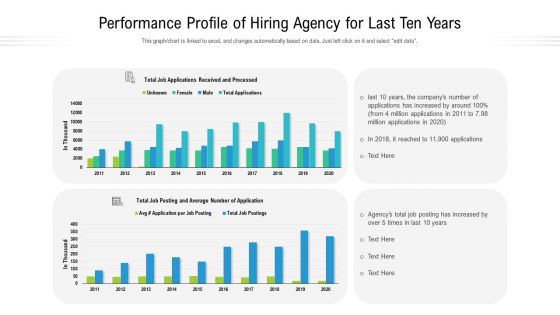
Performance Profile Of Hiring Agency For Last Ten Years Ppt Show Styles PDF
This graph to chart is linked to excel, and changes automatically based on data. Just left click on it and select edit data. Showcasing this set of slides titled performance profile of hiring agency for last ten years ppt show styles pdf. The topics addressed in these templates are performance profile of hiring agency for last ten years. All the content presented in this PPT design is completely editable. Download it and make adjustments in color, background, font etc. as per your unique business setting.
Email Marketing Dashboard Illustrating Campaign Performance Results Ppt PowerPoint Presentation File Icon PDF
Mentioned slide displays email campaign dashboard which can be used by marketers to track performance of their marketing campaigns. Marketers can track metrics such as total subscribers growth, overall bounce rate, unsubscribe rate, open rate, click rate etc. Showcasing this set of slides titled email marketing dashboard illustrating campaign performance results ppt powerpoint presentation file icon pdf. The topics addressed in these templates are marketing, list health, total subscribers, percentage. All the content presented in this PPT design is completely editable. Download it and make adjustments in color, background, font etc. as per your unique business setting.
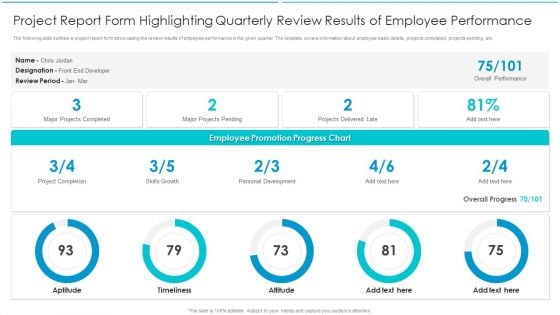
Project Report Form Highlighting Quarterly Review Results Of Employee Performance Brochure PDF
The following slide outlines a project report form showcasing the review results of employee performance in the given quarter. The template covers information about employee basic details, projects completed, projects pending, etc. Showcasing this set of slides titled Project Report Form Highlighting Quarterly Review Results Of Employee Performance Brochure PDF. The topics addressed in these templates are Growth, Development, Timeliness. All the content presented in this PPT design is completely editable. Download it and make adjustments in color, background, font etc. as per your unique business setting.
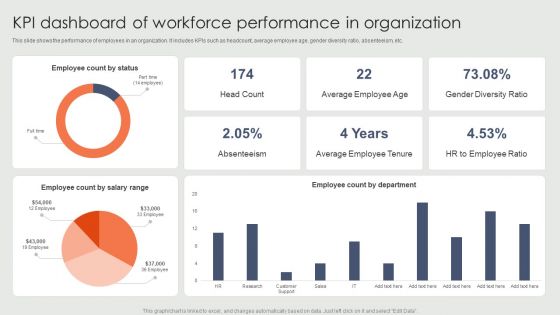
KPI Dashboard Of Workforce Performance In Organization Ppt Gallery Portfolio PDF
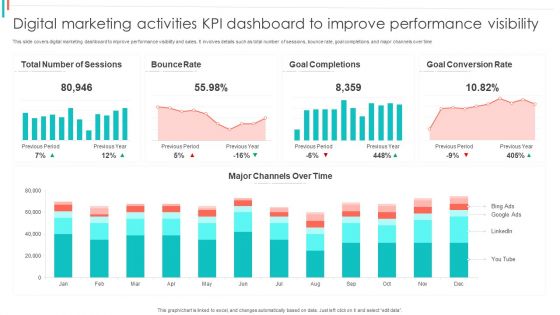
Digital Marketing Activities KPI Dashboard To Improve Performance Visibility Summary PDF
This slide covers digital marketing dashboard to improve performance visibility and sales. It involves details such as total number of sessions, bounce rate, goal completions and major channels over time.Showcasing this set of slides titled Digital Marketing Activities KPI Dashboard To Improve Performance Visibility Summary PDF. The topics addressed in these templates are Bounce Rate, Goal Completions, Goal Conversion. All the content presented in this PPT design is completely editable. Download it and make adjustments in color, background, font etc. as per your unique business setting.
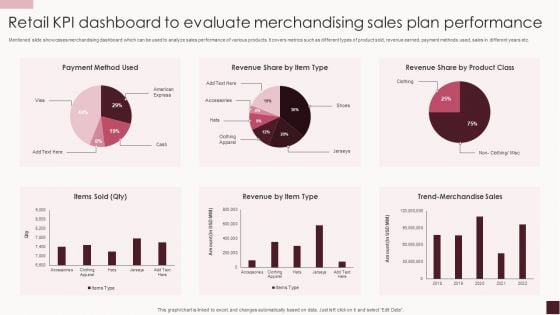
Retail KPI Dashboard To Evaluate Merchandising Sales Plan Performance Rules PDF
Mentioned slide showcases merchandising dashboard which can be used to analyze sales performance of various products. It covers metrics such as different types of product sold, revenue earned, payment methods used, sales in different years etc.Showcasing this set of slides titled Retail KPI Dashboard To Evaluate Merchandising Sales Plan Performance Rules PDF. The topics addressed in these templates are Clothing Apparel, Trend Merchandise, Items Sold. All the content presented in this PPT design is completely editable. Download it and make adjustments in color, background, font etc. as per your unique business setting.
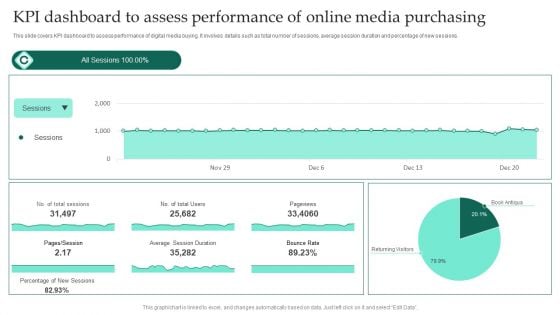
KPI Dashboard To Assess Performance Of Online Media Purchasing Ppt Professional Grid PDF
This slide covers KPI dashboard to assess performance of digital media buying. It involves details such as total number of sessions, average session duration and percentage of new sessions. Showcasing this set of slides titled KPI Dashboard To Assess Performance Of Online Media Purchasing Ppt Professional Grid PDF. The topics addressed in these templates are Average Session Duration, Bounce Rate, Pageviews. All the content presented in this PPT design is completely editable. Download it and make adjustments in color, background, font etc. as per your unique business setting.
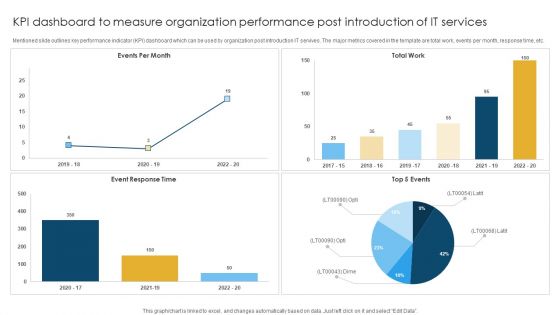
KPI Dashboard To Measure Organization Performance Post Introduction Of IT Services Rules PDF
Mentioned slide outlines key performance indicator KPI dashboard which can be used by organization post introduction IT servives. The major metrics covered in the template are total work, events per month, response time, etc. Showcasing this set of slides titled KPI Dashboard To Measure Organization Performance Post Introduction Of IT Services Rules PDF. The topics addressed in these templates are Event Response, Total Work, Events Per. All the content presented in this PPT design is completely editable. Download it and make adjustments in color, background, font etc. as per your unique business setting.
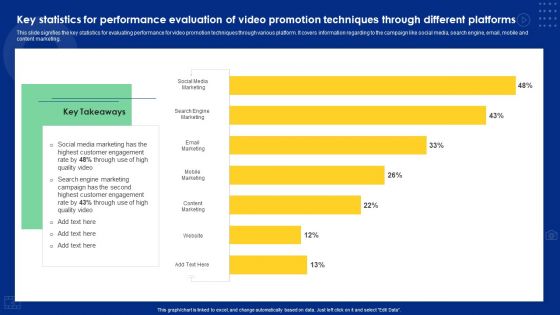
Key Statistics For Performance Evaluation Of Video Promotion Techniques Through Different Platforms Sample PDF
This slide signifies the key statistics for evaluating performance for video promotion techniques through various platform. It covers information regarding to the campaign like social media, search engine, email, mobile and content marketing. Showcasing this set of slides titled Key Statistics For Performance Evaluation Of Video Promotion Techniques Through Different Platforms Sample PDF. The topics addressed in these templates are Social Media Marketing, Search Engine Marketing, Email Marketing. All the content presented in this PPT design is completely editable. Download it and make adjustments in color, background, font etc. as per your unique business setting.


 Continue with Email

 Home
Home


