Gauge Chart
Key Indicator Dashboard Of Vertical Channel Marketing Software Ppt Icon Templates Pdf
This slide showcases the key indicators for vertical channel marketing software. This further includes reach, engagement and conversion data along with geography and industry. Showcasing this set of slides titled Key Indicator Dashboard Of Vertical Channel Marketing Software Ppt Icon Templates Pdf. The topics addressed in these templates are Reach, Engagement, Conversion. All the content presented in this PPT design is completely editable. Download it and make adjustments in color, background, font etc. as per your unique business setting. This slide showcases the key indicators for vertical channel marketing software. This further includes reach, engagement and conversion data along with geography and industry.
Synchronized Cardioversion Indications In Powerpoint And Google Slides Cpb
Introducing our well designed Synchronized Cardioversion Indications In Powerpoint And Google Slides Cpb. This PowerPoint design presents information on topics like Synchronized Cardioversion Indications. As it is predesigned it helps boost your confidence level. It also makes you a better presenter because of its high-quality content and graphics. This PPT layout can be downloaded and used in different formats like PDF, PNG, and JPG. Not only this, it is available in both Standard Screen and Widescreen aspect ratios for your convenience. Therefore, click on the download button now to persuade and impress your audience. Our Synchronized Cardioversion Indications In Powerpoint And Google Slides Cpb are topically designed to provide an attractive backdrop to any subject. Use them to look like a presentation pro.
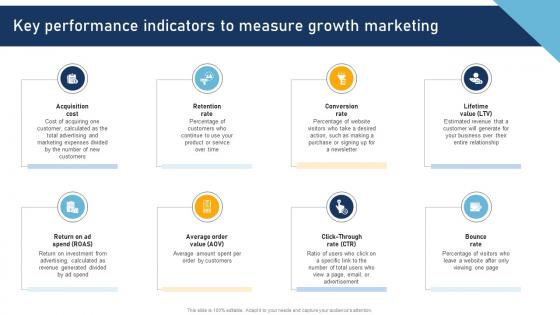
A Comprehensive Approach To Key Performance Indicators To Measure Growth MKT SS V
Whether you have daily or monthly meetings, a brilliant presentation is necessary. A Comprehensive Approach To Key Performance Indicators To Measure Growth MKT SS V can be your best option for delivering a presentation. Represent everything in detail using A Comprehensive Approach To Key Performance Indicators To Measure Growth MKT SS V and make yourself stand out in meetings. The template is versatile and follows a structure that will cater to your requirements. All the templates prepared by Slidegeeks are easy to download and edit. Our research experts have taken care of the corporate themes as well. So, give it a try and see the results. Our A Comprehensive Approach To Key Performance Indicators To Measure Growth MKT SS V are topically designed to provide an attractive backdrop to any subject. Use them to look like a presentation pro.
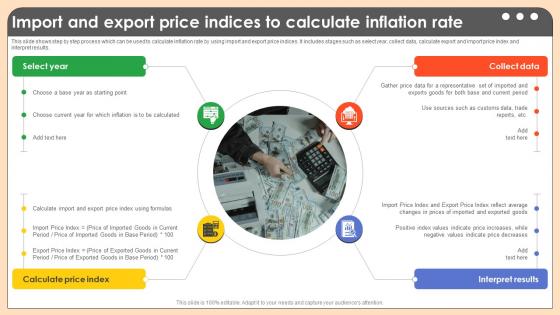
Import And Export Price Indices To Calculate Comprehensive Guide On Inflation Control CM SS V
This slide shows step by step process which can be used to calculate inflation rate by using import and export price indices. It includes stages such as select year, collect data, calculate export and import price index and interpret results. This Import And Export Price Indices To Calculate Comprehensive Guide On Inflation Control CM SS V is perfect for any presentation, be it in front of clients or colleagues. It is a versatile and stylish solution for organizing your meetings. The Import And Export Price Indices To Calculate Comprehensive Guide On Inflation Control CM SS V features a modern design for your presentation meetings. The adjustable and customizable slides provide unlimited possibilities for acing up your presentation. Slidegeeks has done all the homework before launching the product for you. So, do not wait, grab the presentation templates today This slide shows step by step process which can be used to calculate inflation rate by using import and export price indices. It includes stages such as select year, collect data, calculate export and import price index and interpret results.

Performance Indicators For Successful Client Onboarding Themes PDF
This slide showcases KPIs that showcases success of user onboarding. Major KPIs included are customer engagement, retention and count, average response time, completion and free trial conversion rate. If you are looking for a format to display your unique thoughts, then the professionally designed Performance Indicators For Successful Client Onboarding Themes PDF is the one for you. You can use it as a Google Slides template or a PowerPoint template. Incorporate impressive visuals, symbols, images, and other charts. Modify or reorganize the text boxes as you desire. Experiment with shade schemes and font pairings. Alter, share or cooperate with other people on your work. Download Performance Indicators For Successful Client Onboarding Themes PDF and find out how to give a successful presentation. Present a perfect display to your team and make your presentation unforgettable.
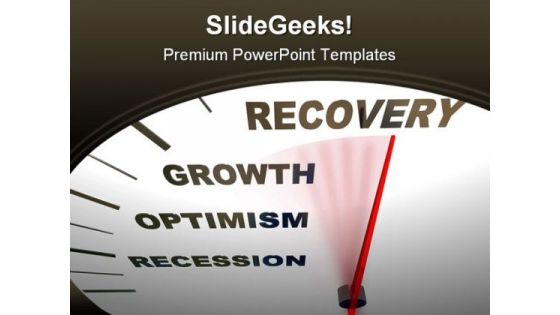
Recovery Future PowerPoint Template 0610
A speedometer with red needle pointing to Recovery rising up from Recession Dazzle the audience with your thoughts. Our Recovery Future PowerPoint Template 0610 will leave them wide-eyed.
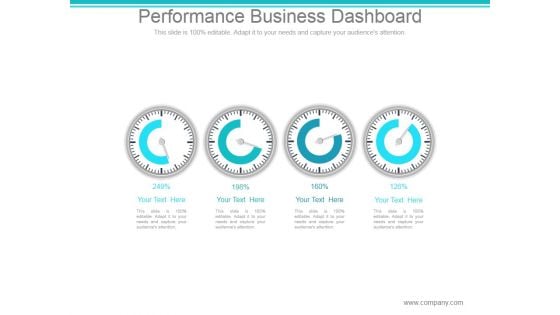
Performance Business Dashboard Ppt PowerPoint Presentation Visuals
This is a performance business dashboard ppt powerpoint presentation visuals. This is a four stage process. The stages in this process are dashboard, speedometer, report, business, marketing.
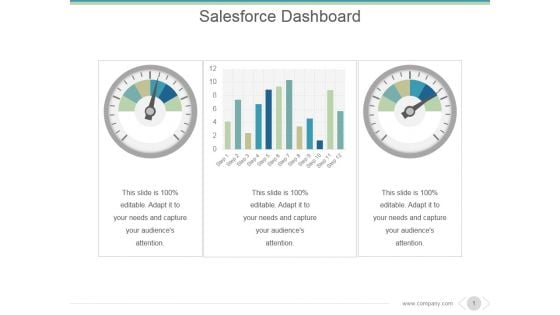
Salesforce Dashboard Ppt PowerPoint Presentation Summary
This is a salesforce dashboard ppt powerpoint presentation summary. This is a two stage process. The stages in this process are business, marketing, dashboard, graph, speedometer.
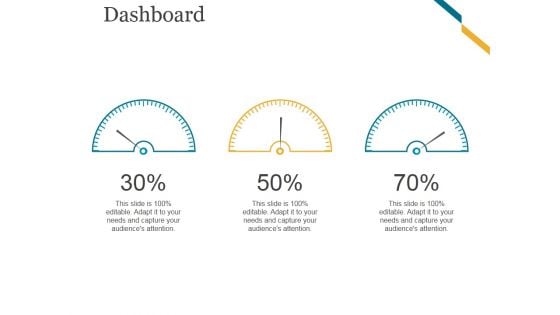
Dashboard Ppt PowerPoint Presentation Infographic Template Tips
This is a dashboard ppt powerpoint presentation infographic template tips. This is a three stage process. The stages in this process are speedometer, dashboard, business, marketing, equipment.
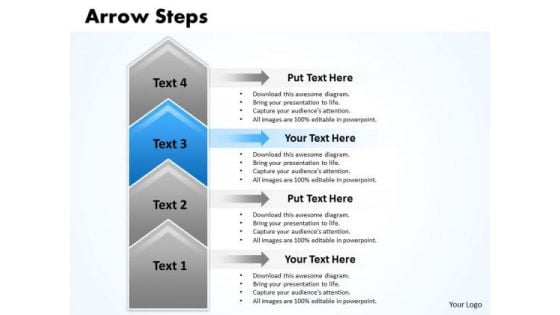
Business Ppt Arrow Create PowerPoint Macro 4 Stages Management Graphic
We present our Business PPT arrow create PowerPoint macro 4 stages management Graphic. Use our Arrows PowerPoint Templates because, designed to help bullet-point your views and thoughts. Use our Process and Flows PowerPoint Templates because, it is in your DNA to analyses possible causes to the minutest detail. Use our Business PowerPoint Templates because, they are indicators of the path you have in mind. Use our Marketing PowerPoint Templates because; in any endeavor people matter most. Use our Shapes PowerPoint Templates because; Blaze a brilliant trail from point to point. Use these PowerPoint slides for presentations relating to Algorithm, Arrow, Chart, Block, Diagram, Business, Chart, Connection, Design, Development, Diagram, Direction, Element, Flow, Chart, Flow, Diagram, Flowchart, Graph, Kind, Of, Diagram, Linear, Diagram, Management, Model, Module, Motion, Organization, Plan, Process, Arrows, Process, Chart, Process, Diagram, Process, Flow, Program, Section, Segment, Set, Sign, Solution, Strategy, Symbol, Technology. The prominent colors used in the PowerPoint template are Blue, Gray, and Black Get rid of the fat with our Business Ppt Arrow Create PowerPoint Macro 4 Stages Management Graphic. Get to the meat with your thoughts.
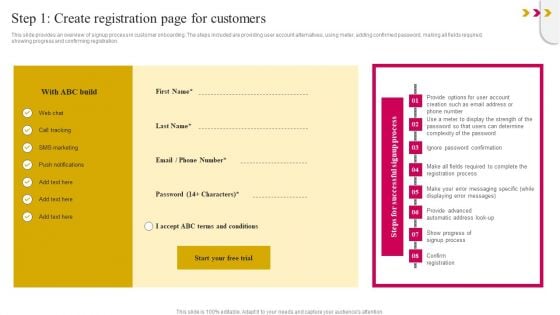
Step 1 Create Registration Page For Customers Guidelines PDF
This slide provides an overview of signup process in customer onboarding. The steps included are providing user account alternatives, using meter, adding confirmed password, making all fields required, showing progress and confirming registration. If you are looking for a format to display your unique thoughts, then the professionally designed Step 1 Create Registration Page For Customers Guidelines PDF is the one for you. You can use it as a Google Slides template or a PowerPoint template. Incorporate impressive visuals, symbols, images, and other charts. Modify or reorganize the text boxes as you desire. Experiment with shade schemes and font pairings. Alter, share or cooperate with other people on your work. Download Step 1 Create Registration Page For Customers Guidelines PDF and find out how to give a successful presentation. Present a perfect display to your team and make your presentation unforgettable.
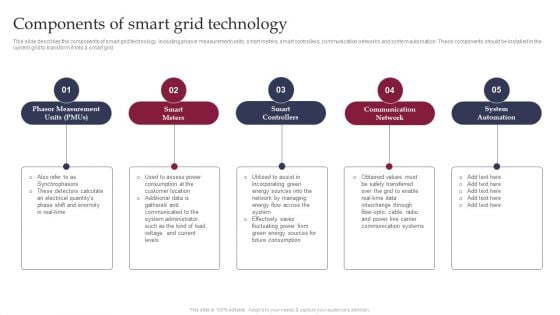
Smart Grid Technology Components Of Smart Grid Technology Rules PDF
Cybersecurity Key Performance Indicator And Padlock Icon Clipart Pdf
Showcasing this set of slides titled Cybersecurity Key Performance Indicator And Padlock Icon Clipart Pdf The topics addressed in these templates are Cybersecurity Key, Performance Indicator, Padlock Icon All the content presented in this PPT design is completely editable. Download it and make adjustments in color, background, font etc. as per your unique business setting. Our Cybersecurity Key Performance Indicator And Padlock Icon Clipart Pdf are topically designed to provide an attractive backdrop to any subject. Use them to look like a presentation pro.
Human Resource Analytics Key Performance Indicator Icon Elements Pdf
Showcasing this set of slides titled Human Resource Analytics Key Performance Indicator Icon Elements Pdf The topics addressed in these templates are Human Resource, Analytics Key Performance, Indicator Icon All the content presented in this PPT design is completely editable. Download it and make adjustments in color, background, font etc. as per your unique business setting. Our Human Resource Analytics Key Performance Indicator Icon Elements Pdf are topically designed to provide an attractive backdrop to any subject. Use them to look like a presentation pro.
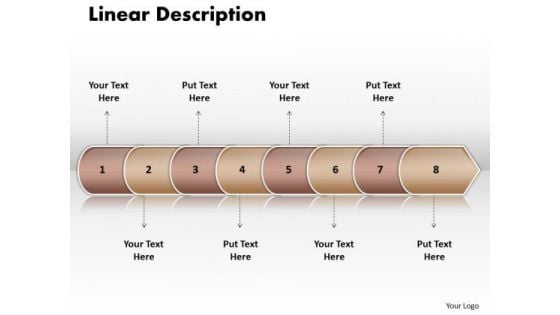
Ppt Linear Arrow 8 Stages PowerPoint Templates
PPT linear arrow 8 stages PowerPoint Templates-In this Linear Arrow process flow chart, arrows show the flow, or movement, of the process from one step to the next. -PPT linear arrow 8 stages PowerPoint Templates-Arrow, Background, Collection, Completed, Concept, Confirmation, Design, Flow, Graph, Graphic, Illustration, Indication, Indicator, Information, Instruction, Interface, Internet, Layout, Measurement, Order, Phase, Pointer, Process, Progress, Reflection, Scale, Shape, Sign Get directly to the point with our Ppt Linear Arrow 8 Stages PowerPoint Templates. Dont pass up this opportunity to shine.
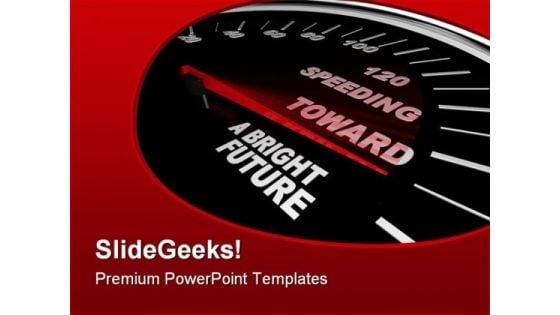
Speeding Towards Future PowerPoint Themes And PowerPoint Slides 0811
Microsoft PowerPoint Theme and Slide with the red needle on a speedometer points to the phrase speeding toward a bright future Become the crowd favourite with our Speeding Towards Future PowerPoint Themes And PowerPoint Slides 0811. Get them all clamouring for you.
Speeding Toward Victory Success PowerPoint Themes And PowerPoint Slides 0311
Microsoft PowerPoint Theme and Slide with a speedometer showing the needle pushing toward the word victory Change the face of your environment with our Speeding Toward Victory Success PowerPoint Themes And PowerPoint Slides 0311. Bring in exciting changes with your ideas.
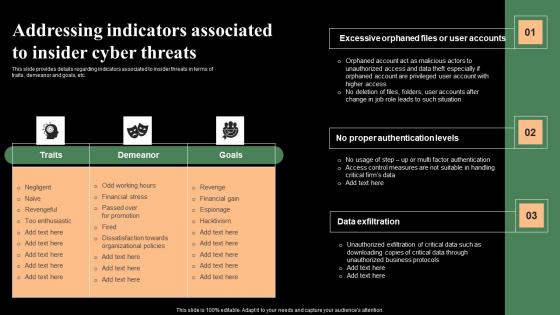
Addressing Indicators Associated To Insider Cyber Threats Monitoring Digital Assets Themes Pdf
This slide provides details regarding indicators associated to insider threats in terms of traits, demeanor and goals, etc. Presenting this PowerPoint presentation, titled Addressing Indicators Associated To Insider Cyber Threats Monitoring Digital Assets Themes Pdf with topics curated by our researchers after extensive research. This editable presentation is available for immediate download and provides attractive features when used. Download now and captivate your audience. Presenting this Addressing Indicators Associated To Insider Cyber Threats Monitoring Digital Assets Themes Pdf Our researchers have carefully researched and created these slides with all aspects taken into consideration. This is a completely customizable Addressing Indicators Associated To Insider Cyber Threats Monitoring Digital Assets Themes Pdf that is available for immediate downloading. Download now and make an impact on your audience. Highlight the attractive features available with our PPTs. This slide provides details regarding indicators associated to insider threats in terms of traits, demeanor and goals, etc.
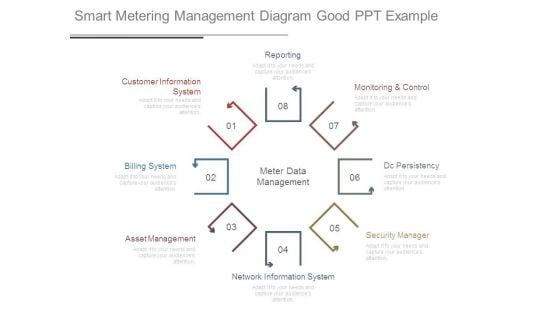
Smart Metering Management Diagram Good Ppt Example
This is a smart metering management diagram good ppt example. This is a eight stage process. The stages in this process are reporting, customer information system, billing system, asset management, network information system, security manager, dc persistency, monitoring and control, meter data management.
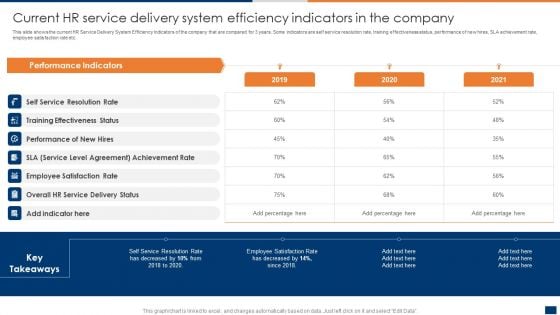
Current HR Service Delivery System Efficiency Indicators In The Company Ppt PowerPoint Presentation File Deck PDF
This slide shows the current HR Service Delivery System Efficiency Indicators of the company that are compared for 3 years. Some indicators are self service resolution rate, training effectiveness status, performance of new hires, SLA achievement rate, employee satisfaction rate etc. If you are looking for a format to display your unique thoughts, then the professionally designed Current HR Service Delivery System Efficiency Indicators In The Company Ppt PowerPoint Presentation File Deck PDF is the one for you. You can use it as a Google Slides template or a PowerPoint template. Incorporate impressive visuals, symbols, images, and other charts. Modify or reorganize the text boxes as you desire. Experiment with shade schemes and font pairings. Alter, share or cooperate with other people on your work. Download Current HR Service Delivery System Efficiency Indicators In The Company Ppt PowerPoint Presentation File Deck PDF and find out how to give a successful presentation. Present a perfect display to your team and make your presentation unforgettable.
Meter Statistic Analytics Ppt Diagram Powerpoint Templates
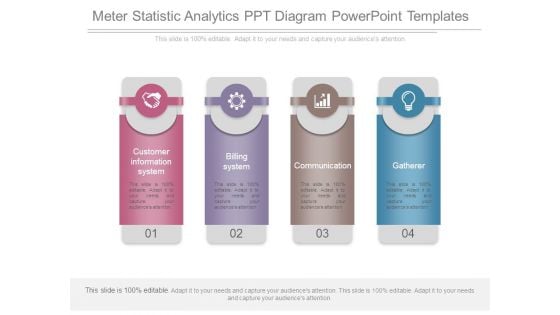
This is a meter statistic analytics ppt diagram powerpoint templates. This is a four stage process. The stages in this process are customer information system, billing system, communication, gatherer.
Evaluation For Stakeholder Success Indicators Impact Shareholder Decisions With Stakeholder Administration Clipart PDF
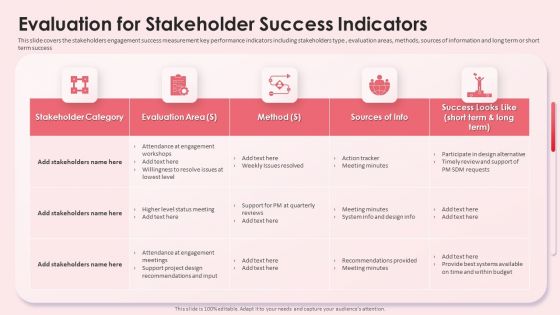
This slide covers the stakeholders engagement success measurement key performance indicators including stakeholders type , evaluation areas, methods, sources of information and long term or short term success. If you are looking for a format to display your unique thoughts, then the professionally designed Evaluation For Stakeholder Success Indicators Impact Shareholder Decisions With Stakeholder Administration Clipart PDF is the one for you. You can use it as a Google Slides template or a PowerPoint template. Incorporate impressive visuals, symbols, images, and other charts. Modify or reorganize the text boxes as you desire. Experiment with shade schemes and font pairings. Alter, share or cooperate with other people on your work. Download Evaluation For Stakeholder Success Indicators Impact Shareholder Decisions With Stakeholder Administration Clipart PDF and find out how to give a successful presentation. Present a perfect display to your team and make your presentation unforgettable.
Market Evaluation Of IT Industry Key Performance Indicators To Track Marketing Campaign Performance Slides PDF
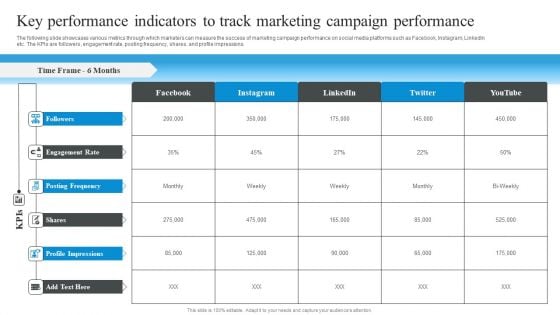
The following slide showcases various metrics through which marketers can measure the success of marketing campaign performance on social media platforms such as Facebook, Instagram, LinkedIn etc. The KPIs are followers, engagement rate, posting frequency, shares, and profile impressions. If you are looking for a format to display your unique thoughts, then the professionally designed Market Evaluation Of IT Industry Key Performance Indicators To Track Marketing Campaign Performance Slides PDF is the one for you. You can use it as a Google Slides template or a PowerPoint template. Incorporate impressive visuals, symbols, images, and other charts. Modify or reorganize the text boxes as you desire. Experiment with shade schemes and font pairings. Alter, share or cooperate with other people on your work. Download Market Evaluation Of IT Industry Key Performance Indicators To Track Marketing Campaign Performance Slides PDF and find out how to give a successful presentation. Present a perfect display to your team and make your presentation unforgettable.
IoT Applications To Enhance Home Energy Internet Of Things Solutions To Enhance Energy IoT SS V
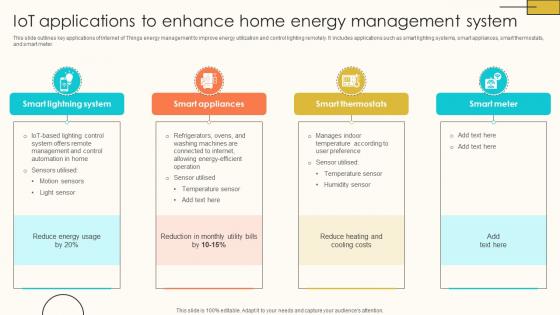
This slide outlines key applications of Internet of Things energy management to improve energy utilization and control lighting remotely. It includes applications such as smart lighting systems, smart appliances, smart thermostats, and smart meter. If you are looking for a format to display your unique thoughts, then the professionally designed IoT Applications To Enhance Home Energy Internet Of Things Solutions To Enhance Energy IoT SS V is the one for you. You can use it as a Google Slides template or a PowerPoint template. Incorporate impressive visuals, symbols, images, and other charts. Modify or reorganize the text boxes as you desire. Experiment with shade schemes and font pairings. Alter, share or cooperate with other people on your work. Download IoT Applications To Enhance Home Energy Internet Of Things Solutions To Enhance Energy IoT SS V and find out how to give a successful presentation. Present a perfect display to your team and make your presentation unforgettable. This slide outlines key applications of Internet of Things energy management to improve energy utilization and control lighting remotely. It includes applications such as smart lighting systems, smart appliances, smart thermostats, and smart meter.

Key Performance Indicators For Power Strategy Template Pdf
This slide shows key performance indicators for energy plan. The purpose of this slide is to highlight main key performance indicators that should be considered for performance measurement. It include indicators such as facility wide units and process unit levels, etc.Pitch your topic with ease and precision using this Key Performance Indicators For Power Strategy Template Pdf This layout presents information on Electricity Consumption, Process Measuring, Temperature Steam Systems It is also available for immediate download and adjustment. So, changes can be made in the color, design, graphics or any other component to create a unique layout. This slide shows key performance indicators for energy plan. The purpose of this slide is to highlight main key performance indicators that should be considered for performance measurement. It include indicators such as facility wide units and process unit levels, etc.
Alarm Clock With Speed Meter Powerpoint Templates
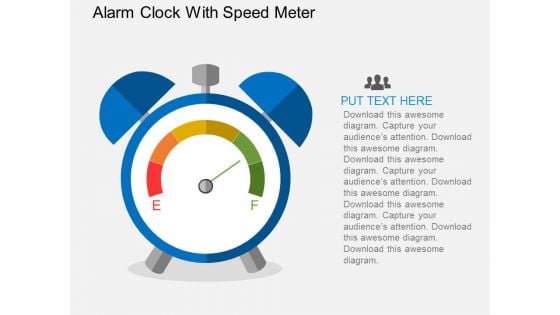
Our above PPT slide contains graphics of alarm clock with speed meter. This PowerPoint template helps to display concept of deadlines and performance. Use this diagram to create more sound impact on viewers.
Meter For Competitive Advantage Presentation Template
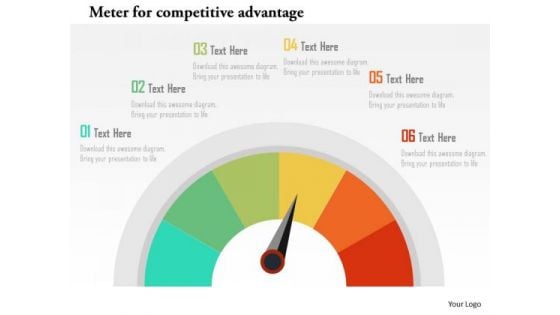
This pre-designed diagram of meter signifies the concept of competitive advantage. This template is carefully designed to look interesting and informative. Use this theme to give unified look to your presentations.
Key Economic Indicators To Forecast Inflation Strategies For Inflation A Tactical Guide Fin SS V
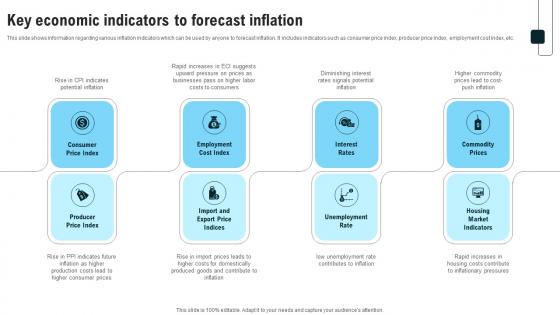
This slide shows information regarding various inflation indicators which can be used by anyone to forecast inflation. It includes indicators such as consumer price index, producer price index, employment cost index, etc. Retrieve professionally designed Key Economic Indicators To Forecast Inflation Strategies For Inflation A Tactical Guide Fin SS V to effectively convey your message and captivate your listeners. Save time by selecting pre-made slideshows that are appropriate for various topics, from business to educational purposes. These themes come in many different styles, from creative to corporate, and all of them are easily adjustable and can be edited quickly. Access them as PowerPoint templates or as Google Slides themes. You do not have to go on a hunt for the perfect presentation because Slidegeeks got you covered from everywhere. This slide shows information regarding various inflation indicators which can be used by anyone to forecast inflation. It includes indicators such as consumer price index, producer price index, employment cost index, etc.

Meter For Speed Control Powerpoint Templates
Our professionally designed business diagram is as an effective tool for communicating business ideas and strategies for corporate planning. It contains graphics of speed control meter. Above slide is suitable to display business options with technology.
Key Indicators For Sustainable Manufacturing Implementing Manufacturing Strategy SS V
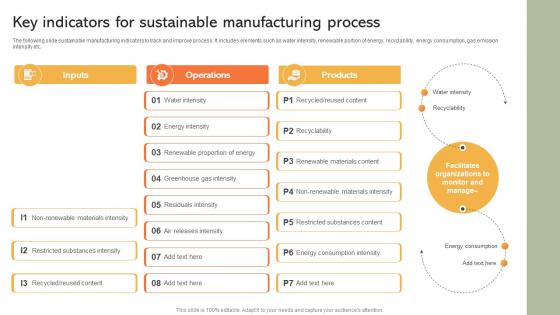
The following slide sustainable manufacturing indicators to track and improve process. It includes elements such as water intensity, renewable portion of energy, recyclability, energy consumption, gas emission intensity etc. Presenting this PowerPoint presentation, titled Key Indicators For Sustainable Manufacturing Implementing Manufacturing Strategy SS V, with topics curated by our researchers after extensive research. This editable presentation is available for immediate download and provides attractive features when used. Download now and captivate your audience. Presenting this Key Indicators For Sustainable Manufacturing Implementing Manufacturing Strategy SS V. Our researchers have carefully researched and created these slides with all aspects taken into consideration. This is a completely customizable Key Indicators For Sustainable Manufacturing Implementing Manufacturing Strategy SS V that is available for immediate downloading. Download now and make an impact on your audience. Highlight the attractive features available with our PPTs. The following slide sustainable manufacturing indicators to track and improve process. It includes elements such as water intensity, renewable portion of energy, recyclability, energy consumption, gas emission intensity etc.
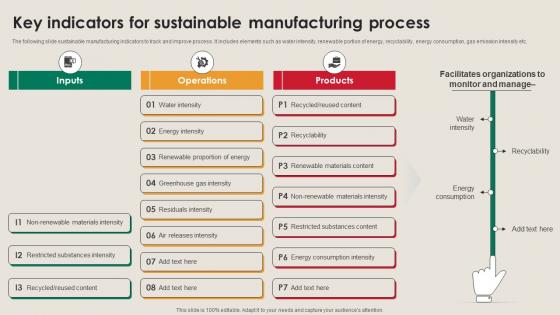
Key Indicators For Sustainable Manufacturing Strategy Driving Industry 4 0
The following slide sustainable manufacturing indicators to track and improve process. It includes elements such as water intensity, renewable portion of energy, recyclability, energy consumption, gas emission intensity etc. Presenting this PowerPoint presentation, titled Key Indicators For Sustainable Manufacturing Strategy Driving Industry 4 0, with topics curated by our researchers after extensive research. This editable presentation is available for immediate download and provides attractive features when used. Download now and captivate your audience. Presenting this Key Indicators For Sustainable Manufacturing Strategy Driving Industry 4 0. Our researchers have carefully researched and created these slides with all aspects taken into consideration. This is a completely customizable Key Indicators For Sustainable Manufacturing Strategy Driving Industry 4 0 that is available for immediate downloading. Download now and make an impact on your audience. Highlight the attractive features available with our PPTs. The following slide sustainable manufacturing indicators to track and improve process. It includes elements such as water intensity, renewable portion of energy, recyclability, energy consumption, gas emission intensity etc.
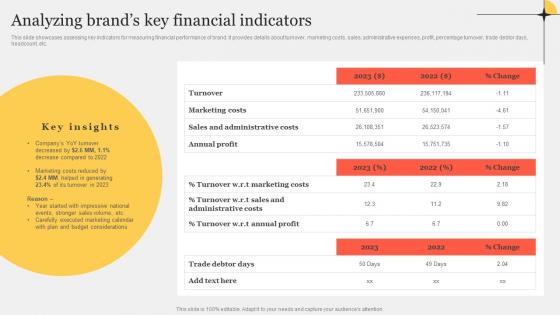
Analyzing Brands Key Financial Indicators Improving Customer Interaction Through Microsoft Pdf
This slide showcases assessing key indicators for measuring financial performance of brand. It provides details about turnover, marketing costs, sales, administrative expenses, profit, percentage turnover, trade debtor days, headcount, etc.Find highly impressive Analyzing Brands Key Financial Indicators Improving Customer Interaction Through Microsoft Pdf on Slidegeeks to deliver a meaningful presentation. You can save an ample amount of time using these presentation templates. No need to worry to prepare everything from scratch because Slidegeeks experts have already done a huge research and work for you. You need to download Analyzing Brands Key Financial Indicators Improving Customer Interaction Through Microsoft Pdf for your upcoming presentation. All the presentation templates are 100Precent editable and you can change the color and personalize the content accordingly. Download now. This slide showcases assessing key indicators for measuring financial performance of brand. It provides details about turnover, marketing costs, sales, administrative expenses, profit, percentage turnover, trade debtor days, headcount, etc.
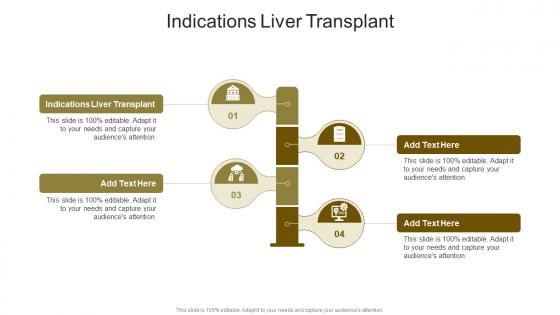
Indications Liver Transplant In Powerpoint And Google Slides Cpb
Introducing our well designed Indications Liver Transplant In Powerpoint And Google Slides Cpb. This PowerPoint design presents information on topics like Indications Liver Transplant. As it is predesigned it helps boost your confidence level. It also makes you a better presenter because of its high quality content and graphics. This PPT layout can be downloaded and used in different formats like PDF, PNG, and JPG. Not only this, it is available in both Standard Screen and Widescreen aspect ratios for your convenience. Therefore, click on the download button now to persuade and impress your audience. Our Indications Liver Transplant In Powerpoint And Google Slides Cpb are topically designed to provide an attractive backdrop to any subject. Use them to look like a presentation pro.
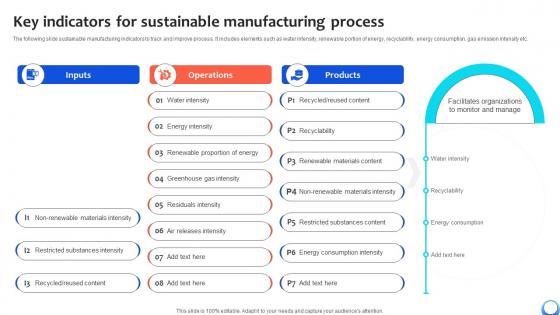
Key Indicators For Sustainable Manufacturing Automating Production Process Strategy SS V
The following slide sustainable manufacturing indicators to track and improve process. It includes elements such as water intensity, renewable portion of energy, recyclability, energy consumption, gas emission intensity etc. Presenting this PowerPoint presentation, titled Key Indicators For Sustainable Manufacturing Automating Production Process Strategy SS V, with topics curated by our researchers after extensive research. This editable presentation is available for immediate download and provides attractive features when used. Download now and captivate your audience. Presenting this Key Indicators For Sustainable Manufacturing Automating Production Process Strategy SS V. Our researchers have carefully researched and created these slides with all aspects taken into consideration. This is a completely customizable Key Indicators For Sustainable Manufacturing Automating Production Process Strategy SS V that is available for immediate downloading. Download now and make an impact on your audience. Highlight the attractive features available with our PPTs. The following slide sustainable manufacturing indicators to track and improve process. It includes elements such as water intensity, renewable portion of energy, recyclability, energy consumption, gas emission intensity etc.

Key Findings Ppt PowerPoint Presentation Complete Deck With Slides
This is a key findings ppt powerpoint presentation complete deck with slides. This is a one stage process. The stages in this process are key findings, management, planning, business, analysis.

Ecstatic Happy Business PowerPoint Backgrounds And Templates 1210
Microsoft PowerPoint Template and Background with ecstatic happiness depicted on a speedometer with red needle speeding past each word Feature your views with our Ecstatic Happy Business PowerPoint Backgrounds And Templates 1210. They will get the desired exposure.
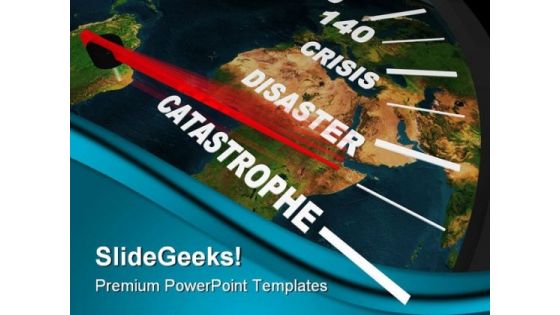
Speeding Global Catastrophe Travel PowerPoint Templates And PowerPoint Backgrounds 0211
Microsoft PowerPoint Template and Background with a speedometer on the earth shows humanity speeding toward global catastrophe Assess consumer choices with our Speeding Global Catastrophe Travel PowerPoint Templates And PowerPoint Backgrounds 0211. Get an idea of their buying patterns.
Speeding Toward Victory Success PowerPoint Templates And PowerPoint Backgrounds 0311
Microsoft PowerPoint Template and Background with a speedometer showing the needle pushing toward the word victory Our Speeding Toward Victory Success PowerPoint Templates And PowerPoint Backgrounds 0311 give you a ready to use structure. You won't need to fabricate anything.
Drunk Buzzed Business PowerPoint Templates And PowerPoint Backgrounds 0811
Microsoft PowerPoint Template and Background with a speedometer measuring how drunk the driver is Everything falls into place with our Drunk Buzzed Business PowerPoint Templates And PowerPoint Backgrounds 0811. They have the correct slots for all your ideas.
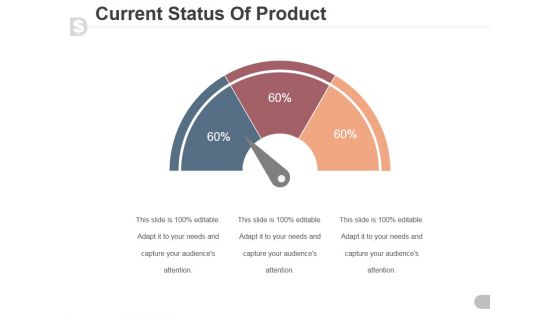
Current Status Of Product Ppt PowerPoint Presentation Designs Download
This is a current status of product ppt powerpoint presentation designs download. This is a three stage process. The stages in this process are speedometer, dashboard, business, marketing, finance.

Sales Team Performance Meter Ppt PowerPoint Presentation Diagrams
This is a sales team performance meter ppt powerpoint presentation diagrams. This is a five stage process. The stages in this process are business, meter, speed, time, sales.

Consulting Slides Circular Meter Agenda Diagram Business Presentation
This circular process layout helps to describe the ordered set of steps required to complete a task. You can download this diagram to make awesome presentations in PowerPoint.
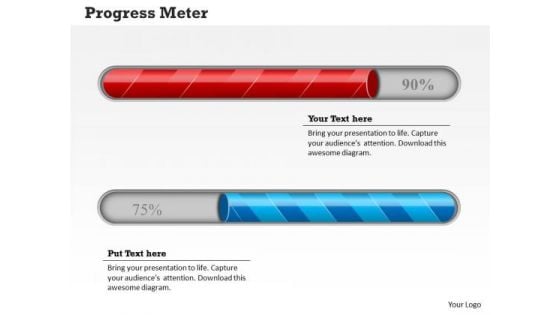
Strategy Diagram Meter Design For Business Progress Sales Diagram
Our Strategy Diagram Meter Design For Business Progress Sales Diagram Powerpoint Templates Abhor Doodling. They Never Let The Interest Flag.
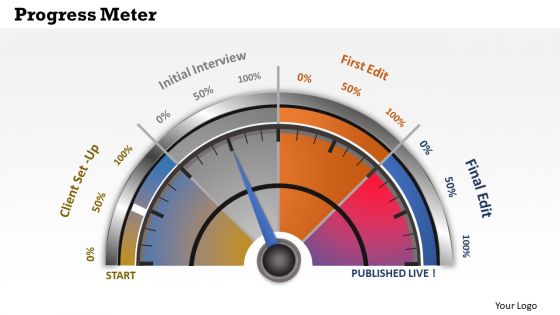
Consulting Diagram Business Dashboard Progress Meter Business Diagram
Be The Doer With Our Consulting Diagram Business Dashboard Progress Meter Business Diagram Powerpoint Templates. Put Your Thoughts Into Practice.
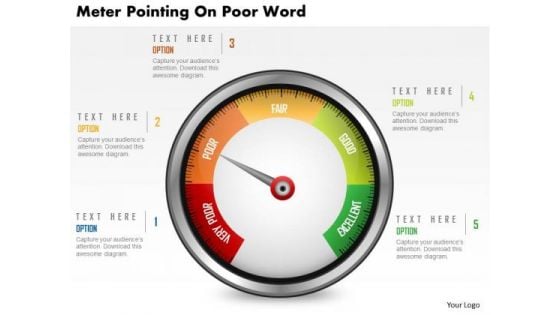
Business Diagram Meter Pointing On Poor Word Presentation Template
Graphic of meter has been used to design this power point template. This diagram contains the graphic of meter to display performance levels. Use this business diagram to make attractive presentations.
Employee Work Performance Monitoring Meter Icon Background PDF
Showcasing this set of slides titled Employee Work Performance Monitoring Meter Icon Background PDF. The topics addressed in these templates are Monitoring Meter Icon, Employee Work Performance. All the content presented in this PPT design is completely editable. Download it and make adjustments in color, background, font etc. as per your unique business setting.
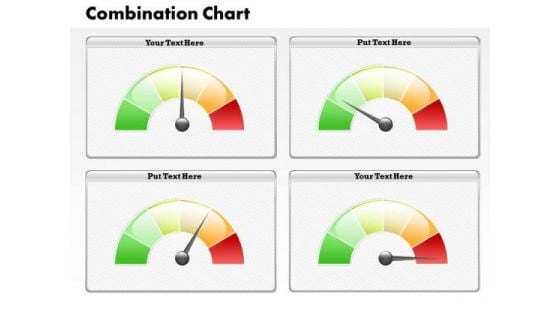
Sales Diagram Dashboard Meter For Business Information Business Diagram
Our Sales Diagram Dashboard Meter For Business Information Business Diagram Powerpoint Templates Deliver At Your Doorstep. Let Them In For A Wonderful Experience.
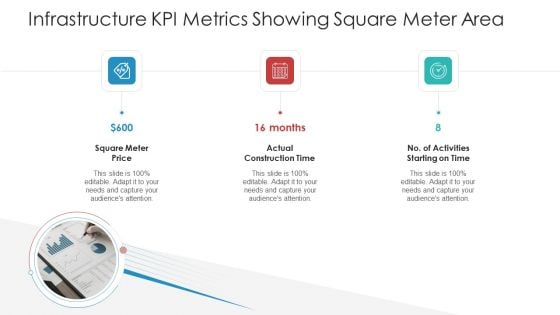
Infrastructure KPI Metrics Showing Square Meter Area Introduction PDF
This is a infrastructure kpi metrics showing square meter area introduction pdf template with various stages. Focus and dispense information on three stages using this creative set, that comes with editable features. It contains large content boxes to add your information on topics like square meter price actual, construction time, no of activities starting on time. You can also showcase facts, figures, and other relevant content using this PPT layout. Grab it now.
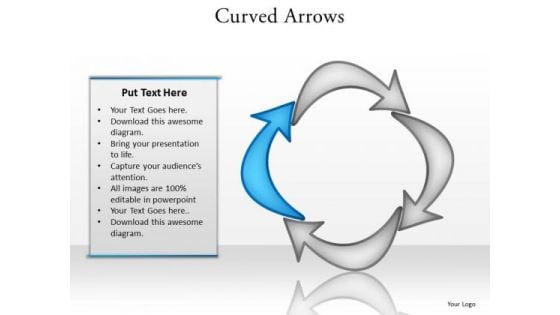
Ppt Curved Arrows PowerPoint Templates Pointing Inwards Step 4
PPT curved arrows powerpoint templates Pointing inwards step 4-This PowerPoint Diagram shows the highlighted blue arrow signifying the completion of process. It portrays the concept of bolt, cursor, dart, indicator, missile, pointer, projectile, shaft etc.-Can be used for presentations on around, arrow, business, button, chart, circle, collection, color, computer, curve, cycle, direction, down, ecology, element, environment, flowing, green, group, guidance, icon, isolated, leadership, leading, moving, pollution, processing, push, rotate, set, shape, shiny, sign, stick, symbol, triangle, turning, up, variation, waste-PPT curved arrows powerpoint templates Pointing inwards step 4 Our Ppt Curved Arrows PowerPoint Templates Pointing Inwards Step 4 are really considerate. They give everyone equal attention.
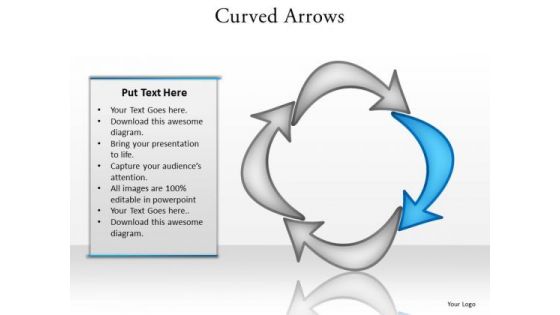
Ppt Curved Shapes Arrows PowerPoint Pointing Inwards Step 2 Templates
PPT curved shapes arrows powerpoint Pointing inwards step 2 Templates-This PowerPoint Diagram shows the highlighted blue arrow signifying the process is about to complete. It portrays the concept of bolt, cursor, dart, indicator, missile, pointer, projectile, shaft etc.-Can be used for presentations on around, arrow, business, button, chart, circle, collection, color, computer, curve, cycle, direction, down, ecology, element, environment, flowing, green, group, guidance, icon, isolated, leadership, leading, moving, pollution, processing, push, rotate, set, shape, shiny, sign, stick, symbol, triangle, turning, up, variation, waste-PPT curved shapes arrows powerpoint Pointing inwards step 2 Templates Factor it all in with our Ppt Curved Shapes Arrows PowerPoint Pointing Inwards Step 2 Templates. They account for every element.
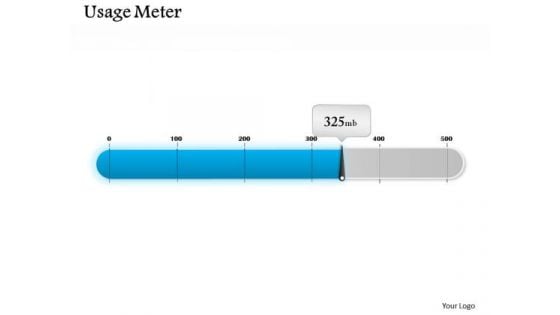
Mba Models And Frameworks Usage Meter Dashboard Design Consulting Diagram
Doll Up Your Thoughts With Our MBA Models And Frameworks Usage Meter Dashboard Design Consulting Diagram Powerpoint Templates. They Will Make A Pretty Picture.
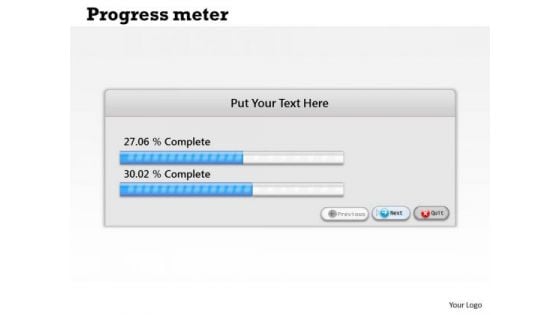
Strategic Management Progress Meter Dashboard Design Marketing Diagram
Be A Donor Of Great Ideas. Display Your Charity On Our Strategic Management Progress Meter Dashboard Design Marketing Diagram Powerpoint Templates.
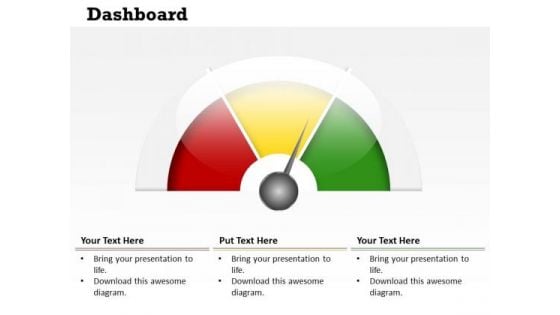
Business Framework Model Dashboard Business Meter Design Sales Diagram
Our Business Framework Model Dashboard Business Meter Design Sales Diagram Powerpoint Templates Team Are A Dogged Lot. They Keep At It Till They Get It Right.
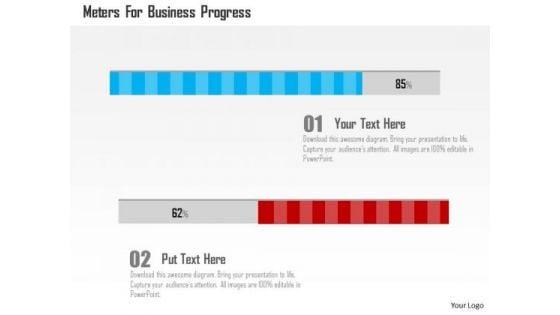
Business Diagram Meters For Business Progress Presentation Template
This business slide contains graphics of meter. You may use this slide to depict business progress. Download our above diagram to express information in a visual way.
Workforce Performance Measurement Meter Icon Ppt Portfolio Layouts PDF
Presenting Workforce Performance Measurement Meter Icon Ppt Portfolio Layouts PDF to dispense important information. This template comprises one stages. It also presents valuable insights into the topics including Workforce, Performance Measurement, Meter Icon. This is a completely customizable PowerPoint theme that can be put to use immediately. So, download it and address the topic impactfully.
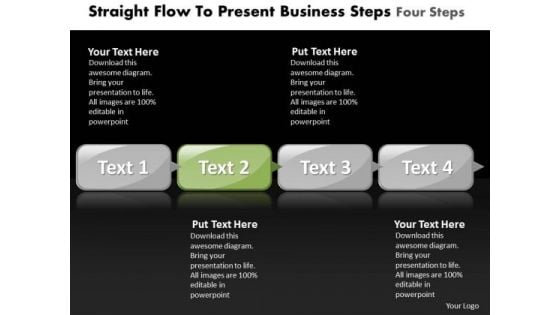
Ppt Series To Present Concept Download Steps Four PowerPoint Templates
PPT series to present concept download steps four PowerPoint Templates-This series of steps diagram is indicator of the path you have in mind. This image has been conceived to enable you to emphatically communicate your ideas in your Business presentation-PPT series to present concept download steps four PowerPoint Templates-achieve, achievement, axis, background, banking, business, chart, company, concept, corporate, director, economic, flow, goal, graph, human, increase, law, line, management, maths, money, national, personel, plan, profit, resources, retail, revenue, shop, statistic, straight, success, target Stitch together the fabric of your thoughts. Thread through with our Ppt Series To Present Concept Download Steps Four PowerPoint Templates.
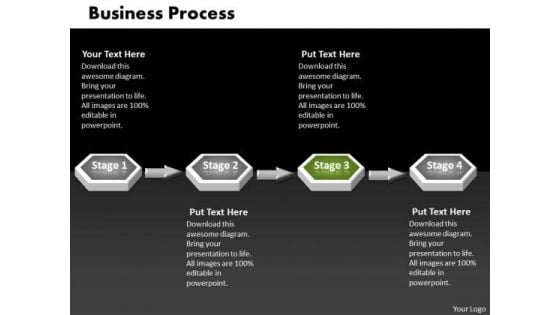
Ppt Green PowerPoint Slide Stage 3d Sequential Linear Process Templates
PPT green powerpoint slide stage 3d sequential linear process Templates-This Business PowerPoint Diagram shows 3d linear abstraction to represent Business related issues. It uses four stages. It indicates employment, field, function, game, line, and livelihood. It is helpful to organize information. -PPT green powerpoint slide stage 3d sequential linear process Templates-arrow, art, basic, blank, business, capital, chart, chevron, clip, clipart, colorful, conglomerates, consumer, copy, cyclical, energy, financial, flow, goods, graph, graphic, healthcare, illustration, infographic, information, investment, isolated, market, materials, non, round, sectors, services, slide, space, stock, technology, text, Make a fancy impression with our Ppt Green PowerPoint Slide Stage 3d Sequential Linear Process Templates. You will be at the top of your game.
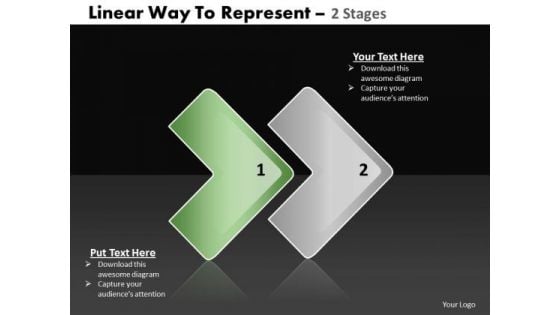
Ppt 2 State Diagram Linear Procurement Process PowerPoint Presentation Templates
PPT 2 state diagram linear procurement process powerpoint presentation Templates-Our Template designs are State of the Art. This one depicts the popular linear chart. The structure of our template allows you to effectively highlight the key issues concerning the growth of your business.-PPT 2 state diagram linear procurement process powerpoint presentation Templates-Aim, Arrow, Arrowheads, Badge, Border, Click, Connection, Curve, Design, Direction, Download, Element, Fuchsia, Icon, Illustration, Indicator, Internet, Magenta, Mark, Object, Orientation, Pointer, Shadow, Shape, Sign You know you have the feel for it. Confidently address your audience with our Ppt 2 State Diagram Linear Procurement Process PowerPoint Presentation Templates.
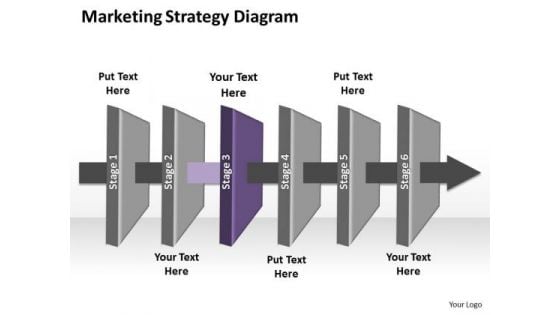
Ppt Linear Flow Of Marketing Startegy Swim Lane Diagram PowerPoint Template Templates
PPT linear flow of marketing startegy swim lane diagram powerpoint template Templates-In above diagram steps in a process are shown with symbolic shapes, and the flow of the process is indicated with arrow connecting the symbols. Create dynamic Microsoft office PPT Presentations with our professional template -PPT linear flow of marketing startegy swim lane diagram powerpoint template Templates-3d, Air, Arrow, Art, Business, Chart, Clip, Clipart, Cooling, Diagram, Drip, Drop, Dry, Energy, Eps10, Evaporate, Evaporating, Evaporation, Graphic, Heat, Icon, Illustration, Isolated, Isometric, Layers, Material, Moisture, Process Display leadership with our Ppt Linear Flow Of Marketing Startegy Swim Lane Diagram PowerPoint Template Templates. Download without worries with our money back guaranteee.
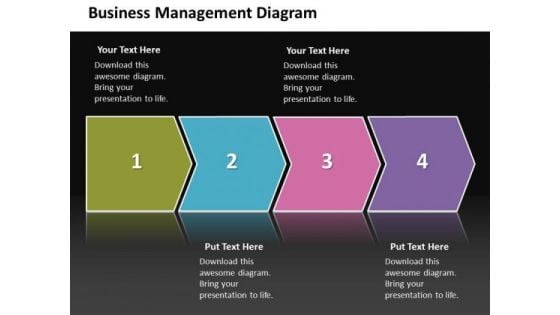
Ppt Linear Steps Business Process Management Diagram PowerPoint Free Templates
PPT linear steps business process management diagram powerpoint free Templates-Grab the attention of your team with this eye catching template presenting indicators of the path you have in mind. Use this diagram to enthuse your colleagues-PPT linear steps business process management diagram powerpoint free Templates-3d, Arrow, Background, Banner, Business, Chart, Colorful, Diagram, Direction, Element, Financial, Flow, Gradient, Illustration, Isolated, Mirrored, Placeholder, Presentation, Process, Steps Conservation of energy is the aim. Address environmental concerns with our Ppt Linear Steps Business Process Management Diagram PowerPoint Free Templates.


 Continue with Email

 Home
Home


